 🏗️ New Construction
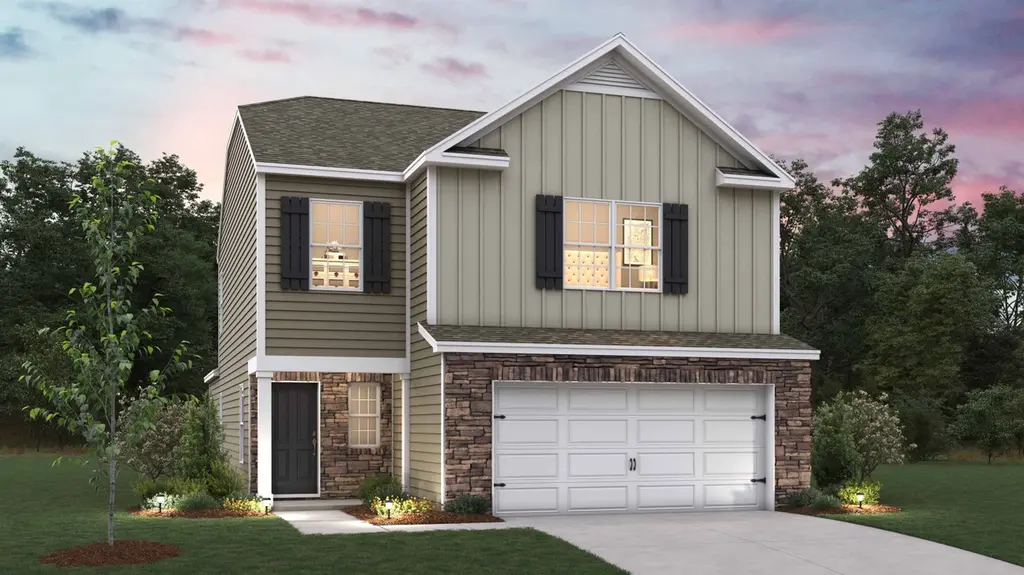
Manning Plan · Richburg, SC
Flood risk 1/10 · Minimal
- FEMA flood zone
- X (unshaded)
- Chance of flooding over 30 yrs
- 0.0%
- Est. flood insurance / yr
- $507 – $1,088
Fire risk 3/10 · Minor
- Est. fire insurance / yr
- $783 – $1,453
Heat risk 6/10 · Moderate
- Hot days now (above 105°F)
- 7 days/yr
- Hot days in 30 yrs
- 16 days/yr
Wind risk 6/10 · Moderate
- Chance of severe wind over 30 yrs
- 27.0%
Air-quality risk 3/10 · Minor
- Unhealthy air days now
- 2 days/yr
- Unhealthy air days in 30 yrs
- 2 days/yr
Risk factors via First Street. Map © Google.
Why this score? — see what drove the D- grade
The composite is a weighted blend of 9 inputs, each scored 0–100. Each bar is that input's sub-score; the figure is the points it added to the 100-point composite (weight × sub-score).
- Cash flow +9.1/30.0
- ARV discount +7.5/15.0
- Appreciation +6.5/10.0
- Livability +3.2/5.0
- 1% rule +2.8/10.0
- DSCR +2.5/10.0
- Rent growth +2.5/5.0
- Schools +2.3/10.0
- Condition / age +1.0/5.0
$333,990
🖨 Deal sheet 📄 Offer letter ✓ Due diligence
Listing remarks
The Manning is a thoughtfully designed two-story home that combines everyday comfort with flexible living space, offering a layout ideal for modern households. Located in Stanton in Chester, South Carolina, this inviting home features 4 bedrooms, 2.5 baths, and a 2-car garage, providing both functionality and room to grow. The main level welcomes you with a covered front porch and foyer that lead into an open and airy living space. At the heart of the home, the spacious living room flows seamlessly into the dining area and kitchen, creating an easy, connected layout perfect for everyday living and entertaining. The kitchen offers generous counter space, a central island, and convenient acce
Key facts
- Covered front porch
- Central island
- Spacious living room
Tags
Property features AI
Finance
- Other: Listed as Active; List price available (seller provided)
Exterior
- Parking: 2 total parking spaces; 2-car garage
- Home design: Single-family plan (Manning); New construction (Plan)
Interior
- Bedrooms: 4 bedrooms
- Bathrooms: 2 full bathrooms; 1 half bathroom
- Interior features: Open living area (2,203 total living area)
Neighborhood map
What this means for you Summary
Snapshot
- This is a 4-bed/2.5-bath single-family listed at $334k. Condition is rated poor.
Deal economics
- At list price, monthly cash flow is $-267 ($-3k/yr) — negative.
- To cash-flow at today's rent, offer at most $309k (7.4% below list).
- To meet the 1% rule (rent ≥ 1% of price), the offer needs to be $271k (19.0% below list).
- Recommended offer: $271k (19.0% below list) — sets the bar for 1% rule.
Location & tenants
- Location reads 63/100 on livability (#182 in SC) — a middle-class / working-renter tenant base. Strengths: cost of living A+, housing A+; Watch: schools D+, crime D+, health & safety D+.
- Chester 01 (rural): math 23% / reading 34% proficiency, ranked #59 of 80 in SC (top 74%) — low school quality limits family demand, transient renter base, plan for 1-2y turnover; 64% free/reduced lunch — lower-income household profile, screen leases tightly.
- Market conditions: 81 active listings in the ZIP; 269 units permitted in Chester County in 2024 (0 in 5+ unit buildings).
Forward outlook
- In year one you build about $13k of equity ($2k loan paydown + $10k appreciation (3.0% local appreciation)).
- Chester County population projected at -24% by 2050 — secular population decline; favor cash flow + early exit over multi-decade hold.
- By year 3, paydown + projected appreciation supports a ~$32k cash-out refi (75% LTV) — recoverable capital for the next deal without selling this one.
Negotiation context
- It's been on market 79 days — a 6% lower offer ($314k) is reasonable based on typical stale-listing flexibility.
Risks & watch-outs
- Climate carrying-cost: major wind risk, 27% chance of damaging wind over 30y; extreme-heat days projected 7→16/yr by 2055 (HVAC capex compounding) — expect insurance premiums to compound above CPI over the hold.
Questions for the listing agent
- What do current leases actually rent for vs. the listed asking? Can we see a recent rent roll and the last 12 months of T-12 income?
- It's been on market 79 days. Have you received any prior offers? Is the seller open to a 19% concession, seller financing, or rate buy-down credit?
- Have any recent inspections been done? Can we get a copy of the seller's disclosures and any deferred-maintenance estimates?
- Why hasn't it sold? Are there any deal-killer items the seller is aware of (foundation, flood, title, zoning, code violations)?
- Is there a deadline driving the sale (1031 exchange, divorce, estate, relocation)? That informs how much negotiation room exists.
- Schools are D-rated, which usually means shorter tenancies and higher turnover. Who's the typical renter profile here, and what's been the actual vacancy rate?
- Crime grade is D in this area — have there been break-ins, vandalism, or insurance claims at this property in the last 3 years? What carrier currently insures it and at what premium?
- The area grade is low — what's the realistic commute time and amenity access for the typical tenant pool here? Any planned neighborhood developments (good or bad) we should know about?
- What's the average days-on-market for RENTAL listings here right now (not sales)? A rising rental-DOM trend means longer vacancies and softer asking-rent achievability than the comps imply.
- What's the recent tenant-quality profile in this submarket — average credit score on applications, eviction rate, late-payment / NSF rate, and stable-employment percentage? A property-management company in the area should have these aggregated.
- How much new for-sale + rental construction is in the pipeline within 1–3 miles? Heavy new supply typically softens prices + rents 12–24 months out; constrained supply supports both.
Investment metrics
- 1% rule
- 0.78% ✗
- Cap rate
- 5.37%
- Cash-on-cash
- -3.29%
- DSCR
- 0.85
- GRM
- 10.7
CMA / ARV
- ARV (on-the-fly)
- $348,074
- Comps found
- 12
Show comp detail 12 sales within ~0.75 mi
| Address | Dist | Beds/Ba | Sqft | Sold | Price | $/sf | Match |
|---|---|---|---|---|---|---|---|
| 1316 Lily Dr | 0.06mi | 4/2.5 | 2,174 (-1%) | 1mo | $317,000 | $146 | 94 |
| 1240 Lavender Dr | 0.06mi | 3/2.5 (-1) | 2,175 (-1%) | 0mo | $325,850 | $150 | 90 |
| 1319 Lily Dr | 0.04mi | 3/2.5 (-1) | 2,175 (-1%) | 2mo | $321,000 | $148 | 90 |
| 1235 Lavender Dr | 0.07mi | 3/2.5 (-1) | 2,175 (-1%) | 1mo | $315,054 | $145 | 89 |
| 1234 Lavender Dr | 0.05mi | 5/3.0 (+1) | 2,368 (+8%) | 2mo | $329,000 | $139 | 77 |
| 699 Lamorak Pl | 0.67mi | 4/2.5 | 2,218 (+1%) | 3mo | $355,900 | $160 | 65 |
| 1513 Doran Ter | 0.69mi | 4/2.5 | 2,218 (+1%) | 2mo | $355,900 | $160 | 65 |
| 1110 Elyan St | 0.69mi | 4/2.5 | 2,218 (+1%) | 6mo | $349,900 | $158 | 62 |
| 642 Lamorak Pl | 0.61mi | 3/2.5 (-1) | 2,025 (-8%) | 10mo | $327,900 | $162 | 45 |
| 668 Lamorak Pl | 0.64mi | 3/2.5 (-1) | 2,025 (-8%) | 10mo | $327,900 | $162 | 44 |
| 1520 Doran Ter | 0.71mi | 3/2.5 (-1) | 2,025 (-8%) | 8mo | $304,900 | $151 | 42 |
| 596 Lamorak Pl | 0.59mi | 3/2.5 (-1) | 2,025 (-8%) | 20mo | $327,900 | $162 | 38 |
Match score weights: distance 35% · size 25% · config 20% · recency 20%. Top-matched comps best support the ARV.
Projected returns pro-forma
2.99% appreciation · 3.0% rent growth · sell at horizon
- IRR
- 4.4%
- Equity multiple
- 1.25×
- Total profit
- $24,841
- Equity at exit
- $156,380
- IRR
- 7.6%
- Equity multiple
- 2.15×
- Total profit
- $112,531
- Equity at exit
- $240,900
Cash invested: $97,461 (down + closing). Projections, not guarantees.
Landlord ↔ Tenant lean methodology
- Overall (STATE)
- 90 Strongly Landlord-Friendly
- State South Carolina
- 90 Strongly Landlord-Friendly · R+6
- County
- — inherits STATE
- City
- — inherits STATE
ZIP-level market 29729
- Home prices YoY
- 1.4%
- Active inventory
- 81
- Price-to-rent
- 10.3×
Monthly cashflow live
- Estimated rent
- $2,707 medium interval (Pro) →
- Mortgage (P&I)
- −$1,825
- Tax est. 1.5%
- −$435 /mo · $5,221/yr
- Insurance
- −$145
- HOA
- −$0
- Vacancy / Maint / Mgmt
- −$568
- Net cashflow
- $-267
Break-even live
UW: 25.0% down · 7.5% · 30yr · 1.5% tax · 5.0% vac · 8.0% maint · 8.0% mgmt
Financing live
Cash to close
- Down payment
- $87,018
- Closing costs
- $10,442
- Reserves months
- —
- Total cash needed
- —
Loan-product check · same deal, 3 products live
Conventional
25% down · 7.5% · 30yr
- Down + closing
- —
- Monthly P&I
- —
- Monthly cashflow
- —
- DSCR
- —
- Eligible?
- —
Personal DTI + credit; lowest rate.
DSCR
20% down · 8.5% · 30yr
- Down + closing
- —
- Monthly P&I
- —
- Monthly cashflow
- —
- DSCR
- —
- Eligible?
- —
No personal income docs; deal must DSCR.
Hard money
10% down · 12.0% · 12mo
- Down + closing
- —
- Monthly P&I
- —
- Monthly cashflow
- —
- DSCR
- —
- Eligible?
- —
Short-term bridge; refi at stabilization.
Listing history 13 events
-
2026-06-18days on market $333,990 Active 79 DOM
-
2026-06-17days on market $333,990 Active 78 DOM
-
2026-06-16days on market $333,990 Active 77 DOM
-
2026-06-15days on market $333,990 Active 76 DOM
-
2026-06-13days on market $333,990 Active 74 DOM
-
2026-06-09days on market $333,990 Active 70 DOM
-
2026-06-08days on market $333,990 Active 69 DOM
-
2026-06-07days on market $333,990 Active 68 DOM
-
2026-06-04days on market $333,990 Active 65 DOM
-
2026-06-03days on market $333,990 Active 64 DOM
-
2026-06-02days on market $333,990 Active 63 DOM
-
2026-06-01days on market $333,990 Active 62 DOM
-
2026-05-31days on market $333,990 Active 61 DOM
ⓘ Source: listings_history table (triggers on properties + properties_extension) + one-shot
backfill from property_details.listing_events for pre-trigger history.
Climate risk First Street
- Flood 1/10 Low FEMA zone X (unshaded) · 0% chance over 30 yrs
- Wildfire 3/10 Moderate
- Heat 6/10 Major 7 d/yr ≥105°F today · 16 d/yr by 30 yrs out
- Wind 6/10 Major 27% chance of damaging wind over 30 yrs
- Air quality 3/10 Moderate 2 unhealthy d/yr today · 2 by 30 yrs out
Nearby sold comps map
Loading sold comps map…
Walkable amenities ~0.75 mi
Loading nearby amenities…
Taxation est. · year 1
- Rental income
- $32,482
- − Mortgage interest
- −$19,498
- − Property taxes
- −$5,221
- − Insurance
- −$1,740
- − Repairs & maintenance
- −$2,599
- − Management
- −$2,599
- − Depreciation
- −$10,126
- Taxable loss
- −$9,300
- Est. tax savings @ 24.0%
- +$2,232
- After-tax cash flow
- $-973/yr
For passive investors: Depreciation is non-cash, so a rental often shows a tax loss while cash-flowing — sheltering income. Rental losses are passive: they offset passive income freely, and up to $25,000/yr can offset ordinary (W-2) income if you actively participate and your MAGI is under $100k (phasing out to $0 by $150k); unused losses carry forward. On sale, claimed depreciation is recaptured at up to 25%, and gains may owe capital-gains tax (a 1031 exchange can defer both). Figures are a year-1 estimate at your 24.0% rate — not tax advice; consult a CPA.
Condition & rehab AI · 1 photo
This property requires extensive repairs and improvements, including a new roof, exterior repairs, and landscaping, to become move-in ready and increase its value.
Repairs flagged
- Major roof — The satellite image shows significant damage to the roof.
- Major exterior walls — The satellite image shows significant discoloration and possible water damage.
- Major landscaping — The satellite image shows a large area of bare ground, suggesting the property may be vacant or in disrepair.
- Major fencing — The satellite image shows a large area of bare ground, suggesting the property may be vacant or in disrepair.
Value-add opportunities
- Both roof replacement — Re-roofing would significantly improve the home's appearance and functionality.
- Both exterior painting and repairs — Painting and repairing the exterior would enhance curb appeal and property value.
- Both landscaping and fencing — Landscaping and fencing would improve the home's curb appeal and make it more attractive to potential buyers or renters.
Renovation cost estimate screening
| Repair item | Severity | Est. cost |
|---|---|---|
| roof · The satellite image shows significant damage to the roof. | Major | $15,000–50,000 |
| exterior walls · The satellite image shows significant discoloration and possible water damage. | Major | $15,000–50,000 |
| landscaping · The satellite image shows a large area of bare ground, suggesting the property may be vacant or in disrepair. | Major | $15,000–50,000 |
| fencing · The satellite image shows a large area of bare ground, suggesting the property may be vacant or in disrepair. | Major | $15,000–50,000 |
| Total estimated repair cost · 4 items | $60,000–200,000 |
Value-add ROI direction
- Both roof replacement — Re-roofing would significantly improve the home's appearance and functionality. ↑
- Both exterior painting and repairs — Painting and repairing the exterior would enhance curb appeal and property value. ↑
- Both landscaping and fencing — Landscaping and fencing would improve the home's curb appeal and make it more attractive to potential buyers or renters. ↑
ⓘ Cost ranges are severity-bucket heuristics (US national rule-of-thumb). Get contractor quotes + a written scope before underwriting a rehab budget.
Schools (NCES district)
- District
- Chester 01
- NCES district ID
- 4501530
- Math proficiency
- 23% ▼ -6.00%
- Reading proficiency
- 34% ▬ 0.00%
- Median HH income
- $34,041
- Composite
- 23.39/100
- National rank
- #7902
- State rank
- #59 of 80 in SC
Livability — Richburg
- Score
- 63/100
- State rank
- #182
- US rank
- #15927
Category grades
Schools grade is shown separately in the Schools card above.
Census & demographics
- Population (ZIP)
- 2,313
Population outlook (Chester County) Hauer SSP2
- Today (2025)
- 30,121 people
- By 2030
- 28,700 · -4.7%
- By 2040
- 25,784 · -14.4%
- By 2050
- 23,001 · -23.6%
- By 2075
- 17,770 · -41.0%
- By 2100
- 13,584 · -54.9%
Race, ethnicity, and origin ACS 2023
- Neighborhood character
- Diverse neighborhood (Simpson 0.57)
- Race & ethnicity
- White 60% Black 26% Two or more races 12% Hispanic / Latino 7%
- Hispanic origin (detail)
- Mexican 2% Puerto Rican 5%
- Common ancestry
- Danish 2% Serbian 2% Lithuanian 2%
- Foreign-born
- 2% · Canada, Guatemala
- Languages at home
- 99% English-only · Spanish 1%
Political lean MEDSL · Chester
- 2024 margin
- R (+17.2) · D 40.8% · R 58.0% · Other 1.1%
- 2008→2024 swing
- -25.5pp toward R · 2008: 8.3pp · 2024: -17.2pp
- All cycles
- 2024: R+17.2 2020: R+10.9 2016: R+4.8 2012: D+10.5 2008: D+8.3
Not yet ingested
- Civics
- —
Market trends
- HPI YoY
- ▲ 2.99%
- Current HPI
- 210.6518
- Rent YoY
- —
- Metro
- —
- State GDP YoY
- ▲ 4.51%
- F500 in state
- 2
Industry mix (Fortune 500 HQ in SC)
| Industry | F500 HQs | Revenue |
|---|---|---|
| Packaging | 1 | $7B |
|
||
Cash-flow waterfall
monthlySold comps — $/sqft
last 12 mo · ≤1 miLoading sold comps…