520 Wilson St · Postville, IA
Flood risk 1/10 · Minimal
- FEMA flood zone
- X (unshaded)
- Chance of flooding over 30 yrs
- 0.0%
- Est. flood insurance / yr
- $507 – $1,088
Fire risk 1/10 · Minimal
- Est. fire insurance / yr
- $902 – $1,676
Heat risk 2/10 · Minimal
- Hot days now (above 98°F)
- 7 days/yr
- Hot days in 30 yrs
- 15 days/yr
Wind risk 2/10 · Minimal
- Chance of severe wind over 30 yrs
- —
Air-quality risk 1/10 · Minimal
- Unhealthy air days now
- 0 days/yr
- Unhealthy air days in 30 yrs
- 0 days/yr
Risk factors via First Street. Map © Google.
Why this score? — see what drove the C- grade
The composite is a weighted blend of 9 inputs, each scored 0–100. Each bar is that input's sub-score; the figure is the points it added to the 100-point composite (weight × sub-score).
- Cash flow +14.1/30.0
- Appreciation +7.8/10.0
- ARV discount +7.5/15.0
- DSCR +4.3/10.0
- Schools +4.1/10.0
- 1% rule +3.9/10.0
- Livability +3.6/5.0
- Condition / age +2.8/5.0
- Rent growth +2.5/5.0
$89,500
🖨 Deal sheet 📄 Offer letter ✓ Due diligence
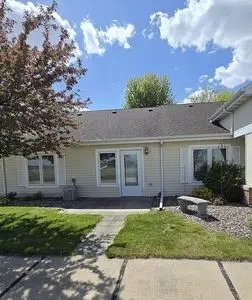
Listing remarks
Walk-in shower, Walk-in closet. Appliances, including in-unit washer dryer. Park in garage w locked storage unit. Secured hallway entry plus sunny east patio. Social commons room. Maintenance free living with rural views, quiet east edge of town. Immediate possession.
Key facts
- Sunny east patio
- Walk-in closet
- Locked storage unit
Tags
Neighborhood map
What this means for you Summary
Snapshot
- This is a 2-bed/1.0-bath other listed at $90k. Condition is rated average.
Deal economics
- At list price, monthly cash flow is $13 ($162/yr) — positive.
- The deal already cash-flows at list — no discount required.
- To meet the 1% rule (rent ≥ 1% of price), the offer needs to be $80k (10.6% below list).
- Recommended offer: $80k (10.6% below list) — sets the bar for 1% rule.
Location & tenants
- Location reads 72/100 on livability (#301 in IA) — a middle-class / working-renter tenant base. Strengths: cost of living A+, housing A+, health & safety A+; Watch: employment D+, schools D-, amenities F.
- Postville Community School District (rural): math 43% / reading 53% proficiency, ranked #284 of 289 in IA (top 98%) — families likely to look elsewhere, expect single-tenant / working-renter base with shorter leases; 68% free/reduced lunch — lower-income household profile, screen leases tightly.
- Market conditions: 10 active listings in the ZIP; 1 comparable units currently listed for rent nearby; 61 units permitted in Allamakee County in 2024 (0 in 5+ unit buildings).
Forward outlook
- In year one you build about $6k of equity ($619 loan paydown + $5k appreciation (5.6% local appreciation)).
- Allamakee County population projected at -26% by 2050 — secular population decline; favor cash flow + early exit over multi-decade hold.
- At projected returns (5.6% appreciation + 3.0% rent growth), your $25k cash investment doubles in ~4 years — after that, you're playing with house money.
- By year 6, paydown + projected appreciation supports a ~$31k cash-out refi (75% LTV) — recoverable capital for the next deal without selling this one.
Negotiation context
- It's been on market 37 days — a 3% lower offer ($87k) is reasonable based on typical stale-listing flexibility.
Questions for the listing agent
- It's been on market 37 days. Have you received any prior offers? Is the seller open to a 11% concession, seller financing, or rate buy-down credit?
- Is there a deadline driving the sale (1031 exchange, divorce, estate, relocation)? That informs how much negotiation room exists.
- Schools are D-rated, which usually means shorter tenancies and higher turnover. Who's the typical renter profile here, and what's been the actual vacancy rate?
- What's the average days-on-market for RENTAL listings here right now (not sales)? A rising rental-DOM trend means longer vacancies and softer asking-rent achievability than the comps imply.
- What's the recent tenant-quality profile in this submarket — average credit score on applications, eviction rate, late-payment / NSF rate, and stable-employment percentage? A property-management company in the area should have these aggregated.
- How much new for-sale + rental construction is in the pipeline within 1–3 miles? Heavy new supply typically softens prices + rents 12–24 months out; constrained supply supports both.
Investment metrics
- 1% rule
- 0.89% ✗
- Cap rate
- 6.47%
- Cash-on-cash
- 0.65%
- DSCR
- 1.03
- GRM
- 9.3
CMA / ARV
No comps found within radius.
Projected returns pro-forma
5.61% appreciation · 3.0% rent growth · sell at horizon
- IRR
- 14.9%
- Equity multiple
- 1.98×
- Total profit
- $24,631
- Equity at exit
- $54,050
- IRR
- 15.3%
- Equity multiple
- 3.89×
- Total profit
- $72,402
- Equity at exit
- $96,161
Cash invested: $25,060 (down + closing). Projections, not guarantees.
Landlord ↔ Tenant lean methodology
- Overall (STATE)
- 83 Strongly Landlord-Friendly
- State Iowa
- 83 Strongly Landlord-Friendly · R+6
- County
- — inherits STATE
- City
- — inherits STATE
ZIP-level market 52162
- Home prices YoY
- 2.8%
- Active inventory
- 10
- Price-to-rent
- 9.3×
Monthly cashflow live
- Estimated rent
- $800 medium interval (Pro) →
- Mortgage (P&I)
- −$469
- Tax est. 1.5%
- −$112 /mo · $1,342/yr
- Insurance
- −$37
- HOA
- −$0
- Vacancy / Maint / Mgmt
- −$168
- Net cashflow
- $13
Break-even live
UW: 25.0% down · 7.5% · 30yr · 1.5% tax · 5.0% vac · 8.0% maint · 8.0% mgmt
Financing live
Cash to close
- Down payment
- $22,375
- Closing costs
- $2,685
- Reserves months
- —
- Total cash needed
- —
Loan-product check · same deal, 3 products live
Conventional
25% down · 7.5% · 30yr
- Down + closing
- —
- Monthly P&I
- —
- Monthly cashflow
- —
- DSCR
- —
- Eligible?
- —
Personal DTI + credit; lowest rate.
DSCR
20% down · 8.5% · 30yr
- Down + closing
- —
- Monthly P&I
- —
- Monthly cashflow
- —
- DSCR
- —
- Eligible?
- —
No personal income docs; deal must DSCR.
Hard money
10% down · 12.0% · 12mo
- Down + closing
- —
- Monthly P&I
- —
- Monthly cashflow
- —
- DSCR
- —
- Eligible?
- —
Short-term bridge; refi at stabilization.
Rent comps 1 comps
| Address | Beds | Baths | Sqft | Rent | $/sqft | DOM | Units | Dist |
|---|---|---|---|---|---|---|---|---|
| 220 States Dr Apt 19 Postville, IA | 2.0 | 1.0 | 800 | $800 | $1.00 | 2d | 1 | 0.89mi |
Listing history 17 events
-
2026-06-18days on market $89,500 Active 37 DOM
-
2026-06-17days on market $89,500 Active 36 DOM
-
2026-06-16days on market $89,500 Active 35 DOM
-
2026-06-15days on market $89,500 Active 34 DOM
-
2026-06-14days on market $89,500 Active 32 DOM
-
2026-06-13days on market $89,500 Active 31 DOM
-
2026-06-10days on market $89,500 Active 29 DOM
-
2026-06-09days on market $89,500 Active 28 DOM
-
2026-06-08days on market $89,500 Active 27 DOM
-
2026-06-07days on market $89,500 Active 26 DOM
-
2026-06-05days on market $89,500 Active 23 DOM
-
2026-06-03days on market $89,500 Active 22 DOM
-
2026-06-02days on market $89,500 Active 21 DOM
-
2026-06-01days on market $89,500 Active 20 DOM
-
2026-05-31days on market $89,500 Active 19 DOM
-
2026-05-31days on market $89,500 Active 18 DOM
-
2026-05-12$89,500 Active 268-char remark
ⓘ Source: listings_history table (triggers on properties + properties_extension) + one-shot
backfill from property_details.listing_events for pre-trigger history.
Climate risk First Street
- Flood 1/10 Low FEMA zone X (unshaded) · 0% chance over 30 yrs
- Wildfire 1/10 Low
- Heat 2/10 Low 7 d/yr ≥98°F today · 15 d/yr by 30 yrs out
- Wind 2/10 Low
- Air quality 1/10 Low 0 unhealthy d/yr today · 0 by 30 yrs out
Nearby sold comps map
Loading sold comps map…
Walkable amenities ~0.75 mi
Loading nearby amenities…
Taxation est. · year 1
- Rental income
- $9,600
- − Mortgage interest
- −$5,013
- − Property taxes
- −$1,342
- − Insurance
- −$448
- − Repairs & maintenance
- −$768
- − Management
- −$768
- − Depreciation
- −$2,604
- Taxable loss
- −$1,343
- Est. tax savings @ 24.0%
- +$322
- After-tax cash flow
- $484/yr
For passive investors: Depreciation is non-cash, so a rental often shows a tax loss while cash-flowing — sheltering income. Rental losses are passive: they offset passive income freely, and up to $25,000/yr can offset ordinary (W-2) income if you actively participate and your MAGI is under $100k (phasing out to $0 by $150k); unused losses carry forward. On sale, claimed depreciation is recaptured at up to 25%, and gains may owe capital-gains tax (a 1031 exchange can defer both). Figures are a year-1 estimate at your 24.0% rate — not tax advice; consult a CPA.
Condition & rehab AI · 1 photo
The home is in average condition with some cosmetic repairs needed, particularly to the interior walls and paint. Upgrading the interior and appliances would significantly increase its value.
Repairs flagged
- Major interior walls/paint — Paint appears worn and needs repainting
Value-add opportunities
- Both Paint interior walls — Repainting interior walls can improve the home's appearance and increase its value
- Both Replace worn flooring — Replacing worn flooring can improve the home's appearance and increase its value
- Both Upgrade kitchen appliances — Upgrading kitchen appliances can improve the home's appeal and increase its value
- Both Upgrade bathrooms — Upgrading bathrooms can improve the home's appeal and increase its value
Renovation cost estimate screening
| Repair item | Severity | Est. cost |
|---|---|---|
| interior walls/paint · Paint appears worn and needs repainting | Major | $15,000–50,000 |
| Total estimated repair cost · 1 items | $15,000–50,000 |
Value-add ROI direction
- Both Paint interior walls — Repainting interior walls can improve the home's appearance and increase its value ↑
- Both Replace worn flooring — Replacing worn flooring can improve the home's appearance and increase its value ↑
- Both Upgrade kitchen appliances — Upgrading kitchen appliances can improve the home's appeal and increase its value ↑
- Both Upgrade bathrooms — Upgrading bathrooms can improve the home's appeal and increase its value ↑
ⓘ Cost ranges are severity-bucket heuristics (US national rule-of-thumb). Get contractor quotes + a written scope before underwriting a rehab budget.
Schools (NCES district)
- District
- Postville Community School District
- NCES district ID
- 1923340
- Math proficiency
- 43% ▼ -2.00%
- Reading proficiency
- 53% ▲ 8.00%
- Median HH income
- $45,842
- Composite
- 40.69/100
- National rank
- #3670
- State rank
- #284 of 289 in IA
Livability — Postville
- Score
- 72/100
- State rank
- #301
- US rank
- #5827
Category grades
Schools grade is shown separately in the Schools card above.
Census & demographics
- Census place
- Postville, IA
- Population (ZIP)
- 3,576
Population outlook (Allamakee County) Hauer SSP2
- Today (2025)
- 12,814 people
- By 2030
- 12,146 · -5.2%
- By 2040
- 10,750 · -16.1%
- By 2050
- 9,506 · -25.8%
- By 2075
- 7,779 · -39.3%
- By 2100
- 6,870 · -46.4%
Race, ethnicity, and origin ACS 2023
- Neighborhood character
- Diverse neighborhood (Simpson 0.57)
- Race & ethnicity
- White 56% Hispanic / Latino 32% Two or more races 14% Black 8% Native American 2% Asian 1%
- Hispanic origin (detail)
- Mexican 18% Puerto Rican 2%
- Common ancestry
- Portuguese 8% Scotch-Irish 3% Subsaharan African 3%
- Foreign-born
- 24% · Canada, China
- Languages at home
- 56% English-only · Spanish 29% German/W. Germanic 4% Russian/Polish/Slavic 3%
Political lean MEDSL · Allamakee
- 2024 margin
- Solid R (+34.3) · D 32.2% · R 66.5% · Other 1.3%
- 2008→2024 swing
- -48.6pp toward R · 2008: 14.2pp · 2024: -34.3pp
- All cycles
- 2024: R+34.3 2020: R+29.1 2016: R+24.3 2012: D+4.1 2008: D+14.2
Not yet ingested
- Civics
- —
Market trends
- HPI YoY
- ▲ 5.61%
- Current HPI
- 206.7688
- Rent YoY
- —
- Metro
- —
- State GDP YoY
- ▲ 2.48%
- F500 in state
- 4
Industry mix (Fortune 500 HQ in IA)
| Industry | F500 HQs | Revenue |
|---|---|---|
| Financial Services | 1 | $16B |
|
||
| Retail / Convenience | 1 | $15B |
|
||
Price history
1 event — show timeline
- 2026-05-12 Listed $89,500 FSBO.com
Cash-flow waterfall
monthlySold comps — $/sqft
last 12 mo · ≤1 miLoading sold comps…