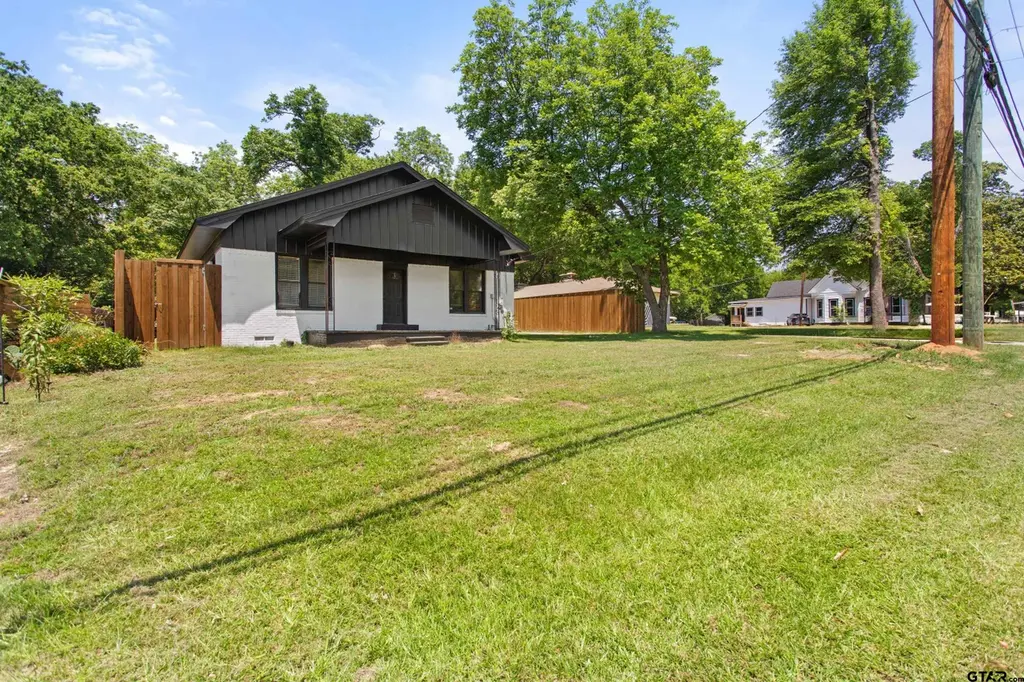
307 W South St · Lindale, TX
Flood risk 1/10 · Minimal
- FEMA flood zone
- X (unshaded)
- Chance of flooding over 30 yrs
- 0.0%
- Est. flood insurance / yr
- $507 – $1,088
Fire risk 4/10 · Minor
- Est. fire insurance / yr
- $1,222 – $2,270
Heat risk 6/10 · Moderate
- Hot days now (above 109°F)
- 7 days/yr
- Hot days in 30 yrs
- 25 days/yr
Wind risk 6/10 · Moderate
- Chance of severe wind over 30 yrs
- 52.0%
Air-quality risk 2/10 · Minimal
- Unhealthy air days now
- 0 days/yr
- Unhealthy air days in 30 yrs
- 1 days/yr
Risk factors via First Street. Map © Google.
Why this score? — see what drove the D grade
The composite is a weighted blend of 9 inputs, each scored 0–100. Each bar is that input's sub-score; the figure is the points it added to the 100-point composite (weight × sub-score).
- ARV discount +15.0/15.0
- Cash flow +9.1/30.0
- Schools +5.9/10.0
- Livability +4.0/5.0
- 1% rule +3.2/10.0
- DSCR +2.5/10.0
- Rent growth +2.5/5.0
- Condition / age +2.5/5.0
- Appreciation +0.0/10.0
$145,000
🖨 Deal sheet (PDF) 📄 Offer letter ✓ Due diligence
Listing remarks
Charming older home in the heart of Lindale offering excellent potential for investors or buyers looking to add their own finishing touches. The roof is approximately 7 years old, and the exterior was freshly painted in 2026. Inside, you’ll find thoughtful updates including granite countertops, new backsplash, and updated kitchen cabinets, along with updated flooring and a refreshed bathroom. With a central location convenient to everything Lindale has to offer, this property presents a great opportunity as a fixer-upper, rental, or investment project.
Key facts
- 0.23 acre lot
- Built 1907
- Listed 37 days
Property features AI
Exterior
- Parking: Paved parking
- Utilities: Public water; Public sewer
- Home design: Single-family detached residence; Single story
- Construction: Brick veneer construction; Composition roof
- Exterior features: Porch; Wood fencing; Storage structure
Interior
- Kitchen: Dishwasher; Gas oven; Gas range; Microwave
- Flooring: Tile; Wood
- Bathrooms: 1 full bathroom
- Heating & cooling: No heating
- Interior features: Pantry
Neighborhood map
What this means for you Summary
Snapshot
- This is a 3-bed/1.0-bath single-family listed at $145k.
Deal economics
- At list price, monthly cash flow is $-110 ($-1k/yr) — negative.
- To cash-flow at today's rent, offer at most $126k (13.4% below list).
- To meet the 1% rule (rent ≥ 1% of price), the offer needs to be $118k (18.3% below list).
- Recommended offer: $118k (18.3% below list) — sets the bar for 1% rule.
- Cap rate 5.4% vs local median 3.1% in Lindale — top-decile yield for the area; either an underpriced asset or a hidden risk that comps aren't pricing in. Stress-test before assuming the spread holds.
Location & tenants
- Location reads 79/100 on livability (#52 in TX, #2,100 nationally) — a middle-class / working-renter tenant base. Strengths: employment A+, cost of living A+, housing A+; Watch: amenities F, commute F.
- Lindale ISD (town): math 71% / reading 66% proficiency, ranked #20 of 826 in TX (top 2%) — acceptable for families but not a draw, mixed tenant base, ~2y average lease.
- Zoned schools: Velma Penny El (math 67% / reading 67%, grade B+, #199 of 4,322 statewide, top 5%, 541 students, 48% FRL); Lindale J H (math 81% / reading 72%, grade A, #30 of 1,662 statewide, top 2%, 711 students, 44% FRL); Lindale H S (math 79% / reading 75%, grade A-, #60 of 1,632 statewide, top 4%, 1,265 students, 38% FRL).
- Market conditions: 640 active listings in the ZIP; 16 comparable units currently listed for rent nearby; rentals at typical pace (median 23d on market — plan ~3-4 weeks tenant-placement turnaround); solid renter incomes; 595 units permitted in Smith County in 2024 (45 in 5+ unit buildings).
- This rent is only 15% of the median local income ($93k/yr) — well below the 30% rent-burden line; pricing power to push rent on renewal without tenant pushback.
Forward outlook
- Local home prices are declining (-3.0%/yr); year-one equity from $1k of loan paydown is wiped out by about $4k of value loss. Plan a longer hold.
- Smith County population projected at +24% by 2050 — long-run rental-demand tailwind backs the buy-and-hold thesis.
Negotiation context
- It's been on market 37 days — a 3% lower offer ($141k) is reasonable based on typical stale-listing flexibility.
Risks & watch-outs
- Watch-outs: built in 1907 — expect roof / HVAC / electrical / plumbing capex.
- Climate carrying-cost: major wind risk, 52% chance of damaging wind over 30y; extreme-heat days projected 7→25/yr by 2055 (HVAC capex compounding) — expect insurance premiums to compound above CPI over the hold.
Questions for the listing agent
- What do current leases actually rent for vs. the listed asking? Can we see a recent rent roll and the last 12 months of T-12 income?
- It's been on market 37 days. Have you received any prior offers? Is the seller open to a 18% concession, seller financing, or rate buy-down credit?
- Built in 1907 — when were the roof, HVAC, electrical panel, plumbing, and water heater last replaced?
- Is there a deadline driving the sale (1031 exchange, divorce, estate, relocation)? That informs how much negotiation room exists.
- The area grade is low — what's the realistic commute time and amenity access for the typical tenant pool here? Any planned neighborhood developments (good or bad) we should know about?
- What's the average days-on-market for RENTAL listings here right now (not sales)? A rising rental-DOM trend means longer vacancies and softer asking-rent achievability than the comps imply.
- What's the recent tenant-quality profile in this submarket — average credit score on applications, eviction rate, late-payment / NSF rate, and stable-employment percentage? A property-management company in the area should have these aggregated.
- How much new for-sale + rental construction is in the pipeline within 1–3 miles? Heavy new supply typically softens prices + rents 12–24 months out; constrained supply supports both.
Investment metrics
- 1% rule
- 0.82% ✗
- Cap rate
- 5.38%
- Cash-on-cash
- -3.26%
- DSCR
- 0.85
- GRM
- 10.2
CMA / ARV
- ARV (median comp)
- $199,787
- List price
- $145,000
- Delta
- -27.42%
- Verdict
- UNDERPRICED
- Comps
- 20 within 1.0 mi
Show comp detail 7 sales within ~0.75 mi
| Address | Dist | Beds/Ba | Sqft | Sold | Price | $/sf | Match |
|---|---|---|---|---|---|---|---|
| 204 Mount Sylvan St | 0.14mi | 3/1.0 | 1,196 (+0%) | 5mo | $159,900 | $134 | 89 |
| 505 S Boyd | 0.17mi | 2/1.0 (-1) | 1,160 (-2%) | 11mo | $209,900 | $181 | 74 |
| 6037 Freedom Dr | 0.22mi | 3/2.0 | 1,264 (+6%) | 10mo | $234,990 | $186 | 67 |
| 313 Half St | 0.33mi | 3/2.0 | 1,175 (-1%) | 17mo | $199,000 | $169 | 64 |
| 704 Circle Dr | 0.36mi | 3/2.0 | 1,260 (+6%) | 17mo | $227,500 | $181 | 55 |
| 519 N College St | 0.46mi | 3/2.0 | 1,316 (+11%) | 15mo | $209,900 | $159 | 45 |
| 402 Mission Crest Cir | 0.57mi | 3/2.0 | 1,338 (+12%) | 13mo | $268,995 | $201 | 38 |
Match score weights: distance 35% · size 25% · config 20% · recency 20%. Top-matched comps best support the ARV.
Projected returns pro-forma
-3.0% appreciation · 3.0% rent growth · sell at horizon
- IRR
- -21.7%
- Equity multiple
- 0.25×
- Total profit
- $-30,477
- Equity at exit
- $21,620
- IRR
- -15.4%
- Equity multiple
- 0.13×
- Total profit
- $-35,402
- Equity at exit
- $12,537
Cash invested: $40,600 (down + closing). Projections, not guarantees.
Landlord ↔ Tenant lean methodology
- Overall (STATE)
- 87 Strongly Landlord-Friendly
- State Texas
- 87 Strongly Landlord-Friendly · R+5
- County
- — inherits STATE
- City
- — inherits STATE
ZIP-level market 75771
- Home prices YoY
- -30.6%
- Active inventory
- 640
- Price-to-rent
- 10.2×
Monthly cashflow live
- Estimated rent
- $1,185 high interval (Pro) →
- Mortgage (P&I)
- −$760
- Tax from tax record
- −$225 /mo · $2,704/yr
- Insurance
- −$60
- HOA
- −$0
- Vacancy / Maint / Mgmt
- −$249
- Net cashflow
- $-110
Break-even live
Sensitivity live
| Price | -10% $-28 | -5% $-69 | +0% $-110 | +5% $-151 | +10% $-192 |
|---|---|---|---|---|---|
| Rent | -10% $-204 | -5% $-157 | +0% $-110 | +5% $-64 | +10% $-17 |
| Rate | -1.0pp $-37 | -0.5pp $-73 | base $-110 | +0.5pp $-148 | +1.0pp $-186 |
UW: 25.0% down · 7.5% · 30yr · 1.5% tax · 5.0% vac · 8.0% maint · 8.0% mgmt
Financing live
Cash to close
- Down payment
- $36,250
- Closing costs
- $4,350
- Reserves months
- —
- Total cash needed
- —
Loan-product check · same deal, 3 products live
Conventional
25% down · 7.5% · 30yr
- Down + closing
- —
- Monthly P&I
- —
- Monthly cashflow
- —
- DSCR
- —
- Eligible?
- —
Personal DTI + credit; lowest rate.
DSCR
20% down · 8.5% · 30yr
- Down + closing
- —
- Monthly P&I
- —
- Monthly cashflow
- —
- DSCR
- —
- Eligible?
- —
No personal income docs; deal must DSCR.
Hard money
10% down · 12.0% · 12mo
- Down + closing
- —
- Monthly P&I
- —
- Monthly cashflow
- —
- DSCR
- —
- Eligible?
- —
Short-term bridge; refi at stabilization.
Rent comps 16 comps
| Address | Beds | Baths | Sqft | Rent | $/sqft | DOM | Units | Dist |
|---|---|---|---|---|---|---|---|---|
| 300 Hilltop St Unit 29 Lindale, TX | 2.0 | 1.0 | 870 | $895 | $1.03 | 15d | 1 | 0.13mi |
| 300 Hilltop St Unit 13 Lindale, TX | 2.0 | 1.0 | 850 | $875 | $1.03 | 45d | 1 | 0.13mi |
| 300 Hilltop St Unit 16 Lindale, TX | 2.0 | 1.0 | 870 | $875 | $1.01 | 15d | 1 | 0.13mi |
| 303 Cooper St Unit 13 Lindale, TX | 2.0 | 1.0 | 850 | $875 | $1.03 | 45d | 1 | 0.23mi |
| 303 Cooper St Unit 16 Lindale, TX | 2.0 | 1.0 | 870 | $875 | $1.01 | 15d | 1 | 0.23mi |
| 302 E South St Lindale, TX | 2.0 | 1.0 | 990 | $1,195 | $1.21 | 15d | 1 | 0.28mi |
| 206 Cooper St Lindale, TX | 2.0 | 1.0 | 1200 | $1,400 | $1.17 | 45d | 1 | 0.29mi |
| 527 N College St Lindale, TX | 2.0 | 1.5 | 1267 | $1,300 | $1.03 | 45d | 1 | 0.47mi |
| 527 N College St Unit 13 Lindale, TX | 2.0 | 1.5 | 1267 | $1,395 | $1.10 | 23d | 1 | 0.47mi |
| 602 E South St Unit 3 Lindale, TX | 2.0 | 1.0 | 950 | $1,200 | $1.26 | 23d | 1 | 0.55mi |
| 14560 Tucker St Unit 11 Lindale, TX | 2.0 | 1.0 | 719 | $1,150 | $1.60 | 45d | 1 | 0.64mi |
| 14560 Tucker St N Lindale, TX | 2.0 | 1.0 | 719 | $1,150 | $1.60 | 23d | 1 | 0.64mi |
| 1238 Brad Cir Unit a Lindale, TX | 2.0 | 1.5 | 825 | $1,025 | $1.24 | 23d | 1 | 0.86mi |
| 117 Legends Ct Lindale, TX | 1.0–2.0 | 1.0 | 850 | $1,625 | $1.91 | 15d | 6 | 1.06mi |
| 15996 FM 849 Tyler, TX | 2.0 | 1.0 | 1080 | $1,425 | $1.32 | 23d | 1 | 1.11mi |
| 13780 County Road 4198 Lindale, TX | 3.0 | 2.0 | 1212 | $1,500 | $1.24 | 23d | 1 | 1.17mi |
Listing history 20 events
-
2026-06-22days on market $145,000 Active 37 DOM
-
2026-06-19days on market $145,000 Active 35 DOM
-
2026-06-18days on market $145,000 Active 34 DOM
-
2026-06-17days on market $145,000 Active 33 DOM
-
2026-06-16days on market $145,000 Active 32 DOM
-
2026-06-15days on market $145,000 Active 31 DOM
-
2026-06-14days on market $145,000 Active 29 DOM
-
2026-06-13days on market $145,000 Active 28 DOM
-
2026-06-10days on market $145,000 Active 26 DOM
-
2026-06-09days on market $145,000 Active 25 DOM
-
2026-06-08days on market $145,000 Active 24 DOM
-
2026-06-07days on market $145,000 Active 23 DOM
-
2026-06-03days on market $145,000 Active 19 DOM
-
2026-06-02days on market $145,000 Active 18 DOM
-
2026-06-01days on market $145,000 Active 17 DOM
-
2026-05-31days on market $145,000 Active 16 DOM
-
2026-05-30days on market $145,000 Active 15 DOM
-
2026-05-15$145,000 Active 564-char remark
-
2026-02-19soldstatus
-
2025-04-09soldstatus
ⓘ Source: listings_history table (triggers on properties + properties_extension) + one-shot
backfill from property_details.listing_events for pre-trigger history.
Tax reassessment forecast TX · Resets to sale price
- Current annual tax
- $2,704 · $225/mo
- Projected year-2 tax
- $2,704 · $225/mo
- Expected delta
- $0/yr ($0/mo · 0.0%)
ⓘ Screening estimate from a state-policy table — verify with the county assessor before closing.
Climate risk First Street
- Flood 1/10 Low FEMA zone X (unshaded) · 0% chance over 30 yrs
- Wildfire 4/10 Moderate
- Heat 6/10 Major 7 d/yr ≥109°F today · 25 d/yr by 30 yrs out
- Wind 6/10 Major 52% chance of damaging wind over 30 yrs
- Air quality 2/10 Low 0 unhealthy d/yr today · 1 by 30 yrs out
Nearby sold comps map
Loading sold comps map…
Walkable amenities ~0.75 mi
Loading nearby amenities…
Taxation est. · year 1
- Rental income
- $14,215
- − Mortgage interest
- −$8,122
- − Property taxes
- −$2,704
- − Insurance
- −$725
- − Repairs & maintenance
- −$1,137
- − Management
- −$1,137
- − Depreciation
- −$4,218
- Taxable loss
- −$3,829
- Est. tax savings @ 24.0%
- +$919
- After-tax cash flow
- $-405/yr
For passive investors: Depreciation is non-cash, so a rental often shows a tax loss while cash-flowing — sheltering income. Rental losses are passive: they offset passive income freely, and up to $25,000/yr can offset ordinary (W-2) income if you actively participate and your MAGI is under $100k (phasing out to $0 by $150k); unused losses carry forward. On sale, claimed depreciation is recaptured at up to 25%, and gains may owe capital-gains tax (a 1031 exchange can defer both). Figures are a year-1 estimate at your 24.0% rate — not tax advice; consult a CPA.
Schools (NCES district)
- District
- Lindale ISD
- NCES district ID
- 4827510
- Math proficiency
- 71% ▼ -2.00%
- Reading proficiency
- 66% ▲ 4.00%
- Median HH income
- $57,325
- Composite
- 58.85/100
- National rank
- #974
- State rank
- #20 of 826 in TX
Livability — Lindale
- Score
- 79/100
- State rank
- #52
- US rank
- #2100
Category grades
Schools grade is shown separately in the Schools card above.
Census & demographics
- Census place
- Lindale, TX
- County
- Smith County · 180,570 people
- City population
- 21,238
- Metro
- Tyler, TX
- Population (ZIP)
- 21,238
- Household income
- $93,462
- Rent vs Own
- Severe rent burden
- 166.0
Population outlook (Smith County) Hauer SSP2
- Today (2025)
- 248,890 people
- By 2030
- 261,665 · +5.1%
- By 2040
- 286,114 · +15.0%
- By 2050
- 308,006 · +23.8%
- By 2075
- 354,171 · +42.3%
- By 2100
- 372,828 · +49.8%
Race, ethnicity, and origin ACS 2023
- Neighborhood character
- Predominantly White (81%)
- Race & ethnicity
- White 81% Hispanic / Latino 9% Two or more races 6% Black 5% Asian 2%
- Hispanic origin (detail)
- Mexican 8%
- Common ancestry
- Slovak 3% Serbian 2% Lithuanian 1%
- Foreign-born
- 5% · Canada, China
- Languages at home
- 93% English-only · Spanish 6%
Political lean MEDSL · Smith
- 2024 margin
- Solid R (+45.1) · D 27.0% · R 72.1%
- 2008→2024 swing
- -5.6pp toward R · 2008: -39.5pp · 2024: -45.1pp
- All cycles
- 2024: R+45.1 2020: R+39.4 2016: R+43.9 2012: R+46.9 2008: R+39.5
Not yet ingested
- Civics
- —
Market trends
- HPI YoY
- ▼ -88.40%
- Current HPI
- 200.187
- Rent YoY
- —
- Metro
- Tyler, TX
- State GDP YoY
- ▲ 3.95%
- F500 in state
- 110
Industry mix (Fortune 500 HQ in TX)
| Industry | F500 HQs | Revenue |
|---|---|---|
| Energy | 16 | $1,198B |
|
||
| Technology | 5 | $198B |
|
||
| Engineering / Construction | 4 | $72B |
|
||
| Energy Services | 3 | $60B |
|
||
| Utilities | 3 | $41B |
|
||
| Healthcare | 2 | $330B |
|
||
Price history
3 events — show timeline
- 2026-05-15 Listed $145,000 GTAR
- 2026-02-19 Sold (Public Records) — Public Records
- 2025-04-09 Sold (Public Records) — Public Records
Property tax history
+7.6%/yrLatest (2024): $2,704 · +19.4% YoY. Source: county tax records.
Cash-flow waterfall
monthlySold comps — $/sqft
last 12 mo · ≤1 miLoading sold comps…