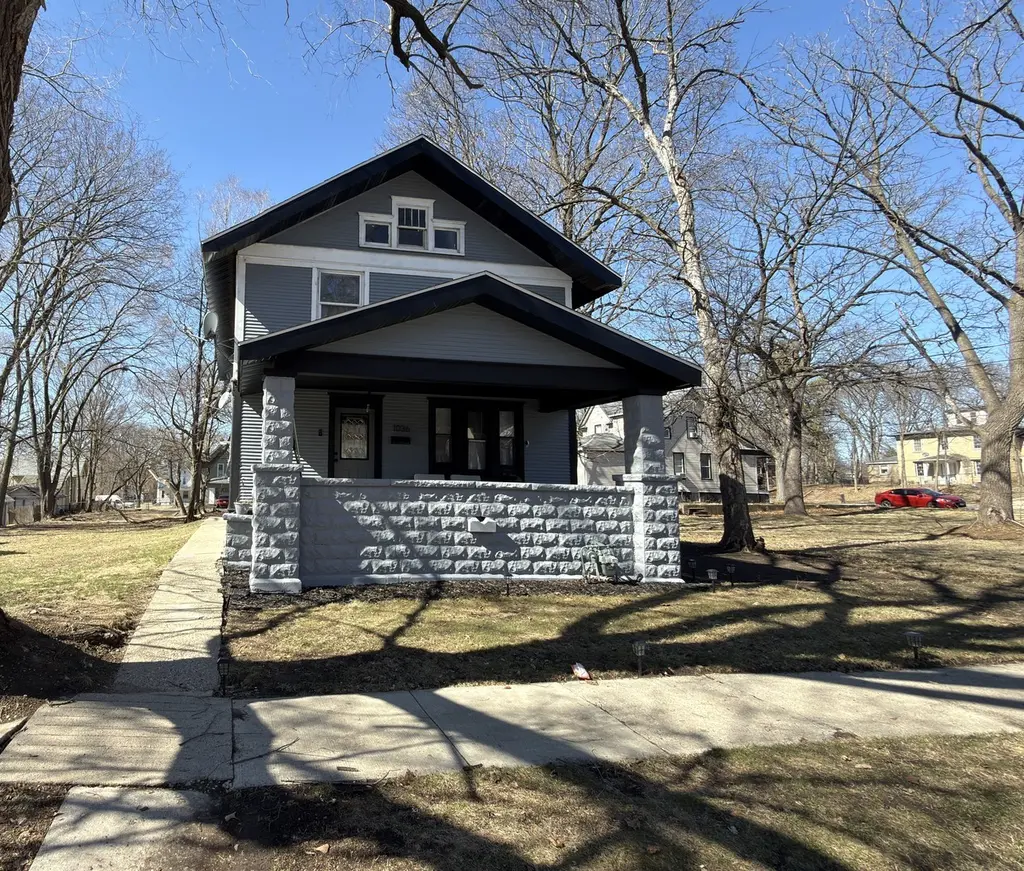
1036 N Winnebago St · Rockford, IL
Flood risk 1/10 · Minimal
- FEMA flood zone
- X (unshaded)
- Chance of flooding over 30 yrs
- 0.0%
- Est. flood insurance / yr
- $473 – $860
Fire risk 1/10 · Minimal
- Est. fire insurance / yr
- $804 – $1,492
Heat risk 2/10 · Minimal
- Hot days now (above 102°F)
- 7 days/yr
- Hot days in 30 yrs
- 15 days/yr
Wind risk 2/10 · Minimal
- Chance of severe wind over 30 yrs
- —
Air-quality risk 2/10 · Minimal
- Unhealthy air days now
- 1 days/yr
- Unhealthy air days in 30 yrs
- 2 days/yr
Risk factors via First Street. Map © Google.
Why this score? — see what drove the C grade
The composite is a weighted blend of 9 inputs, each scored 0–100. Each bar is that input's sub-score; the figure is the points it added to the 100-point composite (weight × sub-score).
- Cash flow +27.6/30.0
- DSCR +9.7/10.0
- 1% rule +6.8/10.0
- Rent growth +4.5/5.0
- Livability +3.1/5.0
- Condition / age +2.5/5.0
- Schools +1.2/10.0
- ARV discount +0.0/15.0
- Appreciation +0.0/10.0
$135,000
🖨 Deal sheet 📄 Offer letter ✓ Due diligence
Listing remarks MLS
Spacious 4 bedroom, 1 bath 2-story home. The large living room has hardwood flooring and wood burning fireplace, separate dining room the kitchen has oak cabinets, vinyl plank flooring and newer laminate countertops. Three of the bedrooms are on the 2nd floor with the 4th bedroom on the main floor (no closet). The primary bedroom has an additional room that would make great office or walk-in closet. Walk-up attic can be finished for more additional space. New roof and metal eaves. Detached 2 car garage. Located minutes from downtown Rockford and the Rock River!
Key facts
- Hardwood flooring
- Oak cabinets
- Walk-up attic
Tags
Neighborhood map
What this means for you Summary
Snapshot
- This is a 4-bed/1.0-bath single-family listed at $135k.
Deal economics
- At list price, monthly cash flow is $405 ($5k/yr) — positive.
- The deal already cash-flows at list — no discount required.
- Meets the 1% rule at list price ($2k rent vs $135k).
- Recommended offer: $123k (9.0% below list) — sets the bar for market timing.
- Cap rate 9.9% vs local median 6.1% in Rockford — top-decile yield for the area; either an underpriced asset or a hidden risk that comps aren't pricing in. Stress-test before assuming the spread holds.
Location & tenants
- Location reads 62/100 on livability (#876 in IL) — a middle-class / working-renter tenant base. Strengths: cost of living A+, housing A+, health & safety A+; Watch: schools F, crime F, amenities F.
- Rockford SD 205 (urban): math 12% / reading 16% proficiency, ranked #533 of 620 in IL (top 86%) — low school quality limits family demand, transient renter base, plan for 1-2y turnover; 73% free/reduced lunch — lower-income household profile, screen leases tightly.
- Market conditions: Rents rising fast (+8.1%/yr); 103 active listings in the ZIP; 9 comparable units currently listed for rent nearby; rentals lingering (median 44d on market — plan ~5-8 weeks vacancy on turnover, expect pricing pressure); 56% of comp listings sitting > 30 days — soft ceiling on asking rent; 285 units permitted in Winnebago County in 2024 (0 in 5+ unit buildings).
- This rent runs 37% of the median local income ($51k/yr) — at the standard rent-burdened threshold; future hikes will face affordability resistance.
Forward outlook
- Local home prices are declining (-3.0%/yr); year-one equity from $933 of loan paydown is wiped out by about $4k of value loss. Plan a longer hold.
- Winnebago County population projected at -20% by 2050 — secular population decline; favor cash flow + early exit over multi-decade hold.
- At projected returns (-3.0% appreciation + 8.0% rent growth), your $38k cash investment doubles in ~7 years — after that, you're playing with house money.
Negotiation context
- It's been on market 101 days — a 9% lower offer ($123k) is reasonable based on typical stale-listing flexibility.
- 4 sale attempts with the ask held roughly flat each time — persistent listings suggest the price (not the market) is what's stuck; bring a comps-based counter.
- Current owner paid $100k; 35% above their basis — modest negotiation headroom, anchor on the comps not their cost.
Risks & watch-outs
- Watch-outs: built in 1915 — expect roof / HVAC / electrical / plumbing capex.
Questions for the listing agent
- It's been on market 101 days. Have you received any prior offers? Is the seller open to a 9% concession, seller financing, or rate buy-down credit?
- Built in 1915 — when were the roof, HVAC, electrical panel, plumbing, and water heater last replaced?
- Why hasn't it sold? Are there any deal-killer items the seller is aware of (foundation, flood, title, zoning, code violations)?
- Is there a deadline driving the sale (1031 exchange, divorce, estate, relocation)? That informs how much negotiation room exists.
- Schools are F-rated, which usually means shorter tenancies and higher turnover. Who's the typical renter profile here, and what's been the actual vacancy rate?
- Crime grade is F in this area — have there been break-ins, vandalism, or insurance claims at this property in the last 3 years? What carrier currently insures it and at what premium?
- What's the average days-on-market for RENTAL listings here right now (not sales)? A rising rental-DOM trend means longer vacancies and softer asking-rent achievability than the comps imply.
- What's the recent tenant-quality profile in this submarket — average credit score on applications, eviction rate, late-payment / NSF rate, and stable-employment percentage? A property-management company in the area should have these aggregated.
- How much new for-sale + rental construction is in the pipeline within 1–3 miles? Heavy new supply typically softens prices + rents 12–24 months out; constrained supply supports both.
Investment metrics
- 1% rule
- 1.18% ✓
- Cap rate
- 9.89%
- Cash-on-cash
- 12.84%
- DSCR
- 1.57
- GRM
- 7.1
CMA / ARV
- ARV (median comp)
- $92,147
- List price
- $135,000
- Delta
- 46.50%
- Verdict
- OVERPRICED
- Comps
- 20 within 1.0 mi
Show comp detail 12 sales within ~0.75 mi
| Address | Dist | Beds/Ba | Sqft | Sold | Price | $/sf | Match |
|---|---|---|---|---|---|---|---|
| 1025 Grant Ave | 0.37mi | 4/1.5 | 1,680 (+2%) | 1mo | $163,000 | $97 | 76 |
| 928 North Ave | 0.23mi | 4/1.0 | 1,482 (-10%) | 1mo | $149,900 | $101 | 73 |
| 928 North Ave | 0.23mi | 4/1.0 | 1,482 (-10%) | 1mo | $149,900 | $101 | 73 |
| 1027 Grant Ave | 0.37mi | 4/2.0 | 1,700 (+4%) | 0mo | $177,000 | $104 | 72 |
| 706 John St | 0.28mi | 4/3.0 | 1,716 (+5%) | 2mo | $230,000 | $134 | 69 |
| 1512 N Rockton Ave N | 0.34mi | 3/1.5 (-1) | 1,549 (-6%) | 3mo | $160,000 | $103 | 66 |
| 1520 Grant Ave | 0.54mi | 3/1.0 (-1) | 1,658 (+1%) | 3mo | $102,000 | $62 | 65 |
| 2315 Lawndale Ave | 0.74mi | 4/1.5 | 1,619 (-1%) | 2mo | $120,000 | $74 | 60 |
| 330 King St | 0.64mi | 5/2.0 (+1) | 1,680 (+2%) | 5mo | $90,000 | $54 | 52 |
| 1614 Grace St | 0.67mi | 3/2.0 (-1) | 1,707 (+4%) | 4mo | $151,000 | $88 | 50 |
| 1428 North Ave | 0.43mi | 3/2.0 (-1) | 1,435 (-12%) | 1mo | $115,000 | $80 | 49 |
| 1619 Grant Ave | 0.61mi | 3/1.5 (-1) | 1,456 (-11%) | 5mo | $158,000 | $109 | 42 |
Match score weights: distance 35% · size 25% · config 20% · recency 20%. Top-matched comps best support the ARV.
Projected returns pro-forma
-3.0% appreciation · 8.0% rent growth · sell at horizon
- IRR
- 7.9%
- Equity multiple
- 1.32×
- Total profit
- $12,274
- Equity at exit
- $20,129
- IRR
- 20.9%
- Equity multiple
- 3.17×
- Total profit
- $82,026
- Equity at exit
- $11,672
Cash invested: $37,800 (down + closing). Projections, not guarantees.
Landlord ↔ Tenant lean methodology
- Overall (STATE)
- 43 Moderately Tenant-Leaning
- State Illinois
- 43 Moderately Tenant-Leaning · D+7
- County
- — inherits STATE
- City
- — inherits STATE
ZIP-level market 61103
- Home prices YoY
- -27.3%
- Rents YoY
- 8.1%
- Active inventory
- 103
- Price-to-rent
- 7.1×
Monthly cashflow live
- Estimated rent
- $1,591 high interval (Pro) →
- Mortgage (P&I)
- −$708
- Tax from tax record
- −$88 /mo · $1,053/yr
- Insurance
- −$56
- HOA
- −$0
- Vacancy / Maint / Mgmt
- −$334
- Net cashflow
- $405
Break-even live
UW: 25.0% down · 7.5% · 30yr · 1.5% tax · 5.0% vac · 8.0% maint · 8.0% mgmt
Financing live
Cash to close
- Down payment
- $33,750
- Closing costs
- $4,050
- Reserves months
- —
- Total cash needed
- —
Loan-product check · same deal, 3 products live
Conventional
25% down · 7.5% · 30yr
- Down + closing
- —
- Monthly P&I
- —
- Monthly cashflow
- —
- DSCR
- —
- Eligible?
- —
Personal DTI + credit; lowest rate.
DSCR
20% down · 8.5% · 30yr
- Down + closing
- —
- Monthly P&I
- —
- Monthly cashflow
- —
- DSCR
- —
- Eligible?
- —
No personal income docs; deal must DSCR.
Hard money
10% down · 12.0% · 12mo
- Down + closing
- —
- Monthly P&I
- —
- Monthly cashflow
- —
- DSCR
- —
- Eligible?
- —
Short-term bridge; refi at stabilization.
Rent comps 9 comps
| Address | Beds | Baths | Sqft | Rent | $/sqft | DOM | Units | Dist |
|---|---|---|---|---|---|---|---|---|
| 728 N Winnebago St Rockford, IL | 4.0 | 1.0 | 1250 | $1,600 | $1.28 | 13d | 1 | 0.33mi |
| 1146 Fairview Ave Rockford, IL | 4.0 | 1.5 | 1344 | $1,250 | $0.93 | 21d | 1 | 0.75mi |
| 303 Forest Ave Rockford, IL | 4.0 | 1.0 | 1568 | $1,800 | $1.15 | 43d | 1 | 0.91mi |
| 418 Orchard Park Rockford, IL | 3.0 | 1.0 | 1232 | $1,500 | $1.22 | 13d | 1 | 1.01mi |
| 1510 School St Unit 1 Rockford, IL | 3.0 | 1.5 | 1400 | $1,200 | $0.86 | 43d | 1 | 1.07mi |
| 2308 Fremont St Rockford, IL | 3.0 | 1.0 | 1320 | $1,600 | $1.21 | 43d | 1 | 1.10mi |
| 210 Irving Ave Rockford, IL | 5.0 | 1.0 | 1202 | $1,850 | $1.54 | 43d | 1 | 1.14mi |
| 207 N Central Ave Rockford, IL | 4.0 | 1.5 | 1296 | $1,500 | $1.16 | 13d | 1 | 1.23mi |
| 3007 Huffman Blvd Rockford, IL | 3.0 | 1.5 | 1296 | $1,450 | $1.12 | 43d | 1 | 1.32mi |
Listing history 25 events
-
2026-06-19days on market $135,000 Active 101 DOM
-
2026-06-18days on market $135,000 Active 100 DOM
-
2026-06-17days on market $135,000 Active 99 DOM
-
2026-06-16days on market $135,000 Active 98 DOM
-
2026-06-15days on market $135,000 Active 97 DOM
-
2026-06-14days on market $135,000 Active 95 DOM
-
2026-06-13days on market $135,000 Active 94 DOM
-
2026-06-10days on market $135,000 Active 92 DOM
-
2026-06-09days on market $135,000 Active 91 DOM
-
2026-06-08days on market $135,000 Active 90 DOM
-
2026-06-07days on market $135,000 Active 89 DOM
-
2026-06-03days on market $135,000 Active 85 DOM
-
2026-06-02days on market $135,000 Active 84 DOM
-
2026-06-01days on market $135,000 Active 83 DOM
-
2026-05-31days on market $135,000 Active 82 DOM
-
2026-05-30days on market $135,000 Active 81 DOM
-
2026-03-10$135,000 Active 567-char remark
Show marketing remark (567 chars)
Spacious 4 bedroom, 1 bath 2-story home. The large living room has hardwood flooring and wood burning fireplace, separate dining room the kitchen has oak cabinets, vinyl plank flooring and newer laminate countertops. Three of the bedrooms are on the 2nd floor with the 4th bedroom on the main floor (no closet). The primary bedroom has an additional room that would make great office or walk-in closet. Walk-up attic can be finished for more additional space. New roof and metal eaves. Detached 2 car garage. Located minutes from downtown Rockford and the Rock River!
-
2025-04-24soldstatus $100,000
-
2025-04-14soldstatus $100,000 Closed
-
2025-04-14soldstatus $100,000 Closed
-
2025-03-26status Pending
-
2025-03-26status Pending
-
2025-03-22$85,000 Active
-
2025-03-22$85,000 Active
ⓘ Source: listings_history table (triggers on properties + properties_extension) + one-shot
backfill from property_details.listing_events for pre-trigger history.
Tax reassessment forecast IL · Partial reset (capped growth)
- Current annual tax
- $1,053 · $88/mo
- Projected year-2 tax
- $2,059 · $172/mo
- Expected delta
- +$1,006/yr (+$84/mo · 95.5%)
ⓘ Screening estimate from a state-policy table — verify with the county assessor before closing.
Climate risk First Street
- Flood 1/10 Low FEMA zone X (unshaded) · 0% chance over 30 yrs
- Wildfire 1/10 Low
- Heat 2/10 Low 7 d/yr ≥102°F today · 15 d/yr by 30 yrs out
- Wind 2/10 Low
- Air quality 2/10 Low 1 unhealthy d/yr today · 2 by 30 yrs out
Nearby sold comps map
Loading sold comps map…
Walkable amenities ~0.75 mi
Loading nearby amenities…
Taxation est. · year 1
- Rental income
- $19,087
- − Mortgage interest
- −$7,562
- − Property taxes
- −$1,053
- − Insurance
- −$675
- − Repairs & maintenance
- −$1,527
- − Management
- −$1,527
- − Depreciation
- −$3,927
- Taxable income
- $2,816
- Est. tax owed @ 24.0%
- −$676
- After-tax cash flow
- $4,180/yr
For passive investors: Depreciation is non-cash, so a rental often shows a tax loss while cash-flowing — sheltering income. Rental losses are passive: they offset passive income freely, and up to $25,000/yr can offset ordinary (W-2) income if you actively participate and your MAGI is under $100k (phasing out to $0 by $150k); unused losses carry forward. On sale, claimed depreciation is recaptured at up to 25%, and gains may owe capital-gains tax (a 1031 exchange can defer both). Figures are a year-1 estimate at your 24.0% rate — not tax advice; consult a CPA.
Schools (NCES district)
- District
- Rockford SD 205
- NCES district ID
- 1734510
- Math proficiency
- 12% ▼ -2.00%
- Reading proficiency
- 16% ▼ -3.00%
- Median HH income
- $42,533
- Composite
- 12.21/100
- National rank
- #9649
- State rank
- #533 of 620 in IL
Livability — Rockford
- Score
- 62/100
- State rank
- #876
- US rank
- #17035
Category grades
Schools grade is shown separately in the Schools card above.
Census & demographics
- Census place
- Rockford, IL
- County
- Winnebago County · 147,297 people
- City population
- 147,297
- Metro
- Rockford, IL
- Population (ZIP)
- 22,869
- Household income
- $51,161
- Rent vs Own
- Severe rent burden
- 1402.0
Population outlook (Winnebago County) Hauer SSP2
- Today (2025)
- 271,080 people
- By 2030
- 260,684 · -3.8%
- By 2040
- 238,405 · -12.1%
- By 2050
- 216,129 · -20.3%
- By 2075
- 172,882 · -36.2%
- By 2100
- 135,336 · -50.1%
Race, ethnicity, and origin ACS 2023
- Neighborhood character
- Diverse neighborhood (Simpson 0.61)
- Race & ethnicity
- White 56% Black 25% Two or more races 13% Hispanic / Latino 12%
- Hispanic origin (detail)
- Mexican 10%
- Common ancestry
- Romanian 3% Portuguese 2% Italian 2%
- Foreign-born
- 7% · Canada
- Languages at home
- 88% English-only · Spanish 9% Russian/Polish/Slavic 1%
Political lean MEDSL · Winnebago
- 2024 margin
- Toss-up / Even · D 49.5% · R 49.0% · Other 1.5%
- 2008→2024 swing
- -12.2pp toward R · 2008: 12.8pp · 2024: 0.6pp
- All cycles
- 2024: D+0.6 2020: D+2.5 2016: R+1.2 2012: D+5.7 2008: D+12.8
Not yet ingested
- Civics
- —
Market trends
- HPI YoY
- ▼ -81.02%
- Current HPI
- 215.8559
- Rent YoY
- ▲ 8.11%
- Metro
- Rockford, IL
- State GDP YoY
- ▲ 1.59%
- F500 in state
- 60
Industry mix (Fortune 500 HQ in IL)
| Industry | F500 HQs | Revenue |
|---|---|---|
| Insurance | 4 | $201B |
|
||
| Consumer Goods | 4 | $87B |
|
||
| Industrial Machinery | 3 | $64B |
|
||
| Healthcare | 2 | $55B |
|
||
| Retail / Pharmacy | 1 | $148B |
|
||
| Agriculture / Food | 1 | $86B |
|
||
Price history
+58.8% since first listed9 events — show timeline
- 2026-03-10 Listed $135,000 NWIAR
- 2026-03-10 Listed $135,000 MRED as Distributed by MLS Grid
- 2025-04-24 Sold (Public Records) $100,000 Public Records
- 2025-04-14 Sold (MLS) $100,000 NWIAR
- 2025-04-14 Sold (MLS) $100,000 MRED as Distributed by MLS Grid
- 2025-03-26 Pending — NWIAR
- 2025-03-26 Pending — MRED as Distributed by MLS Grid
- 2025-03-22 Listed $85,000 NWIAR
- 2025-03-22 Listed $85,000 MRED as Distributed by MLS Grid
Property tax history
+0.1%/yrLatest (2024): $1,053 · +86.5% YoY. Source: county tax records.
Cash-flow waterfall
monthlySold comps — $/sqft
last 12 mo · ≤1 miLoading sold comps…