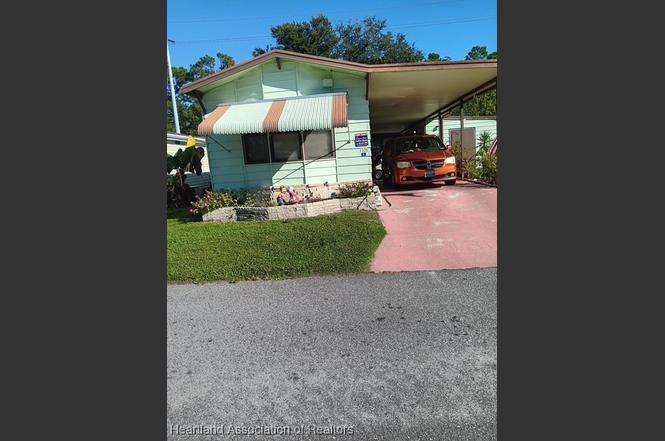
1300 Whisper Lake Blvd · Sebring, FL
Flood risk No data
- FEMA flood zone
- —
- Chance of flooding over 30 yrs
- —
- Est. flood insurance / yr
- —
Fire risk No data
- Est. fire insurance / yr
- —
Heat risk No data
- Hot days now (above threshold)
- —
- Hot days in 30 yrs
- —
Wind risk No data
- Chance of severe wind over 30 yrs
- —
Air-quality risk No data
- Unhealthy air days now
- —
- Unhealthy air days in 30 yrs
- —
Risk factors via First Street. Map © Google.
Why this score? — see what drove the D grade
The composite is a weighted blend of 9 inputs, each scored 0–100. Each bar is that input's sub-score; the figure is the points it added to the 100-point composite (weight × sub-score).
- Cash flow +15.0/30.0
- ARV discount +7.5/15.0
- 1% rule +5.0/10.0
- DSCR +5.0/10.0
- Schools +3.6/10.0
- Livability +3.3/5.0
- Condition / age +2.5/5.0
- Rent growth +2.4/5.0
- Appreciation +0.0/10.0
$29,000
🖨 Deal sheet 📄 Offer letter ✓ Due diligence
Listing remarks
A HONEY FOR THE MONEY !!! Located in Whisper Lake (An amenity filled 55+ community) sits this 2/2 Single wide close to shopping, Hospitals, Doctors, restaurants and more. Once inside you will see new laminate flooring with w/ w carpet in the 2 bedrooms. The eat in kitchen has plenty of cabinets as well as counter space. The Living room is nice and cozy. Laundry is in the house not the shed. NEW AC unit. There is a 295 sq ft Bonus room for a relaxing retreat. Outside you will find a Shed with electric to house your tools and plenty of room to garden and enjoy the peacefulness setting. The Park has plenty to offer such as a Beautiful Clubhouse, Pool, Shuffleboard, Bingo, Bocce Ball and more
Key facts
- Shed with electric
- 295 sq ft bonus room
- Beautiful clubhouse
Tags
Property features AI
Finance
- HOA & community: Senior community; Land is leased (monthly land lease of $522)
Exterior
- Parking: 2 parking spaces total; 1 carport space; Carport; Driveway parking; On-street parking
- Utilities: Public water; Public sewer; Sewer available
- Home design: Manufactured in park (mobile home); Single-wide; One level
- Construction: Frame construction; Metal roof
- Exterior features: Enclosed rear porch; In-ground pool
Interior
- Kitchen: Oven; Range; Dishwasher; Refrigerator; Electric water heater
- Flooring: Carpet; Laminate; Simulated wood; Vinyl
- Bathrooms: 1 full bathroom; 1 half bathroom
- Heating & cooling: Central heating; Electric heating; Heat pump; Central air conditioning; Electric cooling
- Interior features: Unfurnished; 6 total rooms
- Laundry & utility: Washer; Dryer
Neighborhood map
What this means for you Summary
Snapshot
- This is a 2-bed/1.5-bath manufactured listed at $29k.
Deal economics
- At list price, monthly cash flow is $809 ($10k/yr) — positive.
- The deal already cash-flows at list — no discount required.
- Meets the 1% rule at list price ($1k rent vs $29k).
- Recommended offer: $26k (12.0% below list) — sets the bar for market timing.
- Cap rate 39.8% vs local median 4.3% in Sebring — top-decile yield for the area; either an underpriced asset or a hidden risk that comps aren't pricing in. Stress-test before assuming the spread holds.
Location & tenants
- Location reads 66/100 on livability (#618 in FL) — a middle-class / working-renter tenant base. Strengths: cost of living A+, housing A+, health & safety A; Watch: schools D, amenities F, commute F.
- Highlands (other): math 45% / reading 43% proficiency, ranked #54 of 73 in FL (top 74%) — families likely to look elsewhere, expect single-tenant / working-renter base with shorter leases; 68% free/reduced lunch — lower-income household profile, screen leases tightly.
- Market conditions: Rents soft (-0.3%/yr); 475 active listings in the ZIP; 980 units permitted in Highlands County in 2024 (80 in 5+ unit buildings).
- This rent runs 31% of the median local income ($50k/yr) — at the standard rent-burdened threshold; future hikes will face affordability resistance.
Forward outlook
- Local home prices are declining (-3.0%/yr); year-one equity from $200 of loan paydown is wiped out by about $870 of value loss. Plan a longer hold.
- At projected returns (-3.0% appreciation + 0.0% rent growth), your $8k cash investment doubles in ~1 year — after that, you're playing with house money.
Negotiation context
- It's been on market 325 days — a 12% lower offer ($26k) is reasonable based on typical stale-listing flexibility.
- 2 sale attempts; this cycle's ask has dropped $20k (41%) from the opening price — seller is motivated, your offer sets the floor, not the list.
Questions for the listing agent
- It's been on market 325 days. Have you received any prior offers? Is the seller open to a 12% concession, seller financing, or rate buy-down credit?
- Why hasn't it sold? Are there any deal-killer items the seller is aware of (foundation, flood, title, zoning, code violations)?
- Is there a deadline driving the sale (1031 exchange, divorce, estate, relocation)? That informs how much negotiation room exists.
- Schools are D-rated, which usually means shorter tenancies and higher turnover. Who's the typical renter profile here, and what's been the actual vacancy rate?
- The area grade is low — what's the realistic commute time and amenity access for the typical tenant pool here? Any planned neighborhood developments (good or bad) we should know about?
- What's the average days-on-market for RENTAL listings here right now (not sales)? A rising rental-DOM trend means longer vacancies and softer asking-rent achievability than the comps imply.
- What's the recent tenant-quality profile in this submarket — average credit score on applications, eviction rate, late-payment / NSF rate, and stable-employment percentage? A property-management company in the area should have these aggregated.
- How much new for-sale + rental construction is in the pipeline within 1–3 miles? Heavy new supply typically softens prices + rents 12–24 months out; constrained supply supports both.
Investment metrics
- 1% rule
- 4.41% ✓
- Cap rate
- 39.77%
- Cash-on-cash
- 119.58%
- DSCR
- 6.32
- GRM
- 1.9
CMA / ARV
- ARV (on-the-fly)
- $143,000
- Comps found
- 4
Show comp detail 4 sales within ~0.75 mi
| Address | Dist | Beds/Ba | Sqft | Sold | Price | $/sf | Match |
|---|---|---|---|---|---|---|---|
| 2602 Georgia St | 0.69mi | 2/2.0 | 1,056 (+6%) | 14mo | $178,000 | $169 | 45 |
| 3400 Maryland Ave | 0.62mi | 2/2.0 | 960 (-4%) | 22mo | $80,000 | $83 | 44 |
| 1404 Abbey Ln | 0.60mi | 2/2.0 | 1,104 (+10%) | 21mo | $140,000 | $127 | 35 |
| 3304 Indiana Ave | 0.66mi | 2/2.0 | 1,119 (+12%) | 24mo | $160,000 | $143 | 28 |
Match score weights: distance 35% · size 25% · config 20% · recency 20%. Top-matched comps best support the ARV.
Projected returns pro-forma
-3.0% appreciation · 0.0% rent growth · sell at horizon
- IRR
- —
- Equity multiple
- 6.31×
- Total profit
- $43,109
- Equity at exit
- $4,324
- IRR
- —
- Equity multiple
- 12.02×
- Total profit
- $89,503
- Equity at exit
- $2,507
Cash invested: $8,120 (down + closing). Projections, not guarantees.
Landlord ↔ Tenant lean methodology
- Overall (STATE)
- 87 Strongly Landlord-Friendly
- State Florida
- 87 Strongly Landlord-Friendly · R+3
- County
- — inherits STATE
- City
- — inherits STATE
ZIP-level market 33870
- Home prices YoY
- -20.0%
- Rents YoY
- -0.3%
- Active inventory
- 475
- Price-to-rent
- 1.9×
Monthly cashflow live
- Estimated rent
- $1,278 medium interval (Pro) →
- Mortgage (P&I)
- −$152
- Tax est. 1.5%
- −$36 /mo · $435/yr
- Insurance
- −$12
- HOA
- −$0
- Vacancy / Maint / Mgmt
- −$268
- Net cashflow
- $809
Break-even live
UW: 25.0% down · 7.5% · 30yr · 1.5% tax · 5.0% vac · 8.0% maint · 8.0% mgmt
Financing live
Cash to close
- Down payment
- $7,250
- Closing costs
- $870
- Reserves months
- —
- Total cash needed
- —
Loan-product check · same deal, 3 products live
Conventional
25% down · 7.5% · 30yr
- Down + closing
- —
- Monthly P&I
- —
- Monthly cashflow
- —
- DSCR
- —
- Eligible?
- —
Personal DTI + credit; lowest rate.
DSCR
20% down · 8.5% · 30yr
- Down + closing
- —
- Monthly P&I
- —
- Monthly cashflow
- —
- DSCR
- —
- Eligible?
- —
No personal income docs; deal must DSCR.
Hard money
10% down · 12.0% · 12mo
- Down + closing
- —
- Monthly P&I
- —
- Monthly cashflow
- —
- DSCR
- —
- Eligible?
- —
Short-term bridge; refi at stabilization.
Listing history 21 events
-
2026-06-19days on market $29,000 Active 325 DOM
-
2026-06-18days on market $29,000 Active 324 DOM
-
2026-06-17days on market $29,000 Active 323 DOM
-
2026-06-16days on market $29,000 Active 322 DOM
-
2026-06-15days on market $29,000 Active 321 DOM
-
2026-06-14days on market $29,000 Active 319 DOM
-
2026-06-10days on market $29,000 Active 316 DOM
-
2026-06-09days on market $29,000 Active 315 DOM
-
2026-06-08days on market $29,000 Active 314 DOM
-
2026-06-07days on market $29,000 Active 313 DOM
-
2026-06-02days on market $29,000 Active 308 DOM
-
2026-06-01days on market $29,000 Active 307 DOM
-
2026-05-31days on market $29,000 Active 306 DOM
-
2026-05-30days on market $29,000 Active 305 DOM
-
2026-01-23price $29,000
-
2026-01-18price $32,000
-
2026-01-14status Active
-
2025-12-31historical
-
2025-09-30price $35,000
-
2025-07-23price $39,000
-
2025-07-16$49,000 Active
ⓘ Source: listings_history table (triggers on properties + properties_extension) + one-shot
backfill from property_details.listing_events for pre-trigger history.
Nearby sold comps map
Loading sold comps map…
Walkable amenities ~0.75 mi
Loading nearby amenities…
Taxation est. · year 1
- Rental income
- $15,335
- − Mortgage interest
- −$1,624
- − Property taxes
- −$435
- − Insurance
- −$145
- − Repairs & maintenance
- −$1,227
- − Management
- −$1,227
- − Depreciation
- −$844
- Taxable income
- $9,833
- Est. tax owed @ 24.0%
- −$2,360
- After-tax cash flow
- $7,350/yr
For passive investors: Depreciation is non-cash, so a rental often shows a tax loss while cash-flowing — sheltering income. Rental losses are passive: they offset passive income freely, and up to $25,000/yr can offset ordinary (W-2) income if you actively participate and your MAGI is under $100k (phasing out to $0 by $150k); unused losses carry forward. On sale, claimed depreciation is recaptured at up to 25%, and gains may owe capital-gains tax (a 1031 exchange can defer both). Figures are a year-1 estimate at your 24.0% rate — not tax advice; consult a CPA.
Schools (NCES district)
- District
- Highlands
- NCES district ID
- 1200840
- Math proficiency
- 45% ▼ -7.00%
- Reading proficiency
- 43% ▼ -3.00%
- Median HH income
- $35,276
- Composite
- 36.42/100
- National rank
- #4672
- State rank
- #54 of 73 in FL
Livability — Sebring
- Score
- 66/100
- State rank
- #618
- US rank
- #11992
Category grades
Schools grade is shown separately in the Schools card above.
Census & demographics
- County
- Highlands County · 98,898 people
- City population
- 50,797
- Metro
- Sebring-Avon Park, FL
- Population (ZIP)
- 25,195
- Household income
- $49,942
- Rent vs Own
- Severe rent burden
- 994.0
Population outlook (Highlands County) Hauer SSP2
- Today (2025)
- 99,674 people
- By 2030
- 99,615 · -0.1%
- By 2040
- 99,342 · -0.3%
- By 2050
- 98,242 · -1.4%
- By 2075
- 93,291 · -6.4%
- By 2100
- 79,894 · -19.8%
Race, ethnicity, and origin ACS 2023
- Neighborhood character
- Diverse neighborhood (Simpson 0.57)
- Race & ethnicity
- White 60% Hispanic / Latino 22% Black 13% Two or more races 10% Asian 1%
- Hispanic origin (detail)
- Mexican 8% Puerto Rican 7% Cuban 5%
- Common ancestry
- Slovak 2% Romanian 1% Lithuanian 1%
- Foreign-born
- 10% · Canada, Jamaica, China
- Languages at home
- 80% English-only · Spanish 16% Other Indo-European 1% French/Haitian/Cajun 1%
Political lean MEDSL · Highlands
- 2024 margin
- Solid R (+40.8) · D 29.3% · R 70.1%
- 2008→2024 swing
- -22.7pp toward R · 2008: -18.1pp · 2024: -40.8pp
- All cycles
- 2024: R+40.8 2020: R+34.4 2016: R+32.0 2012: R+23.0 2008: R+18.1
Not yet ingested
- Civics
- —
Market trends
- HPI YoY
- ▼ -68.68%
- Current HPI
- 273.9861
- Rent YoY
- ▼ -0.29%
- Metro
- Sebring-Avon Park, FL
- State GDP YoY
- ▲ 3.28%
- F500 in state
- 36
Industry mix (Fortune 500 HQ in FL)
| Industry | F500 HQs | Revenue |
|---|---|---|
| Industrial Technology | 2 | $29B |
|
||
| Insurance | 2 | $17B |
|
||
| Retail | 1 | $60B |
|
||
| Technology Distribution | 1 | $58B |
|
||
| Homebuilding | 1 | $35B |
|
||
| Technology Manufacturing | 1 | $35B |
|
||
Price history
-40.8% since first listed7 events — show timeline
- 2026-01-23 Price Changed $29,000 HAOR as distributed by MLS GRID
- 2026-01-18 Price Changed $32,000 HAOR as distributed by MLS GRID
- 2026-01-14 Relisted — HAOR as distributed by MLS GRID
- 2025-12-31 Delisted — HAOR as distributed by MLS GRID
- 2025-09-30 Price Changed $35,000 HAOR as distributed by MLS GRID
- 2025-07-23 Price Changed $39,000 HAOR as distributed by MLS GRID
- 2025-07-16 Listed $49,000 HAOR as distributed by MLS GRID
Cash-flow waterfall
monthlySold comps — $/sqft
last 12 mo · ≤1 miLoading sold comps…