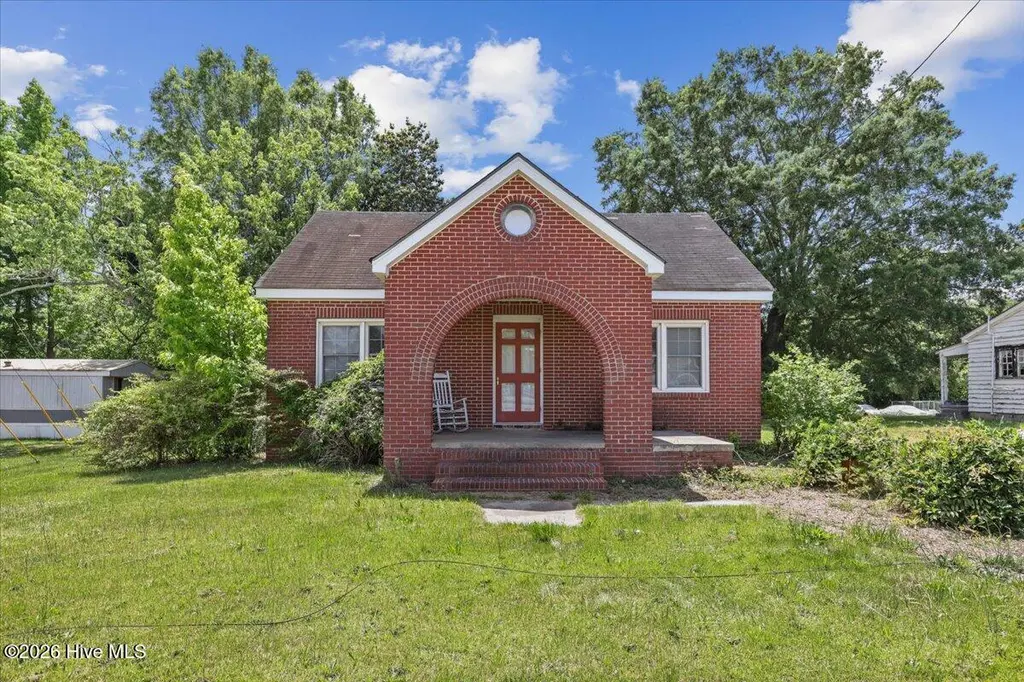
2213 Hunter Hill Rd · Rocky Mount, NC
Flood risk 1/10 · Minimal
- FEMA flood zone
- X (unshaded)
- Chance of flooding over 30 yrs
- 0.0%
- Est. flood insurance / yr
- $507 – $1,088
Fire risk 3/10 · Minor
- Est. fire insurance / yr
- $906 – $1,684
Heat risk 8/10 · Major
- Hot days now (above 109°F)
- 7 days/yr
- Hot days in 30 yrs
- 16 days/yr
Wind risk 7/10 · Major
- Chance of severe wind over 30 yrs
- 78.0%
Air-quality risk 2/10 · Minimal
- Unhealthy air days now
- 0 days/yr
- Unhealthy air days in 30 yrs
- 1 days/yr
Risk factors via First Street. Map © Google.
Why this score? — see what drove the C grade
The composite is a weighted blend of 9 inputs, each scored 0–100. Each bar is that input's sub-score; the figure is the points it added to the 100-point composite (weight × sub-score).
- Cash flow +20.6/30.0
- ARV discount +15.0/15.0
- DSCR +6.5/10.0
- 1% rule +4.2/10.0
- Livability +3.5/5.0
- Rent growth +2.5/5.0
- Condition / age +2.5/5.0
- Schools +2.2/10.0
- Appreciation +0.0/10.0
$169,900
🖨 Deal sheet 📄 Offer letter ✓ Due diligence
Listing remarks MLS
Attention investors and renovators! Here's your chance to add value to a well-located brick ranch in Rocky Mount. This 3-bedroom, 2-bath home features an attached rear carport and a functional floor plan with plenty of potential. The property needs repairs and cosmetic updates, making it an ideal project for a fix-and-flip, rental portfolio addition, or owner-occupant renovation. Seller indicates a previous roof leak has been addressed, though interior repairs are still needed. Sold as-is and priced with condition in mind. Don't miss this value-add opportunity.
Key facts
- Brick ranch
- 0.39 acre lot
- Built 1950
Tags
Property features AI
Finance
- Other: Publicly maintained road
- HOA & community: No association
Exterior
- Parking: Attached carport; Driveway; Unpaved parking
- Utilities: Public water; Electricity connected; Water connected; Sewer: Unknown
- Home design: Site-built property; One and one-half to two levels
- Construction: Brick construction
- Exterior features: Shingle roof; 70 x 229 x 76 x 251 lot dimensions; 0.39-acre lot (approximately 16,988 sq ft)
Interior
- Kitchen: Range; Refrigerator
- Bedrooms: 3 bedrooms (1 on the main level)
- Flooring: Simulated wood; Wood; Other
- Bathrooms: 1 full bathroom; 1 half bathroom
- Heating & cooling: Gas pack and heat pump heating; Central electric air conditioning
- Interior features: Laminate counters; Smooth ceilings; Primary bedroom on main level
Neighborhood map
What this means for you Summary
Snapshot
- This is a 3-bed/2.0-bath single-family listed at $170k.
Deal economics
- At list price, monthly cash flow is $226 ($3k/yr) — positive.
- The deal already cash-flows at list — no discount required.
- To meet the 1% rule (rent ≥ 1% of price), the offer needs to be $157k (7.8% below list).
- Recommended offer: $157k (7.8% below list) — sets the bar for 1% rule.
- Cap rate 7.9% vs local median 4.5% in Rocky Mount — top-decile yield for the area; either an underpriced asset or a hidden risk that comps aren't pricing in. Stress-test before assuming the spread holds.
Location & tenants
- Location reads 70/100 on livability (#134 in NC) — a middle-class / working-renter tenant base. Strengths: cost of living A+, housing A+, health & safety A+; Watch: schools F, crime F, amenities F.
- Nash-Rocky Mount Schools (rural): math 20% / reading 32% proficiency, ranked #155 of 178 in NC (top 87%) — low school quality limits family demand, transient renter base, plan for 1-2y turnover.
- Market conditions: Rents soft (-0.2%/yr); 392 active listings in the ZIP; 500 units permitted in Nash County in 2024 (0 in 5+ unit buildings).
- This rent runs 31% of the median local income ($61k/yr) — at the standard rent-burdened threshold; future hikes will face affordability resistance.
Forward outlook
- Local home prices are declining (-3.0%/yr); year-one equity from $1k of loan paydown is wiped out by about $5k of value loss. Plan a longer hold.
- Nash County population projected at -12% by 2050 — secular population decline; favor cash flow + early exit over multi-decade hold.
Negotiation context
- Only 12 days on market — expect competitive offers; lowballing is unlikely to land.
- 2 sale attempts with the ask held roughly flat each time — persistent listings suggest the price (not the market) is what's stuck; bring a comps-based counter.
- Current owner paid $35k; list at $170k implies a 385% gain — meaningful room to come down on a strong offer.
Risks & watch-outs
- Watch-outs: built in 1950 — expect roof / HVAC / electrical / plumbing capex.
- Climate carrying-cost: major wind risk, 78% chance of damaging wind over 30y; extreme-heat days projected 7→16/yr by 2055 (HVAC capex compounding) — expect insurance premiums to compound above CPI over the hold.
Questions for the listing agent
- Built in 1950 — when were the roof, HVAC, electrical panel, plumbing, and water heater last replaced?
- Is there a deadline driving the sale (1031 exchange, divorce, estate, relocation)? That informs how much negotiation room exists.
- Schools are F-rated, which usually means shorter tenancies and higher turnover. Who's the typical renter profile here, and what's been the actual vacancy rate?
- Crime grade is F in this area — have there been break-ins, vandalism, or insurance claims at this property in the last 3 years? What carrier currently insures it and at what premium?
- What's the average days-on-market for RENTAL listings here right now (not sales)? A rising rental-DOM trend means longer vacancies and softer asking-rent achievability than the comps imply.
- What's the recent tenant-quality profile in this submarket — average credit score on applications, eviction rate, late-payment / NSF rate, and stable-employment percentage? A property-management company in the area should have these aggregated.
- How much new for-sale + rental construction is in the pipeline within 1–3 miles? Heavy new supply typically softens prices + rents 12–24 months out; constrained supply supports both.
Investment metrics
- 1% rule
- 0.92% ✗
- Cap rate
- 7.89%
- Cash-on-cash
- 5.69%
- DSCR
- 1.25
- GRM
- 9.0
CMA / ARV
- ARV (on-the-fly)
- $216,978
- Comps found
- 4
Show comp detail 4 sales within ~0.75 mi
| Address | Dist | Beds/Ba | Sqft | Sold | Price | $/sf | Match |
|---|---|---|---|---|---|---|---|
| 1917 Sapphire Rd | 0.74mi | 3/1.0 | 1,235 (-1%) | 15mo | $215,000 | $174 | 48 |
| 1100 Brandywine Ln | 0.63mi | 3/2.0 | 1,350 (+8%) | 11mo | $212,500 | $157 | 47 |
| 48 Wildberry Dr | 0.50mi | 3/2.0 | 1,403 (+12%) | 17mo | $298,500 | $213 | 42 |
| 1717 Hunter Hill Rd | 0.68mi | 2/1.0 (-1) | 1,161 (-7%) | 21mo | $129,900 | $112 | 30 |
Match score weights: distance 35% · size 25% · config 20% · recency 20%. Top-matched comps best support the ARV.
Projected returns pro-forma
-3.0% appreciation · 0.0% rent growth · sell at horizon
- IRR
- -10.6%
- Equity multiple
- 0.63×
- Total profit
- $-17,833
- Equity at exit
- $25,333
- IRR
- -5.6%
- Equity multiple
- 0.68×
- Total profit
- $-15,078
- Equity at exit
- $14,690
Cash invested: $47,572 (down + closing). Projections, not guarantees.
Landlord ↔ Tenant lean methodology
- Overall (STATE)
- 85 Strongly Landlord-Friendly
- State North Carolina
- 85 Strongly Landlord-Friendly · R+3
- County
- — inherits STATE
- City
- — inherits STATE
ZIP-level market 27804
- Rents YoY
- -0.2%
- Active inventory
- 392
- Price-to-rent
- 9.0×
Monthly cashflow live
- Estimated rent
- $1,566 medium interval (Pro) →
- Mortgage (P&I)
- −$891
- Tax from tax record
- −$50 /mo · $597/yr
- Insurance
- −$71
- HOA
- −$0
- Vacancy / Maint / Mgmt
- −$329
- Net cashflow
- $226
Break-even live
UW: 25.0% down · 7.5% · 30yr · 1.5% tax · 5.0% vac · 8.0% maint · 8.0% mgmt
Financing live
Cash to close
- Down payment
- $42,475
- Closing costs
- $5,097
- Reserves months
- —
- Total cash needed
- —
Loan-product check · same deal, 3 products live
Conventional
25% down · 7.5% · 30yr
- Down + closing
- —
- Monthly P&I
- —
- Monthly cashflow
- —
- DSCR
- —
- Eligible?
- —
Personal DTI + credit; lowest rate.
DSCR
20% down · 8.5% · 30yr
- Down + closing
- —
- Monthly P&I
- —
- Monthly cashflow
- —
- DSCR
- —
- Eligible?
- —
No personal income docs; deal must DSCR.
Hard money
10% down · 12.0% · 12mo
- Down + closing
- —
- Monthly P&I
- —
- Monthly cashflow
- —
- DSCR
- —
- Eligible?
- —
Short-term bridge; refi at stabilization.
Listing history 11 events
-
2026-06-19days on market $169,900 Active 12 DOM
-
2026-06-18days on market $169,900 Active 11 DOM
-
2026-06-17days on market $169,900 Active 10 DOM
-
2026-06-16days on market $169,900 Active 9 DOM
-
2026-06-15days on market $169,900 Active 8 DOM
-
2026-06-14days on market $169,900 Active 6 DOM
-
2026-06-13days on market $169,900 Active 5 DOM
-
2026-06-10days on market $169,900 Active 3 DOM
-
2026-06-09days on market $169,900 Active 2 DOM
-
2026-06-07remarks 567-char remark
Show marketing remark (567 chars)
Attention investors and renovators! Here's your chance to add value to a well-located brick ranch in Rocky Mount. This 3-bedroom, 2-bath home features an attached rear carport and a functional floor plan with plenty of potential. The property needs repairs and cosmetic updates, making it an ideal project for a fix-and-flip, rental portfolio addition, or owner-occupant renovation. Seller indicates a previous roof leak has been addressed, though interior repairs are still needed. Sold as-is and priced with condition in mind. Don't miss this value-add opportunity.
-
2026-06-07$169,900 Active 1 DOM
Show marketing remark (567 chars)
Attention investors and renovators! Here's your chance to add value to a well-located brick ranch in Rocky Mount. This 3-bedroom, 2-bath home features an attached rear carport and a functional floor plan with plenty of potential. The property needs repairs and cosmetic updates, making it an ideal project for a fix-and-flip, rental portfolio addition, or owner-occupant renovation. Seller indicates a previous roof leak has been addressed, though interior repairs are still needed. Sold as-is and priced with condition in mind. Don't miss this value-add opportunity.
ⓘ Source: listings_history table (triggers on properties + properties_extension) + one-shot
backfill from property_details.listing_events for pre-trigger history.
Tax reassessment forecast NC · Resets to sale price
- Current annual tax
- $597 · $50/mo
- Projected year-2 tax
- $1,393 · $116/mo
- Expected delta
- +$796/yr (+$66/mo · 133.3%)
ⓘ Screening estimate from a state-policy table — verify with the county assessor before closing.
Climate risk First Street
- Flood 1/10 Low FEMA zone X (unshaded) · 0% chance over 30 yrs
- Wildfire 3/10 Moderate
- Heat 8/10 Severe 7 d/yr ≥109°F today · 16 d/yr by 30 yrs out
- Wind 7/10 Severe 78% chance of damaging wind over 30 yrs
- Air quality 2/10 Low 0 unhealthy d/yr today · 1 by 30 yrs out
Nearby sold comps map
Loading sold comps map…
Walkable amenities ~0.75 mi
Loading nearby amenities…
Taxation est. · year 1
- Rental income
- $18,791
- − Mortgage interest
- −$9,517
- − Property taxes
- −$597
- − Insurance
- −$850
- − Repairs & maintenance
- −$1,503
- − Management
- −$1,503
- − Depreciation
- −$4,943
- Taxable loss
- −$122
- Est. tax savings @ 24.0%
- +$29
- After-tax cash flow
- $2,736/yr
For passive investors: Depreciation is non-cash, so a rental often shows a tax loss while cash-flowing — sheltering income. Rental losses are passive: they offset passive income freely, and up to $25,000/yr can offset ordinary (W-2) income if you actively participate and your MAGI is under $100k (phasing out to $0 by $150k); unused losses carry forward. On sale, claimed depreciation is recaptured at up to 25%, and gains may owe capital-gains tax (a 1031 exchange can defer both). Figures are a year-1 estimate at your 24.0% rate — not tax advice; consult a CPA.
Schools (NCES district)
- District
- Nash-Rocky Mount Schools
- NCES district ID
- 3703270
- Math proficiency
- 20% ▼ -3.00%
- Reading proficiency
- 32% ▲ 1.00%
- Median HH income
- $41,553
- Composite
- 22.04/100
- National rank
- #8198
- State rank
- #155 of 178 in NC
Livability — Rocky Mount
- Score
- 70/100
- State rank
- #134
- US rank
- #7692
Category grades
Schools grade is shown separately in the Schools card above.
Census & demographics
- Census place
- Rocky Mount, NC
- County
- Nash County · 50,768 people
- City population
- 70,300
- Metro
- Rocky Mount, NC
- Population (ZIP)
- 30,713
- Household income
- $61,359
- Rent vs Own
- Severe rent burden
- 710.0
Population outlook (Nash County) Hauer SSP2
- Today (2025)
- 91,107 people
- By 2030
- 89,193 · -2.1%
- By 2040
- 84,959 · -6.7%
- By 2050
- 80,517 · -11.6%
- By 2075
- 72,941 · -19.9%
- By 2100
- 63,602 · -30.2%
Race, ethnicity, and origin ACS 2023
- Neighborhood character
- Diverse neighborhood (Simpson 0.59)
- Race & ethnicity
- Black 52% White 38% Hispanic / Latino 6% Two or more races 3% Asian 1%
- Hispanic origin (detail)
- Mexican 2%
- Common ancestry
- Lithuanian 1% Italian 1% Slovak 1%
- Foreign-born
- 4% · Canada
- Languages at home
- 94% English-only · Spanish 5% Other Indo-European 1%
Political lean MEDSL · Nash
- 2024 margin
- Toss-up / Even · D 48.7% · R 50.5%
- 2008→2024 swing
- -0.4pp no change · 2008: -1.3pp · 2024: -1.8pp
- All cycles
- 2024: R+1.8 2020: D+0.2 2016: R+0.2 2012: D+0.9 2008: R+1.3
Not yet ingested
- Civics
- —
Market trends
- HPI YoY
- ▼ -142.83%
- Current HPI
- 183.0082
- Rent YoY
- ▼ -0.17%
- Metro
- Rocky Mount, NC
- State GDP YoY
- ▲ 3.28%
- F500 in state
- 26
Industry mix (Fortune 500 HQ in NC)
| Industry | F500 HQs | Revenue |
|---|---|---|
| Financial Services | 2 | $213B |
|
||
| Retail | 2 | $95B |
|
||
| Industrial Conglomerate | 1 | $38B |
|
||
| Metals / Steel | 1 | $35B |
|
||
| Utilities | 1 | $30B |
|
||
| Industrial Machinery | 1 | $19B |
|
||
Price history
+385.4% since first listed3 events — show timeline
- 2026-06-07 Listed $169,900 Hive MLS
- 2026-06-06 Listed $169,900 TMLS
- 2007-05-25 Sold (Public Records) $35,000 Public Records
Property tax history
+4.6%/yrLatest (2025): $597 · +0.0% YoY. Source: county tax records.
Cash-flow waterfall
monthlySold comps — $/sqft
last 12 mo · ≤1 miLoading sold comps…