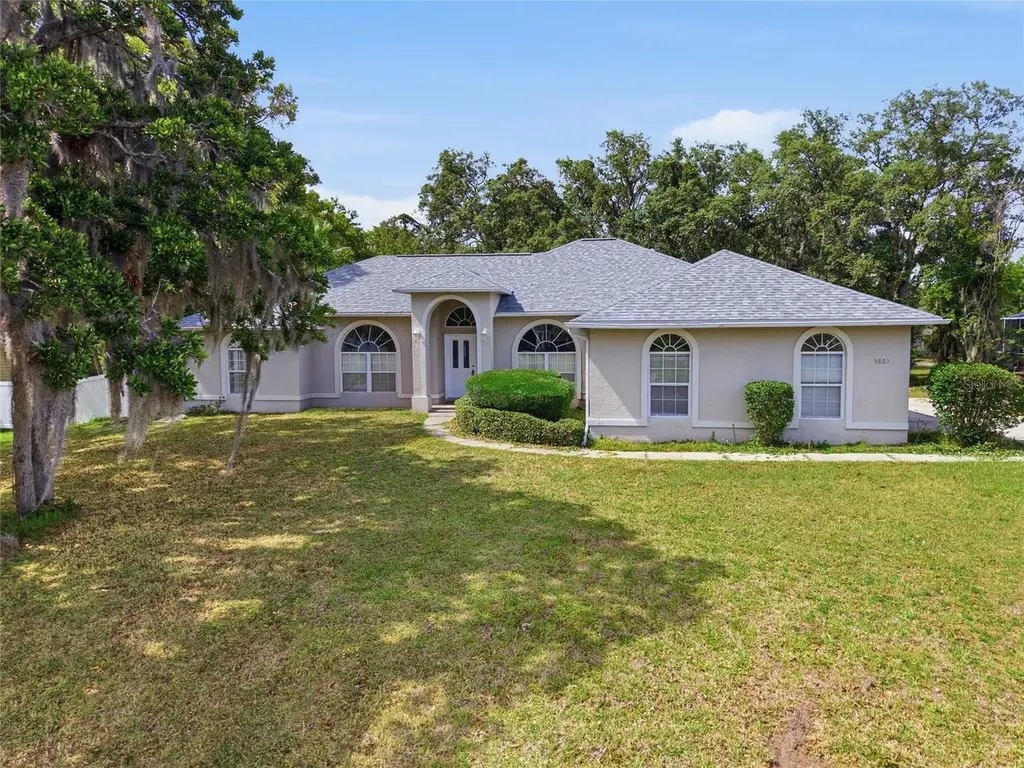
5801 SW 115th Street Rd · Liberty Triangle, FL
Flood risk 1/10 · Minimal
- FEMA flood zone
- X (unshaded)
- Chance of flooding over 30 yrs
- 0.0%
- Est. flood insurance / yr
- $507 – $1,088
Fire risk 4/10 · Minor
- Est. fire insurance / yr
- $947 – $1,759
Heat risk 8/10 · Major
- Hot days now (above 108°F)
- 7 days/yr
- Hot days in 30 yrs
- 21 days/yr
Wind risk 9/10 · Severe
- Chance of severe wind over 30 yrs
- 99.0%
Air-quality risk 2/10 · Minimal
- Unhealthy air days now
- 2 days/yr
- Unhealthy air days in 30 yrs
- 2 days/yr
Risk factors via First Street. Map © Google.
Why this score? — see what drove the C grade
The composite is a weighted blend of 9 inputs, each scored 0–100. Each bar is that input's sub-score; the figure is the points it added to the 100-point composite (weight × sub-score).
- Cash flow +18.3/30.0
- ARV discount +15.0/15.0
- 1% rule +5.7/10.0
- DSCR +5.7/10.0
- Schools +3.6/10.0
- Livability +2.5/5.0
- Condition / age +2.5/5.0
- Rent growth +1.9/5.0
- Appreciation +0.0/10.0
$210,000
🖨 Deal sheet 📄 Offer letter ✓ Due diligence
Listing remarks
Highest and Best Offers due Sunday; May 17, 2026 at 5:00pm. Opportunity awaits in Kingsland Country Estates! This 3-bedroom, 2-bath concrete block home offers 1,966 heated sq ft, 2,725 total sq ft, and sits on a spacious 0.55-acre lot with a side-entry 2-car garage featuring extra width for added convenience. Major exterior improvements already completed with a new roof in 2025, and heat pump system (RUUD 3.5-ton 14 SEER) installed in 2015/2016. This property is ideal for a buyer looking to renovate, customize, and create something special in a desirable SW Ocala location. Cash purchase or renovation loan only. Ceilings need to be scraped and repaired. Visible mold in Living Room and Offi
Key facts
- 0.55 acre lot
- 2 garage spots
- Built 2000
Property features AI
Finance
- Other: Property zoned R1; Approximately 0.55 acre lot (lot dimensions 108x221); Living area reported as 1,966 (public records); Building area total reported as 2,725 (public records)
- HOA & community: Kingsland Country POA with required annual fee of $65 (about $5.42/month); Dogs allowed
Exterior
- Parking: Attached oversized garage (2 spaces) with 21x23 dimensions; Driveway; Garage door opener; Garage faces side
- Utilities: Well water; Septic tank; Electricity connected
- Home design: Single family residence; One-story; South-facing
- Construction: Block, concrete, and stucco construction; Shingle roof; Slab foundation; Built by Marco Polo Builders, Inc
- Exterior features: Screened patio/porch; Mature landscaping; Paved road access; Irrigation equipment
Interior
- Kitchen: Dishwasher; Microwave; Range; Refrigerator
- Bedrooms: 3 bedrooms
- Flooring: Laminate; Tile
- Bathrooms: 2 full bathrooms
- Heating & cooling: Electric heating; Heat pump; Central air conditioning
- Interior features: Ceiling fans; Split bedroom layout; Thermostat; Vaulted ceilings; Walk-in closets
- Laundry & utility: Inside laundry room
Neighborhood map
What this means for you Summary
Snapshot
- This is a 3-bed/2.0-bath single-family listed at $210k.
Deal economics
- At list price, monthly cash flow is $192 ($2k/yr) — positive.
- The deal already cash-flows at list — no discount required.
- Meets the 1% rule at list price ($2k rent vs $210k).
- Cap rate 7.4% vs local median 4.5% in Liberty Triangle — top-decile yield for the area; either an underpriced asset or a hidden risk that comps aren't pricing in. Stress-test before assuming the spread holds.
Location & tenants
- Location reads: area grade C — affects rentability + tenant quality, not the cash-flow math above.
- Marion (rural): math 42% / reading 43% proficiency, ranked #61 of 73 in FL (top 84%) — families likely to look elsewhere, expect single-tenant / working-renter base with shorter leases; 61% free/reduced lunch — lower-income household profile, screen leases tightly.
- Zoned schools: Hammett Bowen Jr. Elementary School (math 56% / reading 56%, grade C+, #832 of 2,144 statewide, top 40%, 867 students, 54% FRL); West Port High School (math 34% / reading 52%, grade F, #255 of 667 statewide, top 39%, 2,906 students, 52% FRL).
- Market conditions: Rents soft (-2.6%/yr); 852 active listings in the ZIP; 5 comparable units currently listed for rent nearby; rentals at typical pace (median 21d on market — plan ~3-4 weeks tenant-placement turnaround); 7,071 units permitted in Marion County in 2024 (534 in 5+ unit buildings).
- This rent runs 41% of the median local income ($66k/yr) — at the standard rent-burdened threshold; future hikes will face affordability resistance.
Forward outlook
- Local home prices are declining (-3.0%/yr); year-one equity from $1k of loan paydown is wiped out by about $6k of value loss. Plan a longer hold.
- Marion County population projected at +13% by 2050 — modest demand growth; plan on rents tracking national, not racing it.
Negotiation context
- Only 5 days on market — expect competitive offers; lowballing is unlikely to land.
- 3 sale attempts since 19y ago with the ask held roughly flat each time — persistent listings suggest the price (not the market) is what's stuck; bring a comps-based counter.
Risks & watch-outs
- Climate carrying-cost: severe wind risk, 99% chance of damaging wind over 30y; extreme-heat days projected 7→21/yr by 2055 (HVAC capex compounding) — expect insurance premiums to compound above CPI over the hold.
Questions for the listing agent
- What does the HOA fee cover, when was the last increase, and are there any pending special assessments or reserve-fund shortfalls?
- Is there a deadline driving the sale (1031 exchange, divorce, estate, relocation)? That informs how much negotiation room exists.
- What's the average days-on-market for RENTAL listings here right now (not sales)? A rising rental-DOM trend means longer vacancies and softer asking-rent achievability than the comps imply.
- What's the recent tenant-quality profile in this submarket — average credit score on applications, eviction rate, late-payment / NSF rate, and stable-employment percentage? A property-management company in the area should have these aggregated.
- How much new for-sale + rental construction is in the pipeline within 1–3 miles? Heavy new supply typically softens prices + rents 12–24 months out; constrained supply supports both.
Investment metrics
- 1% rule
- 1.07% ✓
- Cap rate
- 7.39%
- Cash-on-cash
- 3.92%
- DSCR
- 1.17
- GRM
- 7.8
CMA / ARV
- ARV (median comp)
- $330,304
- List price
- $210,000
- Delta
- -36.42%
- Verdict
- UNDERPRICED
- Comps
- 20 within 1.0 mi
Show comp detail 12 sales within ~0.75 mi
| Address | Dist | Beds/Ba | Sqft | Sold | Price | $/sf | Match |
|---|---|---|---|---|---|---|---|
| 5801 SW 115th Street Rd | 0.00mi | 3/2.0 | 1,966 (0%) | 0mo | $210,000 | $107 | 100 |
| 5810 SW 115th Street Rd | 0.10mi | 4/2.0 (+1) | 2,043 (+4%) | 1mo | $349,900 | $171 | 83 |
| 5808 SW 115th Street Rd | 0.08mi | 3/2.0 | 2,181 (+11%) | 2mo | $355,000 | $163 | 77 |
| 5952 SW 116th St | 0.24mi | 4/2.0 (+1) | 1,873 (-5%) | 8mo | $399,000 | $213 | 70 |
| 5908 SW 111th Place Rd | 0.25mi | 4/2.0 (+1) | 2,043 (+4%) | 11mo | $342,000 | $167 | 67 |
| 5336 SW 109th Place Rd | 0.58mi | 3/2.0 | 1,855 (-6%) | 3mo | $259,000 | $140 | 61 |
| 5550 SW 107 St | 0.63mi | 4/2.0 (+1) | 1,873 (-5%) | 1mo | $369,900 | $197 | 57 |
| 10800 SW 55th Ave | 0.61mi | 3/2.0 | 2,061 (+5%) | 10mo | $360,000 | $175 | 55 |
| 11116 SW 53rd Cir | 0.74mi | 3/2.0 | 2,077 (+6%) | 8mo | $329,900 | $159 | 50 |
| 11267 SW 51 Ave | 0.70mi | 3/2.0 | 2,150 (+9%) | 3mo | $358,000 | $167 | 49 |
| 11730 SW 72nd Cir | 0.68mi | 3/2.0 | 2,020 (+3%) | 19mo | $354,500 | $175 | 48 |
| 11635 SW 65th Avenue Rd | 0.58mi | 4/2.0 (+1) | 1,722 (-12%) | 1mo | $367,000 | $213 | 46 |
Match score weights: distance 35% · size 25% · config 20% · recency 20%. Top-matched comps best support the ARV.
Projected returns pro-forma
-3.0% appreciation · 0.0% rent growth · sell at horizon
- IRR
- -13.8%
- Equity multiple
- 0.52×
- Total profit
- $-28,226
- Equity at exit
- $31,312
- IRR
- -11.1%
- Equity multiple
- 0.43×
- Total profit
- $-33,692
- Equity at exit
- $18,157
Cash invested: $58,800 (down + closing). Projections, not guarantees.
Landlord ↔ Tenant lean methodology
- Overall (STATE)
- 87 Strongly Landlord-Friendly
- State Florida
- 87 Strongly Landlord-Friendly · R+3
- County
- — inherits STATE
- City
- — inherits STATE
ZIP-level market 34476
- Rents YoY
- -2.6%
- Active inventory
- 852
- Price-to-rent
- 7.8×
Monthly cashflow live
- Estimated rent
- $2,237 high interval (Pro) →
- Mortgage (P&I)
- −$1,101
- Tax from tax record
- −$381 /mo · $4,570/yr
- Insurance
- −$88
- HOA
- −$5
- Vacancy / Maint / Mgmt
- −$470
- Net cashflow
- $192
Break-even live
UW: 25.0% down · 7.5% · 30yr · 1.5% tax · 5.0% vac · 8.0% maint · 8.0% mgmt
Financing live
Cash to close
- Down payment
- $52,500
- Closing costs
- $6,300
- Reserves months
- —
- Total cash needed
- —
Loan-product check · same deal, 3 products live
Conventional
25% down · 7.5% · 30yr
- Down + closing
- —
- Monthly P&I
- —
- Monthly cashflow
- —
- DSCR
- —
- Eligible?
- —
Personal DTI + credit; lowest rate.
DSCR
20% down · 8.5% · 30yr
- Down + closing
- —
- Monthly P&I
- —
- Monthly cashflow
- —
- DSCR
- —
- Eligible?
- —
No personal income docs; deal must DSCR.
Hard money
10% down · 12.0% · 12mo
- Down + closing
- —
- Monthly P&I
- —
- Monthly cashflow
- —
- DSCR
- —
- Eligible?
- —
Short-term bridge; refi at stabilization.
Rent comps 5 comps
| Address | Beds | Baths | Sqft | Rent | $/sqft | DOM | Units | Dist |
|---|---|---|---|---|---|---|---|---|
| 11302 SW 62nd Cir Ocala, FL | 3.0 | 2.0 | 1526 | $2,095 | $1.37 | 21d | 1 | 0.47mi |
| 6367 SW 117th Street Rd Ocala, FL | 3.0 | 2.0 | 1602 | $2,650 | $1.65 | 21d | 1 | 0.57mi |
| 10417 SW 52nd Ct Ocala, FL | 3.0 | 2.0 | 1577 | $1,995 | $1.27 | 13d | 1 | 1.10mi |
| 15062 SW 63rd Ct Ocala, FL | 4.0 | 2.5 | 1560 | $1,850 | $1.19 | 21d | 1 | 1.47mi |
| 6035 SW 98th Street Rd Ocala, FL | 2.0 | 2.0 | 1494 | $1,650 | $1.10 | 13d | 1 | 1.49mi |
HOA detail
- Monthly dues
- $5 · $60/yr
Listing history 6 events
-
2026-05-18status Pending 1120-char remark
-
2026-05-14status Active 1120-char remark
-
2026-05-09status Pending 1120-char remark
-
2026-05-07$210,000 Active 1120-char remark
-
2009-02-16historical
-
2007-08-06$169,000
ⓘ Source: listings_history table (triggers on properties + properties_extension) + one-shot
backfill from property_details.listing_events for pre-trigger history.
Tax reassessment forecast FL · Resets to sale price
- Current annual tax
- $4,570 · $381/mo
- Projected year-2 tax
- $4,570 · $381/mo
- Expected delta
- $0/yr ($0/mo · 0.0%)
ⓘ Screening estimate from a state-policy table — verify with the county assessor before closing.
Climate risk First Street
- Flood 1/10 Low FEMA zone X (unshaded) · 0% chance over 30 yrs
- Wildfire 4/10 Moderate
- Heat 8/10 Severe 7 d/yr ≥108°F today · 21 d/yr by 30 yrs out
- Wind 9/10 Extreme 99% chance of damaging wind over 30 yrs
- Air quality 2/10 Low 2 unhealthy d/yr today · 2 by 30 yrs out
Nearby sold comps map
Loading sold comps map…
Walkable amenities ~0.75 mi
Loading nearby amenities…
Taxation est. · year 1
- Rental income
- $26,839
- − Mortgage interest
- −$11,763
- − Property taxes
- −$4,570
- − Insurance
- −$1,050
- − Repairs & maintenance
- −$2,147
- − Management
- −$2,147
- − HOA
- −$60
- − Depreciation
- −$6,109
- Taxable loss
- −$1,007
- Est. tax savings @ 24.0%
- +$242
- After-tax cash flow
- $2,550/yr
For passive investors: Depreciation is non-cash, so a rental often shows a tax loss while cash-flowing — sheltering income. Rental losses are passive: they offset passive income freely, and up to $25,000/yr can offset ordinary (W-2) income if you actively participate and your MAGI is under $100k (phasing out to $0 by $150k); unused losses carry forward. On sale, claimed depreciation is recaptured at up to 25%, and gains may owe capital-gains tax (a 1031 exchange can defer both). Figures are a year-1 estimate at your 24.0% rate — not tax advice; consult a CPA.
Schools (NCES district)
- District
- Marion
- NCES district ID
- 1201260
- Math proficiency
- 42% ▼ -7.00%
- Reading proficiency
- 43% ▼ -4.00%
- Median HH income
- $40,015
- Composite
- 35.61/100
- National rank
- #4890
- State rank
- #61 of 73 in FL
Livability — Liberty Triangle
No livability data for this city. (Only ~50 U.S. cities are tracked.)
Census & demographics
- Census place
- Liberty Triangle, FL
- County
- Marion County · 315,796 people
- City population
- 26,397
- Metro
- Ocala, FL
- Population (ZIP)
- 28,997
- Household income
- $65,860
- Rent vs Own
- Severe rent burden
- 204.0
Population outlook (Marion County) Hauer SSP2
- Today (2025)
- 365,905 people
- By 2030
- 376,768 · +3.0%
- By 2040
- 396,555 · +8.4%
- By 2050
- 412,723 · +12.8%
- By 2075
- 446,090 · +21.9%
- By 2100
- 436,193 · +19.2%
Race, ethnicity, and origin ACS 2023
- Neighborhood character
- Diverse neighborhood (Simpson 0.55)
- Race & ethnicity
- White 63% Hispanic / Latino 18% Black 13% Two or more races 10% Asian 1%
- Hispanic origin (detail)
- Mexican 3% Puerto Rican 8% Cuban 3%
- Common ancestry
- Romanian 3% Slovak 3% Lithuanian 3%
- Foreign-born
- 15% · Canada, Jamaica, Dominican Republic
- Languages at home
- 83% English-only · Spanish 14% Other Indo-European 1% German/W. Germanic 1%
Political lean MEDSL · Marion
- 2024 margin
- Solid R (+31.6) · D 33.8% · R 65.5%
- 2008→2024 swing
- -20.0pp toward R · 2008: -11.6pp · 2024: -31.6pp
- All cycles
- 2024: R+31.6 2020: R+25.9 2016: R+26.2 2012: R+16.2 2008: R+11.6
Not yet ingested
- Civics
- —
Market trends
- HPI YoY
- ▼ -105.22%
- Current HPI
- 189.0869
- Rent YoY
- ▼ -2.57%
- Metro
- Ocala, FL
- State GDP YoY
- ▲ 3.28%
- F500 in state
- 36
Industry mix (Fortune 500 HQ in FL)
| Industry | F500 HQs | Revenue |
|---|---|---|
| Industrial Technology | 2 | $29B |
|
||
| Insurance | 2 | $17B |
|
||
| Retail | 1 | $60B |
|
||
| Technology Distribution | 1 | $58B |
|
||
| Homebuilding | 1 | $35B |
|
||
| Technology Manufacturing | 1 | $35B |
|
||
Price history
+24.3% since first listed7 events — show timeline
- 2026-06-05 Sold (MLS) $210,000 Stellar MLS as Distributed by MLS Grid
- 2026-05-18 Pending — Stellar MLS as Distributed by MLS Grid
- 2026-05-14 Relisted — Stellar MLS as Distributed by MLS Grid
- 2026-05-09 Pending — Stellar MLS as Distributed by MLS Grid
- 2026-05-07 Listed $210,000 Stellar MLS as Distributed by MLS Grid
- 2009-02-16 Listing Removed — Stellar MLS as Distributed by MLS Grid
- 2007-08-06 Listed $169,000 Stellar MLS as Distributed by MLS Grid
Property tax history
+8.2%/yrLatest (2025): $4,570 · +8.9% YoY. Source: county tax records.
Cash-flow waterfall
monthlySold comps — $/sqft
last 12 mo · ≤1 miLoading sold comps…