77687 Highway 216 · Pine Grove, OR
Flood risk 9/10 · Severe
- FEMA flood zone
- A
- Chance of flooding over 30 yrs
- 0.99%
- Est. flood insurance / yr
- $1,009 – $1,996
Fire risk 8/10 · Major
- Est. fire insurance / yr
- $498 – $926
Heat risk 3/10 · Minor
- Hot days now (above 93°F)
- 6 days/yr
- Hot days in 30 yrs
- 12 days/yr
Wind risk 1/10 · Minimal
- Chance of severe wind over 30 yrs
- —
Air-quality risk 10/10 · Severe
- Unhealthy air days now
- 18 days/yr
- Unhealthy air days in 30 yrs
- 20 days/yr
Risk factors via First Street. Map © Google.
Why this score? — see what drove the D grade
The composite is a weighted blend of 9 inputs, each scored 0–100. Each bar is that input's sub-score; the figure is the points it added to the 100-point composite (weight × sub-score).
- Appreciation +10.0/10.0
- Cash flow +9.5/30.0
- ARV discount +7.5/15.0
- Schools +3.2/10.0
- DSCR +2.7/10.0
- Livability +2.7/5.0
- Rent growth +2.5/5.0
- Condition / age +2.5/5.0
- 1% rule +1.7/10.0
$310,000
🖨 Deal sheet 📄 Offer letter ✓ Due diligence
Listing remarks
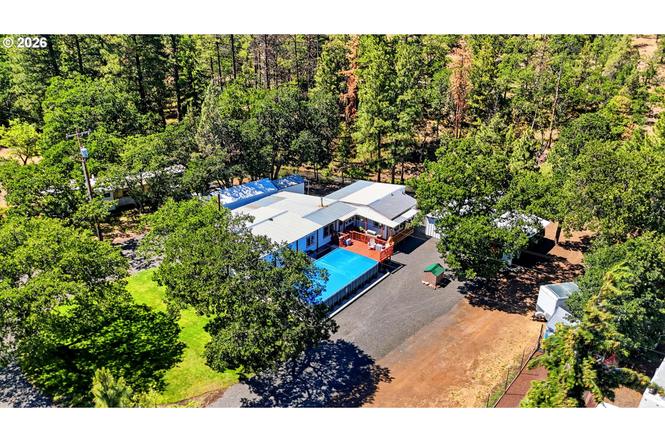
Welcome to this clean, move-in ready Pine Grove waterfront home, offering comfort, charm, and a peaceful setting you will love. With 3 bedrooms, including a spacious primary suite addition, this home is set up for easy living and relaxing both inside and out. Enjoy the 16x32 heated pool in the front, currently kept around 90 degrees, or relax in the hot tub on the back deck while overlooking the beautiful creek/irrigation ditch. It is such a calm and peaceful setting. The home has AC for year-round comfort, and the property also features several outbuildings, including a heated shop with AC. Currently used as a personal paint studio, this flexible space could be ideal for hobbies, projects,
Key facts
- Heated shop
- Hot tub
- Waterfront home
Tags
Property features AI
Finance
- Other: Property is resale; Main level area: 1,536 (floor plan)
Exterior
- Parking: Covered carport (2 spaces); RV hookup
- Utilities: Public water; Septic tank sewer; Electric service
- Home design: Manufactured home on real property (residential); Single-story/main level living; Built in 1977; Composition and metal roofing; Aluminum, wood and other exterior siding
- Construction: Built in 1977; Aluminum and wood siding; Composition and metal roof
- Exterior features: Deck; Fenced yard; Fire pit; Outbuilding; Workshop; Yard; RV parking and RV/boat storage; Second garage; Gated, level lot; Water frontage on a creek; Irrigation ditch on the parcel
Interior
- Kitchen: Kitchen (sunken)
- Bedrooms: Primary bedroom with attached bathroom and walk-in closet (Main level); Second bedroom with bathroom (Main level); Third bedroom (Main level)
- Bathrooms: Three full bathrooms (all on the main level)
- Heating & cooling: Forced air heating; Central air conditioning
- Interior features: Sunken kitchen; Bonus room; Office; Dining room; Family room; Living room; Great room
- Laundry & utility: Electric hot water
Neighborhood map
What this means for you Summary
Snapshot
- This is a 3-bed/2.0-bath manufactured listed at $310k.
Deal economics
- At list price, monthly cash flow is $-338 ($-4k/yr) — negative.
- To cash-flow at today's rent, offer at most $250k (19.3% below list).
- To meet the 1% rule (rent ≥ 1% of price), the offer needs to be $208k (33.0% below list).
- Recommended offer: $208k (33.0% below list) — sets the bar for 1% rule.
Location & tenants
- Location reads 53/100 on livability (#335 in OR) — a working-class tenant base; expect higher turnover. Strengths: cost of living A+; Watch: health & safety C-, crime F, amenities F.
- South Wasco County SD 1 (rural): math 20% / reading 50% proficiency, ranked #142 of 183 in OR (top 78%) — families likely to look elsewhere, expect single-tenant / working-renter base with shorter leases.
- Zoned schools: Maupin Elementary School (math 24% / reading 30%, grade F, #288 of 412 statewide, top 73%, 112 students, 62% FRL); South Wasco County High School (math 15% / reading 54%, grade F, #90 of 143 statewide, top 65%, 112 students, 88% FRL) — zoned schools average 75% FRL vs 57% district-wide (19 pts higher); higher-poverty schools than district average — tighter screening recommended.
- Market conditions: 32 active listings in the ZIP; 48 units permitted in Wasco County in 2024 (0 in 5+ unit buildings).
Forward outlook
- In year one you build about $33k of equity ($2k loan paydown + $31k appreciation (10.0% local appreciation)).
- Wasco County population projected at +6% by 2050 — modest demand growth; plan on rents tracking national, not racing it.
- By year 2, paydown + projected appreciation supports a ~$53k cash-out refi (75% LTV) — recoverable capital for the next deal without selling this one.
Negotiation context
- Only 1 days on market — expect competitive offers; lowballing is unlikely to land.
- Current owner paid $60k; list at $310k implies a 417% gain — meaningful room to come down on a strong offer.
Risks & watch-outs
- Watch-outs: flood insurance adds $125/mo.
- Climate carrying-cost: in FEMA flood zone A (mandatory federal flood insurance); severe wildfire risk — expect insurance premiums to compound above CPI over the hold.
Questions for the listing agent
- What do current leases actually rent for vs. the listed asking? Can we see a recent rent roll and the last 12 months of T-12 income?
- Built in 1977 — when were the roof, HVAC, electrical panel, plumbing, and water heater last replaced?
- What's the actual annual flood-insurance premium (NFIP or private), and is the property in a SFHA with mandatory coverage?
- Is there a deadline driving the sale (1031 exchange, divorce, estate, relocation)? That informs how much negotiation room exists.
- Schools are F-rated, which usually means shorter tenancies and higher turnover. Who's the typical renter profile here, and what's been the actual vacancy rate?
- Crime grade is F in this area — have there been break-ins, vandalism, or insurance claims at this property in the last 3 years? What carrier currently insures it and at what premium?
- The area grade is low — what's the realistic commute time and amenity access for the typical tenant pool here? Any planned neighborhood developments (good or bad) we should know about?
- What's the average days-on-market for RENTAL listings here right now (not sales)? A rising rental-DOM trend means longer vacancies and softer asking-rent achievability than the comps imply.
- What's the recent tenant-quality profile in this submarket — average credit score on applications, eviction rate, late-payment / NSF rate, and stable-employment percentage? A property-management company in the area should have these aggregated.
- How much new for-sale + rental construction is in the pipeline within 1–3 miles? Heavy new supply typically softens prices + rents 12–24 months out; constrained supply supports both.
Investment metrics
- 1% rule
- 0.67% ✗
- Cap rate
- 5.47%
- Cash-on-cash
- -2.95%
- DSCR
- 0.87
- GRM
- 12.4
CMA / ARV
No comps found within radius.
Projected returns pro-forma
10.0% appreciation · 3.0% rent growth · sell at horizon
- IRR
- 21.0%
- Equity multiple
- 2.70×
- Total profit
- $147,214
- Equity at exit
- $279,273
- IRR
- 19.0%
- Equity multiple
- 6.19×
- Total profit
- $450,332
- Equity at exit
- $602,262
Cash invested: $86,800 (down + closing). Projections, not guarantees.
Landlord ↔ Tenant lean methodology
- Overall (STATE)
- 28 Tenant-Leaning
- State Oregon
- 28 Tenant-Leaning · D+6
- County
- — inherits STATE
- City
- — inherits STATE
ZIP-level market 97037
- Home prices YoY
- 19.2%
- Active inventory
- 32
- Price-to-rent
- 12.4×
Monthly cashflow live
- Estimated rent
- $2,078 medium interval (Pro) →
- Mortgage (P&I)
- −$1,626
- Tax from tax record
- −$100 /mo · $1,198/yr
- Insurance
- −$129
- Flood insurance flood zone
- −$125 /mo · $1,502/yr
- HOA
- −$0
- Vacancy / Maint / Mgmt
- −$436
- Net cashflow
- $-338
Break-even live
UW: 25.0% down · 7.5% · 30yr · 1.5% tax · 5.0% vac · 8.0% maint · 8.0% mgmt
Financing live
Cash to close
- Down payment
- $77,500
- Closing costs
- $9,300
- Reserves months
- —
- Total cash needed
- —
Loan-product check · same deal, 3 products live
Conventional
25% down · 7.5% · 30yr
- Down + closing
- —
- Monthly P&I
- —
- Monthly cashflow
- —
- DSCR
- —
- Eligible?
- —
Personal DTI + credit; lowest rate.
DSCR
20% down · 8.5% · 30yr
- Down + closing
- —
- Monthly P&I
- —
- Monthly cashflow
- —
- DSCR
- —
- Eligible?
- —
No personal income docs; deal must DSCR.
Hard money
10% down · 12.0% · 12mo
- Down + closing
- —
- Monthly P&I
- —
- Monthly cashflow
- —
- DSCR
- —
- Eligible?
- —
Short-term bridge; refi at stabilization.
Listing history 2 events
-
2026-06-17remarks 699-char remark
-
2026-06-17$310,000 Active 1 DOM
ⓘ Source: listings_history table (triggers on properties + properties_extension) + one-shot
backfill from property_details.listing_events for pre-trigger history.
Tax reassessment forecast OR · Resets to sale price
- Current annual tax
- $1,198 · $100/mo
- Projected year-2 tax
- $3,007 · $251/mo
- Expected delta
- +$1,809/yr (+$151/mo · 150.9%)
ⓘ Screening estimate from a state-policy table — verify with the county assessor before closing.
Climate risk First Street
- Flood 9/10 Extreme FEMA zone A · 99% chance over 30 yrs
- Wildfire 8/10 Severe
- Heat 3/10 Moderate 6 d/yr ≥93°F today · 12 d/yr by 30 yrs out
- Wind 1/10 Low
- Air quality 10/10 Extreme 18 unhealthy d/yr today · 20 by 30 yrs out
Nearby sold comps map
Loading sold comps map…
Walkable amenities ~0.75 mi
Loading nearby amenities…
Taxation est. · year 1
- Rental income
- $24,934
- − Mortgage interest
- −$17,365
- − Property taxes
- −$1,198
- − Insurance
- −$3,052
- − Repairs & maintenance
- −$1,995
- − Management
- −$1,995
- − Depreciation
- −$9,018
- Taxable loss
- −$9,689
- Est. tax savings @ 24.0%
- +$2,325
- After-tax cash flow
- $-1,735/yr
For passive investors: Depreciation is non-cash, so a rental often shows a tax loss while cash-flowing — sheltering income. Rental losses are passive: they offset passive income freely, and up to $25,000/yr can offset ordinary (W-2) income if you actively participate and your MAGI is under $100k (phasing out to $0 by $150k); unused losses carry forward. On sale, claimed depreciation is recaptured at up to 25%, and gains may owe capital-gains tax (a 1031 exchange can defer both). Figures are a year-1 estimate at your 24.0% rate — not tax advice; consult a CPA.
Schools (NCES district)
- District
- South Wasco County SD 1
- NCES district ID
- 4100021
- Math proficiency
- 20% ▬ 0.00%
- Reading proficiency
- 50% ▲ 5.00%
- Median HH income
- $40,943
- Composite
- 32.06/100
- National rank
- #10996
- State rank
- #142 of 183 in OR
Livability — Pine Grove
- Score
- 53/100
- State rank
- #335
- US rank
- #24281
Category grades
Schools grade is shown separately in the Schools card above.
Census & demographics
- Census place
- Pine Grove, OR
- Population (ZIP)
- 857
Population outlook (Wasco County) Hauer SSP2
- Today (2025)
- 26,588 people
- By 2030
- 26,950 · +1.4%
- By 2040
- 27,513 · +3.5%
- By 2050
- 28,041 · +5.5%
- By 2075
- 29,840 · +12.2%
- By 2100
- 29,617 · +11.4%
Race, ethnicity, and origin ACS 2023
- Neighborhood character
- Predominantly White (93%)
- Race & ethnicity
- White 93% Two or more races 3% Asian 3% Hispanic / Latino 2%
- Common ancestry
- Slovak 5% Scottish 4% Portuguese 3%
- Foreign-born
- 4% · Canada
- Languages at home
- 96% English-only · Other Indo-European 1% Chinese 1% Spanish 1%
Political lean MEDSL · Wasco
- 2024 margin
- Lean R (+5.7) · D 45.5% · R 51.2% · Other 3.2%
- 2008→2024 swing
- -12.7pp toward R · 2008: 7.1pp · 2024: -5.7pp
- All cycles
- 2024: R+5.7 2020: R+3.0 2016: R+9.7 2012: R+0.8 2008: D+7.1
Not yet ingested
- Civics
- —
Market trends
- HPI YoY
- ▲ 41.89%
- Current HPI
- 260.21
- Rent YoY
- —
- Metro
- —
- State GDP YoY
- ▲ 2.05%
- F500 in state
- 2
Industry mix (Fortune 500 HQ in OR)
| Industry | F500 HQs | Revenue |
|---|---|---|
| Consumer Goods | 1 | $51B |
|
||
Price history
+933.3% since first listed4 events — show timeline
- 2026-06-17 Listed $310,000 RMLS
- 2015-02-09 Sold (Public Records) $60,000 Public Records
- 2005-06-13 Sold (Public Records) $60,000 Public Records
- 2004-08-23 Sold (Public Records) $30,000 Public Records
Property tax history
+7.8%/yrLatest (2025): $1,198 · +9.9% YoY. Source: county tax records.
Cash-flow waterfall
monthlySold comps — $/sqft
last 12 mo · ≤1 miLoading sold comps…