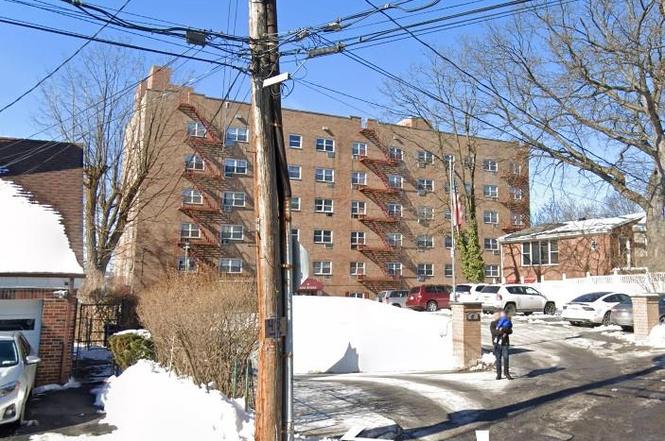
47 Alta Ave Unit 5A · Yonkers, NY
Flood risk 1/10 · Minimal
- FEMA flood zone
- X (unshaded)
- Chance of flooding over 30 yrs
- 0.0%
- Est. flood insurance / yr
- $473 – $860
Fire risk 1/10 · Minimal
- Est. fire insurance / yr
- $691 – $1,283
Heat risk 6/10 · Moderate
- Hot days now (above 99°F)
- 7 days/yr
- Hot days in 30 yrs
- 15 days/yr
Wind risk 6/10 · Moderate
- Chance of severe wind over 30 yrs
- 27.0%
Air-quality risk 3/10 · Minor
- Unhealthy air days now
- 3 days/yr
- Unhealthy air days in 30 yrs
- 4 days/yr
Risk factors via First Street. Map © Google.
Why this score? — see what drove the B grade
The composite is a weighted blend of 9 inputs, each scored 0–100. Each bar is that input's sub-score; the figure is the points it added to the 100-point composite (weight × sub-score).
- Cash flow +29.8/30.0
- 1% rule +10.0/10.0
- DSCR +10.0/10.0
- ARV discount +7.5/15.0
- Rent growth +4.8/5.0
- Schools +4.1/10.0
- Livability +3.4/5.0
- Condition / age +2.5/5.0
- Appreciation +0.0/10.0
$100,000
🖨 Deal sheet 📄 Offer letter ✓ Due diligence
Listing remarks
47 Alta Avenue, Unit 5A, isn’t just a one-bedroom co-op—it’s a pause button in the middle of Yonkers. This home sits above the noise without feeling removed from the city. From the moment you step inside, there’s a sense of simplicity done right. The layout is efficient and comfortable, with just enough separation between living and sleeping spaces to make the apartment feel larger than its footprint. Natural light filters in, softening the rooms and giving the space an easy, lived-in warmth. The living area invites quiet mornings and relaxed evenings—coffee by the window, a book on the couch, or a low-key night in after a long day. The bedroom offers a true r
Key facts
- Close to parks
- Natural light
- Living area
Tags
Neighborhood map
What this means for you Summary
Snapshot
- This is a 1-bed/1.0-bath condo listed at $100k.
Deal economics
- At list price, monthly cash flow is $366 ($4k/yr) — positive.
- The deal already cash-flows at list — no discount required.
- Meets the 1% rule at list price ($2k rent vs $100k).
- Recommended offer: $97k (3.0% below list) — sets the bar for market timing.
- Cap rate 10.7% vs local median 5.3% in Yonkers — top-decile yield for the area; either an underpriced asset or a hidden risk that comps aren't pricing in. Stress-test before assuming the spread holds.
Location & tenants
- Location reads 68/100 on livability (#528 in NY) — a middle-class / working-renter tenant base. Strengths: employment A, commute B; Watch: amenities F, cost of living F.
- Yonkers City School District (suburban): math 41% / reading 54% proficiency, ranked #413 of 590 in NY (top 70%) — families likely to look elsewhere, expect single-tenant / working-renter base with shorter leases; 64% free/reduced lunch — lower-income household profile, screen leases tightly.
- Zoned schools: Yonkers Early Childhood Academy (327 students, 72% FRL); Yonkers Middle School (math 17% / reading 37%, grade F, #587 of 729 statewide, top 81%, 601 students, 88% FRL); Yonkers High School (math 92% / reading 88%, grade A+, #238 of 1,100 statewide, top 23%, 1,060 students, 76% FRL) — zoned schools average 79% FRL vs 64% district-wide (15 pts higher); higher-poverty schools than district average — tighter screening recommended.
- Market conditions: Rents rising fast (+9.0%/yr); 86 active listings in the ZIP; 31 comparable units currently listed for rent nearby; rentals at typical pace (median 15d on market — plan ~3-4 weeks tenant-placement turnaround); 954 units permitted in Westchester County in 2024 (649 in 5+ unit buildings).
- This rent runs 39% of the median local income ($68k/yr) — at the standard rent-burdened threshold; future hikes will face affordability resistance.
Forward outlook
- Local home prices are declining (-3.0%/yr); year-one equity from $691 of loan paydown is wiped out by about $3k of value loss. Plan a longer hold.
- Westchester County population projected at +10% by 2050 — modest demand growth; plan on rents tracking national, not racing it.
- At projected returns (-3.0% appreciation + 8.0% rent growth), your $28k cash investment doubles in ~6 years — after that, you're playing with house money.
Negotiation context
- It's been on market 57 days — a 3% lower offer ($97k) is reasonable based on typical stale-listing flexibility.
- 7 sale attempts since 12y ago; this cycle's ask has dropped $49k (33%) from the opening price — seller is motivated, your offer sets the floor, not the list.
Risks & watch-outs
- Watch-outs: HOA is 31% of rent.
- Climate carrying-cost: major wind risk, 27% chance of damaging wind over 30y; extreme-heat days projected 7→15/yr by 2055 (HVAC capex compounding) — expect insurance premiums to compound above CPI over the hold.
Questions for the listing agent
- It's been on market 57 days. Have you received any prior offers? Is the seller open to a 3% concession, seller financing, or rate buy-down credit?
- Built in 1974 — when were the roof, HVAC, electrical panel, plumbing, and water heater last replaced?
- What does the HOA fee cover, when was the last increase, and are there any pending special assessments or reserve-fund shortfalls?
- Any open or pending special assessments — roof, HVAC, plumbing, elevator, façade? What's the per-unit balance and payoff schedule, and is the seller paying it off at close or rolling it to the buyer?
- Is there a deadline driving the sale (1031 exchange, divorce, estate, relocation)? That informs how much negotiation room exists.
- What's the average days-on-market for RENTAL listings here right now (not sales)? A rising rental-DOM trend means longer vacancies and softer asking-rent achievability than the comps imply.
- What's the recent tenant-quality profile in this submarket — average credit score on applications, eviction rate, late-payment / NSF rate, and stable-employment percentage? A property-management company in the area should have these aggregated.
- How much new apartment / multifamily construction is in the pipeline within 1–3 miles? Heavy new supply (>2% of stock underway) typically softens rents 12–24 months out; light construction supports rent growth.
Investment metrics
- 1% rule
- 2.21% ✓
- Cap rate
- 10.68%
- Cash-on-cash
- 15.67%
- DSCR
- 1.70
- GRM
- 3.8
CMA / ARV
No comps found within radius.
Projected returns pro-forma
-3.0% appreciation · 8.0% rent growth · sell at horizon
- IRR
- 15.6%
- Equity multiple
- 1.69×
- Total profit
- $19,242
- Equity at exit
- $14,910
- IRR
- 29.3%
- Equity multiple
- 4.64×
- Total profit
- $101,852
- Equity at exit
- $8,646
Cash invested: $28,000 (down + closing). Projections, not guarantees.
Landlord ↔ Tenant lean methodology
- Overall (CITY)
- 5 Strongly Tenant-Friendly
- State New York
- 15 Strongly Tenant-Friendly · D+10
- County
- — inherits STATE
- City Yonkers
- 5 Strongly Tenant-Friendly · D+20
ZIP-level market 10705
- Rents YoY
- 9.0%
- Active inventory
- 86
- Price-to-rent
- 3.8×
Monthly cashflow live
- Estimated rent
- $2,214 high interval (Pro) →
- Mortgage (P&I)
- −$524
- Tax est. 1.5%
- −$125 /mo · $1,500/yr
- Insurance
- −$42
- HOA
- −$692
- Vacancy / Maint / Mgmt
- −$465
- Net cashflow
- $366
Break-even live
UW: 25.0% down · 7.5% · 30yr · 1.5% tax · 5.0% vac · 8.0% maint · 8.0% mgmt
Financing live
Cash to close
- Down payment
- $25,000
- Closing costs
- $3,000
- Reserves months
- —
- Total cash needed
- —
Loan-product check · same deal, 3 products live
Conventional
25% down · 7.5% · 30yr
- Down + closing
- —
- Monthly P&I
- —
- Monthly cashflow
- —
- DSCR
- —
- Eligible?
- —
Personal DTI + credit; lowest rate.
DSCR
20% down · 8.5% · 30yr
- Down + closing
- —
- Monthly P&I
- —
- Monthly cashflow
- —
- DSCR
- —
- Eligible?
- —
No personal income docs; deal must DSCR.
Hard money
10% down · 12.0% · 12mo
- Down + closing
- —
- Monthly P&I
- —
- Monthly cashflow
- —
- DSCR
- —
- Eligible?
- —
Short-term bridge; refi at stabilization.
Rent comps 31 comps
| Address | Beds | Baths | Sqft | Rent | $/sqft | DOM | Units | Dist |
|---|---|---|---|---|---|---|---|---|
| 162 Willow St Unit 1F Yonkers, NY | 1.0 | 1.0 | 700 | $2,200 | $3.14 | 14d | 1 | 0.30mi |
| 162 Willow St Yonkers, NY | 1.0 | 1.0 | 700 | $2,100 | $3.00 | 7d | 1 | 0.30mi |
| 158 Willow St Unit 1B Yonkers, NY | 2.0 | 1.0 | 600 | $2,100 | $3.50 | 1d | 1 | 0.30mi |
| 97 Waverly St Unit 3R Yonkers, NY | 1.0 | 1.0 | 600 | $1,850 | $3.08 | 15d | 1 | 0.45mi |
| 117 Morris St Yonkers, NY | 1.0 | 1.0 | 700 | $2,000 | $2.86 | 5d | 1 | 0.49mi |
| 280 Hawthorne Ave Yonkers, NY | 1.0 | 1.0 | 700 | $2,100 | $3.00 | 7d | 2 | 0.50mi |
| 27 Cliff St Yonkers, NY | 1.0 | 1.0 | 500 | $2,000 | $4.00 | 43d | 1 | 0.50mi |
| 91 Elm St Unit 1A Yonkers, NY | 1.0 | 1.0 | 650 | $1,800 | $2.77 | 16d | 1 | 0.58mi |
| 91 Elm St Unit 1A Yonkers, NY | 1.0 | 1.0 | 650 | $1,900 | $2.92 | 43d | 1 | 0.58mi |
| 56 Prospect St Unit 206 Yonkers, NY | — | 1.0 | 450 | $1,995 | $4.43 | 24d | 1 | 0.63mi |
| 23 N Broadway Unit 4B Yonkers, NY | — | 1.0 | 429 | $1,950 | $4.55 | 43d | 1 | 0.64mi |
| 23 N Broadway Unit 4F Yonkers, NY | 2.0 | 1.0 | 699 | $2,400 | $3.43 | 22d | 1 | 0.64mi |
| 44 Hudson St Yonkers, NY | 2.0 | 1.0–2.0 | 922 | $3,200 | $3.47 | 7d | 25 | 0.64mi |
| 2 Mill St Unit 2B Yonkers, NY | — | 1.0 | 741 | $2,095 | $2.83 | 43d | 1 | 0.65mi |
| 36 Bruce Ave Yonkers, NY | 1.0 | 1.0 | 625 | $1,785 | $2.86 | 43d | 1 | 0.66mi |
| 30 Locust Hill Ave Yonkers, NY | 1.0–2.0 | 1.0 | 735 | $1,800 | $2.45 | 43d | 3 | 0.68mi |
| 30 Locust Hill Ave Yonkers, NY | 1.0–2.0 | 1.0 | 735 | $1,800 | $2.45 | 7d | 2 | 0.68mi |
| 50 Nepperhan St Yonkers, NY | 3.0 | 1.0–2.0 | 887 | $3,248 | $3.66 | 1d | 20 | 0.69mi |
| 66 Main St Yonkers, NY | 2.0 | 1.0–2.0 | 906 | $2,786 | $3.07 | 3d | 4 | 0.70mi |
| 20 Water Grant St Yonkers, NY | 1.0–2.0 | 1.0–2.0 | 827 | $2,522 | $3.05 | 1d | 22 | 0.75mi |
| 1 Alexander St Yonkers, NY | 2.0 | 1.0–2.0 | 837 | $3,188 | $3.81 | 7d | 48 | 0.85mi |
| 70 Ashburton Ave Yonkers, NY | — | 1.0 | 420 | $1,738 | $4.14 | 15d | 1 | 0.90mi |
| 20 Porach St Apt -1B Yonkers, NY | 2.0 | 1.0 | 750 | $2,400 | $3.20 | 43d | 1 | 0.92mi |
| 20 Porach St Unit 2A Yonkers, NY | 1.0 | 1.0 | 550 | $2,200 | $4.00 | 43d | 1 | 0.92mi |
| 130 Harrison Ave Yonkers, NY | 1.0 | 1.0 | 650 | $1,900 | $2.92 | 43d | 1 | 0.95mi |
| 249 McLean Ave Unit 1B Yonkers, NY | 1.0 | 1.0 | 700 | $2,500 | $3.57 | 17d | 1 | 0.99mi |
| 57 Alexander St Yonkers, NY | 2.0 | 1.0–2.0 | 765 | $2,956 | $3.86 | 2d | 21 | 1.00mi |
| 79 Alexander St Yonkers, NY | 3.0 | 1.0–2.5 | 997 | $2,933 | $2.94 | 2d | 1 | 1.05mi |
| 154 Woodworth Ave Yonkers, NY | 2.0 | 1.0 | 650 | $2,350 | $3.62 | 17d | 1 | 1.16mi |
| 154 Woodworth Ave Yonkers, NY | 1.0 | 1.0 | 650 | $2,500 | $3.85 | 43d | 1 | 1.16mi |
| 55 Riverside Dr Yonkers, NY | 3.0 | 1.0–2.0 | 819 | $2,990 | $3.65 | 2d | 13 | 1.31mi |
HOA detail condo
- Monthly dues
- $692 · $8,304/yr
- Assessments
- None detected in remarks — confirm with the listing agent.
Listing history 17 events
-
2026-05-08status Pending
-
2026-04-14status Active
-
2026-03-04price $100,000
-
2026-02-16price $134,000
-
2026-01-21$149,000 Active
-
2016-07-01historical Expired
-
2016-06-30historical
-
2016-05-19status Active
-
2016-04-20historical Pending
-
2016-02-23Active
-
2016-02-22$59,000
-
2015-10-01historical Expired
-
2015-09-30historical
-
2015-08-22price
-
2014-12-02price
-
2014-10-29Active
-
2014-10-29$65,000
ⓘ Source: listings_history table (triggers on properties + properties_extension) + one-shot
backfill from property_details.listing_events for pre-trigger history.
Climate risk First Street
- Flood 1/10 Low FEMA zone X (unshaded) · 0% chance over 30 yrs
- Wildfire 1/10 Low
- Heat 6/10 Major 7 d/yr ≥99°F today · 15 d/yr by 30 yrs out
- Wind 6/10 Major 27% chance of damaging wind over 30 yrs
- Air quality 3/10 Moderate 3 unhealthy d/yr today · 4 by 30 yrs out
Nearby sold comps map
Loading sold comps map…
Walkable amenities ~0.75 mi
Loading nearby amenities…
Taxation est. · year 1
- Rental income
- $26,563
- − Mortgage interest
- −$5,602
- − Property taxes
- −$1,500
- − Insurance
- −$500
- − Repairs & maintenance
- −$2,125
- − Management
- −$2,125
- − HOA
- −$8,304
- − Depreciation
- −$2,909
- Taxable income
- $3,498
- Est. tax owed @ 24.0%
- −$840
- After-tax cash flow
- $3,548/yr
For passive investors: Depreciation is non-cash, so a rental often shows a tax loss while cash-flowing — sheltering income. Rental losses are passive: they offset passive income freely, and up to $25,000/yr can offset ordinary (W-2) income if you actively participate and your MAGI is under $100k (phasing out to $0 by $150k); unused losses carry forward. On sale, claimed depreciation is recaptured at up to 25%, and gains may owe capital-gains tax (a 1031 exchange can defer both). Figures are a year-1 estimate at your 24.0% rate — not tax advice; consult a CPA.
Schools (NCES district)
- District
- Yonkers City School District
- NCES district ID
- 3631920
- Math proficiency
- 41% ▼ -1.00%
- Reading proficiency
- 54% ▲ 14.00%
- Median HH income
- $58,042
- Composite
- 41.43/100
- National rank
- #3471
- State rank
- #413 of 590 in NY
Livability — Yonkers
- Score
- 68/100
- State rank
- #528
- US rank
- #9394
Category grades
Schools grade is shown separately in the Schools card above.
Census & demographics
- Census place
- Yonkers, NY
- County
- Westchester County · 709,332 people
- City population
- 212,407
- Metro
- New York-Newark-Jersey City, NY-NJ-PA
- Population (ZIP)
- 38,887
- Household income
- $67,918
- Rent vs Own
- Severe rent burden
- 2783.0
Population outlook (Westchester County) Hauer SSP2
- Today (2025)
- 1,028,035 people
- By 2030
- 1,051,636 · +2.3%
- By 2040
- 1,098,520 · +6.9%
- By 2050
- 1,136,044 · +10.5%
- By 2075
- 1,196,925 · +16.4%
- By 2100
- 1,175,147 · +14.3%
Race, ethnicity, and origin ACS 2023
- Neighborhood character
- Diverse neighborhood (Simpson 0.56)
- Race & ethnicity
- Hispanic / Latino 62% White 17% Two or more races 16% Black 12% Asian 5% Native American 1%
- Hispanic origin (detail)
- Mexican 13% Puerto Rican 9% Dominican 27%
- Common ancestry
- Scotch-Irish 1% Romanian 1%
- Foreign-born
- 40% · Canada, Jamaica, South Korea
- Languages at home
- 39% English-only · Spanish 51% Other Indo-European 3% Other Asian/Pacific 2%
Political lean MEDSL · Westchester
- 2024 margin
- Strong D (+26.3) · D 63.1% · R 36.9%
- 2008→2024 swing
- -1.3pp toward R · 2008: 27.6pp · 2024: 26.3pp
- All cycles
- 2024: D+26.3 2020: D+36.3 2016: D+32.8 2012: D+22.2 2008: D+27.6
Not yet ingested
- Civics
- —
Market trends
- HPI YoY
- ▼ -368.22%
- Current HPI
- 314.1777
- Rent YoY
- ▲ 9.00%
- Metro
- New York-Newark-Jersey City, NY-NJ-PA
- State GDP YoY
- ▲ 2.60%
- F500 in state
- 92
Industry mix (Fortune 500 HQ in NY)
| Industry | F500 HQs | Revenue |
|---|---|---|
| Financial Services | 10 | $950B |
|
||
| Consumer Goods | 9 | $162B |
|
||
| Insurance | 4 | $225B |
|
||
| Telecommunications | 2 | $144B |
|
||
| Pharmaceuticals | 2 | $112B |
|
||
| Media / Entertainment | 2 | $69B |
|
||
Price history
+53.8% since first listed17 events — show timeline
- 2026-05-08 Pending — OneKey® MLS as Distributed by MLS Grid
- 2026-04-14 Relisted — OneKey® MLS as Distributed by MLS Grid
- 2026-03-04 Price Changed $100,000 OneKey® MLS as Distributed by MLS Grid
- 2026-02-16 Price Changed $134,000 OneKey® MLS as Distributed by MLS Grid
- 2026-01-21 Listed $149,000 OneKey® MLS as Distributed by MLS Grid
- 2016-07-01 Delisted — HGMLS
- 2016-06-30 Listing Removed — OneKey® MLS as Distributed by MLS Grid
- 2016-05-19 Relisted — HGMLS
- 2016-04-20 Contingent — HGMLS
- 2016-02-23 Listed — HGMLS
- 2016-02-22 Listed $59,000 OneKey® MLS as Distributed by MLS Grid
- 2015-10-01 Delisted — HGMLS
- 2015-09-30 Listing Removed — OneKey® MLS as Distributed by MLS Grid
- 2015-08-22 Price Changed — HGMLS
- 2014-12-02 Price Changed — HGMLS
- 2014-10-29 Listed — HGMLS
- 2014-10-29 Listed $65,000 OneKey® MLS as Distributed by MLS Grid
Cash-flow waterfall
monthlySold comps — $/sqft
last 12 mo · ≤1 miLoading sold comps…