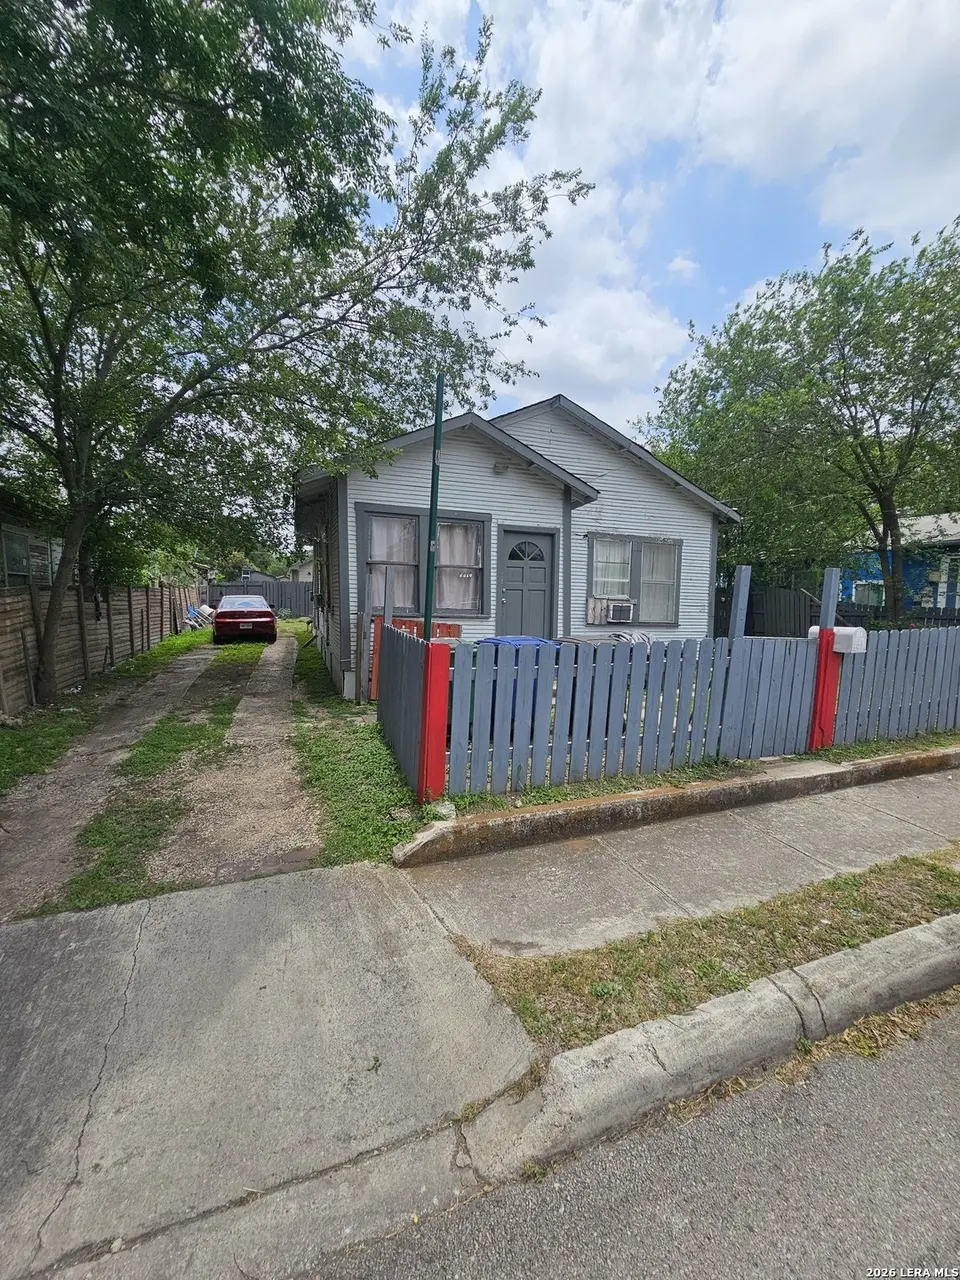
2318 W Poplar St · San Antonio, TX
Flood risk 1/10 · Minimal
- FEMA flood zone
- X (unshaded)
- Chance of flooding over 30 yrs
- 0.0%
- Est. flood insurance / yr
- $507 – $1,088
Fire risk 1/10 · Minimal
- Est. fire insurance / yr
- $1,222 – $2,270
Heat risk 8/10 · Major
- Hot days now (above 109°F)
- 7 days/yr
- Hot days in 30 yrs
- 22 days/yr
Wind risk 6/10 · Moderate
- Chance of severe wind over 30 yrs
- 77.0%
Air-quality risk 2/10 · Minimal
- Unhealthy air days now
- 1 days/yr
- Unhealthy air days in 30 yrs
- 2 days/yr
Risk factors via First Street. Map © Google.
Why this score? — see what drove the B+ grade
The composite is a weighted blend of 9 inputs, each scored 0–100. Each bar is that input's sub-score; the figure is the points it added to the 100-point composite (weight × sub-score).
- Cash flow +25.6/30.0
- ARV discount +15.0/15.0
- Appreciation +10.0/10.0
- DSCR +8.5/10.0
- 1% rule +7.1/10.0
- Rent growth +4.4/5.0
- Livability +4.0/5.0
- Condition / age +2.5/5.0
- Schools +1.4/10.0
$120,000
🖨 Deal sheet 📄 Offer letter ✓ Due diligence
Listing remarks MLS
Not willing to put more money into this property, selling as is. Current tenant pays 800 per month - on month to month can move with 30 days notice.
Key facts
- Woodlawn lake park
- Conveniently located
- Close to downtown
Tags
Property features AI
Exterior
- Utilities: Public water; Public sewer
- Home design: Pre-owned home; Approximately 93 years old
- Construction: Composition roof
- Exterior features: Wood exterior
Interior
- Kitchen: Kitchen approx. 10 x 11
- Bedrooms: Master bedroom (lower level), approx. 11 x 12; Second bedroom, approx. 11 x 12; Third bedroom, approx. 10 x 12
- Flooring: Wood flooring
- Bathrooms: 1 full bathroom
- Heating & cooling: Electric heating; Multiple window air conditioning units (3+); Other heating (see remarks)
- Interior features: Living area separate from dining room; City garbage service
- Laundry & utility: Laundry on lower level; Washer connection; Dryer connection
Neighborhood map
What this means for you Summary
Snapshot
- This is a 3-bed/1.0-bath single-family listed at $120k.
Deal economics
- At list price, monthly cash flow is $285 ($3k/yr) — positive.
- The deal already cash-flows at list — no discount required.
- Meets the 1% rule at list price ($1k rent vs $120k).
- Recommended offer: $118k (1.5% below list) — sets the bar for market timing.
- Cap rate 9.1% vs local median 3.8% in San Antonio — top-decile yield for the area; either an underpriced asset or a hidden risk that comps aren't pricing in. Stress-test before assuming the spread holds.
Location & tenants
- Location reads 80/100 on livability (#31 in TX, #1,616 nationally) — a professional / high-income tenant draw. Strengths: amenities A+, commute A+, cost of living A+; Watch: crime F.
- San Antonio ISD (urban): math 12% / reading 22% proficiency, ranked #805 of 826 in TX (top 98%) — low school quality limits family demand, transient renter base, plan for 1-2y turnover; 80% free/reduced lunch — lower-income household profile, screen leases tightly.
- Zoned schools: Ogden El (math 4% / reading 9%, grade F, #4,313 of 4,322 statewide, top 100%, 384 students, 97% FRL, charter); Lanier H S (math 9% / reading 15%, grade F, #1,554 of 1,632 statewide, top 95%, 1,547 students, 97% FRL) — zoned schools average 97% FRL vs 80% district-wide (17 pts higher); higher-poverty schools than district average — tighter screening recommended.
- Market conditions: Rents rising fast (+7.7%/yr); 154 active listings in the ZIP; 40 comparable units currently listed for rent nearby; rentals at typical pace (median 24d on market — plan ~3-4 weeks tenant-placement turnaround); 42% of comp listings sitting > 30 days — soft ceiling on asking rent; lower-income renter base — watch delinquency; 8,308 units permitted in Bexar County in 2024 (2,506 in 5+ unit buildings).
Forward outlook
- In year one you build about $13k of equity ($830 loan paydown + $12k appreciation (10.0% local appreciation)).
- Bexar County population projected at +50% by 2050 — long-run rental-demand tailwind backs the buy-and-hold thesis.
- At projected returns (10.0% appreciation + 7.7% rent growth), your $34k cash investment doubles in ~2 years — after that, you're playing with house money.
- By year 3, paydown + projected appreciation supports a ~$32k cash-out refi (75% LTV) — recoverable capital for the next deal without selling this one.
Negotiation context
- It's been on market 25 days — a 2% lower offer ($118k) is reasonable based on typical stale-listing flexibility.
- 5 sale attempts since 17y ago with the ask held roughly flat each time — persistent listings suggest the price (not the market) is what's stuck; bring a comps-based counter.
Risks & watch-outs
- Watch-outs: built in 1933 — expect roof / HVAC / electrical / plumbing capex.
- Climate carrying-cost: major wind risk, 77% chance of damaging wind over 30y; extreme-heat days projected 7→22/yr by 2055 (HVAC capex compounding) — expect insurance premiums to compound above CPI over the hold.
Questions for the listing agent
- Built in 1933 — when were the roof, HVAC, electrical panel, plumbing, and water heater last replaced?
- Is there a deadline driving the sale (1031 exchange, divorce, estate, relocation)? That informs how much negotiation room exists.
- Crime grade is F in this area — have there been break-ins, vandalism, or insurance claims at this property in the last 3 years? What carrier currently insures it and at what premium?
- What's the average days-on-market for RENTAL listings here right now (not sales)? A rising rental-DOM trend means longer vacancies and softer asking-rent achievability than the comps imply.
- What's the recent tenant-quality profile in this submarket — average credit score on applications, eviction rate, late-payment / NSF rate, and stable-employment percentage? A property-management company in the area should have these aggregated.
- How much new for-sale + rental construction is in the pipeline within 1–3 miles? Heavy new supply typically softens prices + rents 12–24 months out; constrained supply supports both.
Investment metrics
- 1% rule
- 1.21% ✓
- Cap rate
- 9.14%
- Cash-on-cash
- 10.17%
- DSCR
- 1.45
- GRM
- 6.9
CMA / ARV
- ARV (on-the-fly)
- $145,000
- Comps found
- 12
Show comp detail 12 sales within ~0.75 mi
| Address | Dist | Beds/Ba | Sqft | Sold | Price | $/sf | Match |
|---|---|---|---|---|---|---|---|
| 131 Neff | 0.42mi | 3/1.0 | 1,029 (+3%) | 6mo | $139,700 | $136 | 71 |
| 1111 Waverly | 0.49mi | 2/1.0 (-1) | 984 (-2%) | 3mo | $199,999 | $203 | 67 |
| 1503 Lombrano | 0.20mi | 3/1.0 | 872 (-13%) | 4mo | $90,000 | $103 | 66 |
| 945 Delgado | 0.64mi | 3/1.0 | 987 (-1%) | 7mo | $50,000 | $51 | 62 |
| 120 Henry St | 0.33mi | 2/1.5 (-1) | 910 (-9%) | 1mo | $149,500 | $164 | 62 |
| 819 N Hamilton Ave | 0.31mi | 3/1.0 | 1,144 (+14%) | 2mo | $55,000 | $48 | 60 |
| 1504 Waverly Ave | 0.58mi | 3/1.5 | 1,068 (+7%) | 1mo | $155,000 | $145 | 59 |
| 1023 Delgado | 0.55mi | 3/1.0 | 912 (-9%) | 2mo | $85,000 | $93 | 58 |
| 841 Texas | 0.61mi | 3/1.0 | 1,062 (+6%) | 6mo | $155,000 | $146 | 56 |
| 2111 Rivas | 0.73mi | 3/2.0 | 1,080 (+8%) | 1mo | $99,900 | $93 | 48 |
| 107 Blueridge | 0.55mi | 3/2.0 | 1,143 (+14%) | 9mo | $200,000 | $175 | 39 |
| 3430 W Salinas | 0.70mi | 2/2.0 (-1) | 852 (-15%) | 2mo | $180,000 | $211 | 32 |
Match score weights: distance 35% · size 25% · config 20% · recency 20%. Top-matched comps best support the ARV.
Projected returns pro-forma
10.0% appreciation · 7.73% rent growth · sell at horizon
- IRR
- 33.9%
- Equity multiple
- 3.70×
- Total profit
- $90,741
- Equity at exit
- $108,106
- IRR
- 30.9%
- Equity multiple
- 9.06×
- Total profit
- $270,711
- Equity at exit
- $233,134
Cash invested: $33,600 (down + closing). Projections, not guarantees.
Landlord ↔ Tenant lean methodology
- Overall (STATE)
- 87 Strongly Landlord-Friendly
- State Texas
- 87 Strongly Landlord-Friendly · R+5
- County
- — inherits STATE
- City
- — inherits STATE
ZIP-level market 78207
- Home prices YoY
- 15.2%
- Rents YoY
- 7.7%
- Active inventory
- 154
- Price-to-rent
- 6.9×
Monthly cashflow live
- Estimated rent
- $1,446 high interval (Pro) →
- Mortgage (P&I)
- −$629
- Tax from tax record
- −$178 /mo · $2,142/yr
- Insurance
- −$50
- HOA
- −$0
- Vacancy / Maint / Mgmt
- −$304
- Net cashflow
- $285
Break-even live
UW: 25.0% down · 7.5% · 30yr · 1.5% tax · 5.0% vac · 8.0% maint · 8.0% mgmt
Financing live
Cash to close
- Down payment
- $30,000
- Closing costs
- $3,600
- Reserves months
- —
- Total cash needed
- —
Loan-product check · same deal, 3 products live
Conventional
25% down · 7.5% · 30yr
- Down + closing
- —
- Monthly P&I
- —
- Monthly cashflow
- —
- DSCR
- —
- Eligible?
- —
Personal DTI + credit; lowest rate.
DSCR
20% down · 8.5% · 30yr
- Down + closing
- —
- Monthly P&I
- —
- Monthly cashflow
- —
- DSCR
- —
- Eligible?
- —
No personal income docs; deal must DSCR.
Hard money
10% down · 12.0% · 12mo
- Down + closing
- —
- Monthly P&I
- —
- Monthly cashflow
- —
- DSCR
- —
- Eligible?
- —
Short-term bridge; refi at stabilization.
Rent comps 40 comps
| Address | Beds | Baths | Sqft | Rent | $/sqft | DOM | Units | Dist |
|---|---|---|---|---|---|---|---|---|
| 1231 Rivas St Unit 102 San Antonio, TX | 3.0 | 2.0 | 1120 | $1,299 | $1.16 | 43d | 1 | 0.11mi |
| 1230 Rivas St San Antonio, TX | 3.0 | 2.5 | 1287 | $1,999 | $1.55 | 23d | 1 | 0.12mi |
| 206 Roberts St Unit 201 San Antonio, TX | 3.0 | 2.0 | 1100 | $1,350 | $1.23 | 23d | 1 | 0.18mi |
| 1545 Ruiz St San Antonio, TX | 2.0 | 2.0 | 1020 | $935 | $0.92 | 43d | 1 | 0.34mi |
| 230 Micklejohn St San Antonio, TX | 3.0 | 2.0 | 1368 | $1,595 | $1.17 | 23d | 1 | 0.42mi |
| 230 Micklejohn St San Antonio, TX | 3.0 | 2.0 | 1368 | $1,695 | $1.24 | 43d | 1 | 0.42mi |
| 234 Gould St Unit 102 San Antonio, TX | 2.0 | 1.5 | 948 | $1,195 | $1.26 | 4d | 1 | 0.65mi |
| 122 Collins Ct San Antonio, TX | 2.0 | 1.0 | 927 | $1,150 | $1.24 | 21d | 1 | 0.68mi |
| 3918 W Martin St San Antonio, TX | 3.0 | 1.0 | 1200 | $1,300 | $1.08 | 23d | 1 | 0.69mi |
| 811 Rivas St San Antonio, TX | 3.0 | 2.0 | 1276 | $1,580 | $1.24 | 23d | 1 | 0.72mi |
| 3038 W Salinas Unit 101 San Antonio, TX | 3.0 | 2.5 | 1149 | $1,550 | $1.35 | 4d | 1 | 0.73mi |
| 2503 Arbor Pl San Antonio, TX | 2.0 | 1.0 | 750 | $800 | $1.07 | 43d | 1 | 0.73mi |
| 1706 Texas Ave San Antonio, TX | 2.0 | 2.0 | 1204 | $1,500 | $1.25 | 43d | 1 | 0.77mi |
| 1706 Texas Ave San Antonio, TX | 2.0 | 2.0 | 1204 | $1,500 | $1.25 | 23d | 1 | 0.77mi |
| 2020 W Woodlawn Ave San Antonio, TX | 2.0 | 1.5 | 1200 | $1,298 | $1.08 | 43d | 1 | 0.91mi |
| 2619 W Houston St San Antonio, TX | 3.0 | 1.0 | 776 | $1,800 | $2.32 | 43d | 1 | 0.92mi |
| 614 N Sabinas St San Antonio, TX | 3.0 | 2.0 | 930 | $1,249 | $1.34 | 4d | 1 | 0.93mi |
| 1602 W Craig Pl San Antonio, TX | 2.0 | 1.0 | 1344 | $1,300 | $0.97 | 43d | 1 | 0.95mi |
| 2050 W Mistletoe Ave San Antonio, TX | 3.0 | 2.0 | 1442 | $4,500 | $3.12 | 23d | 1 | 1.00mi |
| 2007 W Mistletoe Ave San Antonio, TX | 2.0 | 1.0 | 1224 | $1,650 | $1.35 | 43d | 1 | 1.02mi |
| 520 Cincinnati Ave San Antonio, TX | 3.0 | 2.0 | 1216 | $2,000 | $1.64 | 43d | 1 | 1.04mi |
| 1644 W Mistletoe Ave Unit 201 San Antonio, TX | 2.0 | 2.0 | 831 | $1,700 | $2.05 | 43d | 1 | 1.04mi |
| 1524 W Woodlawn Ave San Antonio, TX | 2.0 | 1.0 | 1200 | $795 | $0.66 | 23d | 1 | 1.06mi |
| 1914 W Magnolia Ave San Antonio, TX | 2.0 | 1.0 | 1316 | $1,850 | $1.41 | 23d | 1 | 1.06mi |
| 2607 W Craig Pl San Antonio, TX | 3.0 | 1.0 | 1312 | $1,475 | $1.12 | 23d | 1 | 1.06mi |
| 542 Rivas St Unit B San Antonio, TX | 3.0 | 2.0 | 876 | $999 | $1.14 | 4d | 1 | 1.06mi |
| 2425 Monterey St San Antonio, TX | 3.0 | 2.0 | 1416 | $2,000 | $1.41 | 43d | 1 | 1.07mi |
| 2718 W Craig Pl San Antonio, TX | 2.0 | 1.0 | 1004 | $1,350 | $1.34 | 12d | 1 | 1.14mi |
| 2718 W Craig Pl San Antonio, TX | 2.0 | 1.0 | 1004 | $1,350 | $1.34 | 10d | 1 | 1.14mi |
| 1409 W Woodlawn Ave #4 San Antonio, TX | 2.0 | 1.0 | 900 | $795 | $0.88 | 21d | 1 | 1.18mi |
| 1409 W Woodlawn Ave #4 San Antonio, TX | 2.0 | 1.0 | 900 | $795 | $0.88 | 43d | 1 | 1.18mi |
| 2148 Texas Ave San Antonio, TX | 3.0 | 1.0 | 1131 | $1,375 | $1.22 | 23d | 1 | 1.19mi |
| 2120 Monterey St Unit 102 San Antonio, TX | 2.0 | 2.0 | 1220 | $1,490 | $1.22 | 43d | 1 | 1.20mi |
| 2120 Monterey St Unit 102 San Antonio, TX | 2.0 | 2.0 | 1220 | $1,450 | $1.19 | 11d | 1 | 1.20mi |
| 2530 W Woodlawn Ave San Antonio, TX | 3.0 | 2.0 | 1416 | $2,195 | $1.55 | 43d | 1 | 1.21mi |
| 214 Aztec St San Antonio, TX | 3.0 | 2.0 | 973 | $1,275 | $1.31 | 14d | 1 | 1.22mi |
| 1311 W French Pl San Antonio, TX | 3.0 | 2.0 | 1400 | $2,500 | $1.79 | 23d | 1 | 1.26mi |
| 1630 W Mulberry Ave San Antonio, TX | 2.0 | 1.0 | 1100 | $1,400 | $1.27 | 43d | 1 | 1.26mi |
| 232 Cornell Ave #2 San Antonio, TX | 2.0 | 1.0 | 924 | $1,050 | $1.14 | 16d | 1 | 1.27mi |
| 1820 W Houston St San Antonio, TX | 3.0 | 2.0 | 1132 | $2,300 | $2.03 | 43d | 1 | 1.32mi |
Listing history 29 events
-
2026-06-18days on market $120,000 Active 25 DOM
-
2026-06-17days on market $120,000 Active 24 DOM
-
2026-06-16days on market $120,000 Active 23 DOM
-
2026-06-15days on market $120,000 Active 22 DOM
-
2026-06-13days on market $120,000 Active 20 DOM
-
2026-06-09days on market $120,000 Active 16 DOM
-
2026-06-08days on market $120,000 Active 15 DOM
-
2026-06-07days on market $120,000 Active 14 DOM
-
2026-06-04statusdays on market $120,000 Active 11 DOM
-
2026-06-03days on market $120,000 New 10 DOM
-
2026-06-02days on market $120,000 New 9 DOM
-
2026-06-01days on market $120,000 New 8 DOM
-
2026-05-31days on market $120,000 New 7 DOM
-
2026-05-24$120,000 New
-
2019-08-02soldstatus
-
2019-07-22soldstatus Sold 150-char remark
Show marketing remark (150 chars)
Not willing to put more money into this property, selling as is. Current tenant pays 800 per month - on month to month can move with 30 days notice.
-
2019-07-11$55,000 New 150-char remark
Show marketing remark (150 chars)
Not willing to put more money into this property, selling as is. Current tenant pays 800 per month - on month to month can move with 30 days notice.
-
2016-03-30soldstatus
-
2016-03-29soldstatus Sold 512-char remark
Show marketing remark (512 chars)
GREAT INVESTMENT PROPERTY IN GREAT LOCATION. JUST MINUTES FROM ST. MARY'S UNIVERSITY ,AROUND THE CORNER FROM CULEBRA AVE. WITH EASY ACCESS TO IH-10, I35 & DOWNTOWN. THIS HOUSE HAS RECENTLY BEEN RENTED AS A SEC.8 HOUSE WITH POTENTIAL $900.00/MONTH RENTAL INCOME. LOCATED DIRECTLY ON CITY BUS LINE. INSIDE THE HOUSE ARE WOOD FLOORS, HIGH CEILINGS, AND INDOOR LAUNDRY AREA. FRESH COAT OF PAINT. 3 A/C WINDOW UNITS/STOVE/REFRI CONVEY OR APPLIANCE ALLOWANCE IS NEGOTIABLE! BRING YOUR BUYERS OR INVESTORS TO SEE.
-
2016-03-21historical Active Option 512-char remark
Show marketing remark (512 chars)
GREAT INVESTMENT PROPERTY IN GREAT LOCATION. JUST MINUTES FROM ST. MARY'S UNIVERSITY ,AROUND THE CORNER FROM CULEBRA AVE. WITH EASY ACCESS TO IH-10, I35 & DOWNTOWN. THIS HOUSE HAS RECENTLY BEEN RENTED AS A SEC.8 HOUSE WITH POTENTIAL $900.00/MONTH RENTAL INCOME. LOCATED DIRECTLY ON CITY BUS LINE. INSIDE THE HOUSE ARE WOOD FLOORS, HIGH CEILINGS, AND INDOOR LAUNDRY AREA. FRESH COAT OF PAINT. 3 A/C WINDOW UNITS/STOVE/REFRI CONVEY OR APPLIANCE ALLOWANCE IS NEGOTIABLE! BRING YOUR BUYERS OR INVESTORS TO SEE.
-
2016-02-16price $49,900 512-char remark
Show marketing remark (512 chars)
GREAT INVESTMENT PROPERTY IN GREAT LOCATION. JUST MINUTES FROM ST. MARY'S UNIVERSITY ,AROUND THE CORNER FROM CULEBRA AVE. WITH EASY ACCESS TO IH-10, I35 & DOWNTOWN. THIS HOUSE HAS RECENTLY BEEN RENTED AS A SEC.8 HOUSE WITH POTENTIAL $900.00/MONTH RENTAL INCOME. LOCATED DIRECTLY ON CITY BUS LINE. INSIDE THE HOUSE ARE WOOD FLOORS, HIGH CEILINGS, AND INDOOR LAUNDRY AREA. FRESH COAT OF PAINT. 3 A/C WINDOW UNITS/STOVE/REFRI CONVEY OR APPLIANCE ALLOWANCE IS NEGOTIABLE! BRING YOUR BUYERS OR INVESTORS TO SEE.
-
2016-01-28$52,900 New 512-char remark
Show marketing remark (512 chars)
GREAT INVESTMENT PROPERTY IN GREAT LOCATION. JUST MINUTES FROM ST. MARY'S UNIVERSITY ,AROUND THE CORNER FROM CULEBRA AVE. WITH EASY ACCESS TO IH-10, I35 & DOWNTOWN. THIS HOUSE HAS RECENTLY BEEN RENTED AS A SEC.8 HOUSE WITH POTENTIAL $900.00/MONTH RENTAL INCOME. LOCATED DIRECTLY ON CITY BUS LINE. INSIDE THE HOUSE ARE WOOD FLOORS, HIGH CEILINGS, AND INDOOR LAUNDRY AREA. FRESH COAT OF PAINT. 3 A/C WINDOW UNITS/STOVE/REFRI CONVEY OR APPLIANCE ALLOWANCE IS NEGOTIABLE! BRING YOUR BUYERS OR INVESTORS TO SEE.
-
2015-12-01soldstatus
-
2015-11-25soldstatus Sold
-
2015-11-11historical Active Option
-
2015-11-10$44,900 New
-
2011-10-13soldstatus
-
2011-09-28historical
-
2009-10-27$29,900
ⓘ Source: listings_history table (triggers on properties + properties_extension) + one-shot
backfill from property_details.listing_events for pre-trigger history.
Tax reassessment forecast TX · Resets to sale price
- Current annual tax
- $2,142 · $178/mo
- Projected year-2 tax
- $2,196 · $183/mo
- Expected delta
- +$54/yr (+$5/mo · 2.5%)
ⓘ Screening estimate from a state-policy table — verify with the county assessor before closing.
Climate risk First Street
- Flood 1/10 Low FEMA zone X (unshaded) · 0% chance over 30 yrs
- Wildfire 1/10 Low
- Heat 8/10 Severe 7 d/yr ≥109°F today · 22 d/yr by 30 yrs out
- Wind 6/10 Major 77% chance of damaging wind over 30 yrs
- Air quality 2/10 Low 1 unhealthy d/yr today · 2 by 30 yrs out
Nearby sold comps map
Loading sold comps map…
Walkable amenities ~0.75 mi
Loading nearby amenities…
Taxation est. · year 1
- Rental income
- $17,354
- − Mortgage interest
- −$6,722
- − Property taxes
- −$2,142
- − Insurance
- −$600
- − Repairs & maintenance
- −$1,388
- − Management
- −$1,388
- − Depreciation
- −$3,491
- Taxable income
- $1,623
- Est. tax owed @ 24.0%
- −$390
- After-tax cash flow
- $3,027/yr
For passive investors: Depreciation is non-cash, so a rental often shows a tax loss while cash-flowing — sheltering income. Rental losses are passive: they offset passive income freely, and up to $25,000/yr can offset ordinary (W-2) income if you actively participate and your MAGI is under $100k (phasing out to $0 by $150k); unused losses carry forward. On sale, claimed depreciation is recaptured at up to 25%, and gains may owe capital-gains tax (a 1031 exchange can defer both). Figures are a year-1 estimate at your 24.0% rate — not tax advice; consult a CPA.
Schools (NCES district)
- District
- San Antonio ISD
- NCES district ID
- 4838730
- Math proficiency
- 12% ▼ -21.00%
- Reading proficiency
- 22% ▼ -7.00%
- Median HH income
- $30,952
- Composite
- 13.57/100
- National rank
- #9512
- State rank
- #805 of 826 in TX
Livability — San Antonio
- Score
- 80/100
- State rank
- #31
- US rank
- #1616
Category grades
Schools grade is shown separately in the Schools card above.
Census & demographics
- Census place
- San Antonio, TX
- County
- Bexar County · 1,990,555 people
- City population
- 1,806,925
- Metro
- San Antonio-New Braunfels, TX
- Population (ZIP)
- 55,474
- Household income
- $32,472
- Rent vs Own
- Severe rent burden
- 2789.0
Population outlook (Bexar County) Hauer SSP2
- Today (2025)
- 2,336,851 people
- By 2030
- 2,560,728 · +9.6%
- By 2040
- 3,020,569 · +29.3%
- By 2050
- 3,493,522 · +49.5%
- By 2075
- 4,668,459 · +99.8%
- By 2100
- 5,533,242 · +136.8%
Race, ethnicity, and origin ACS 2023
- Neighborhood character
- Predominantly Hispanic (88%)
- Race & ethnicity
- Hispanic / Latino 88% Two or more races 41% White 6% Black 5% Native American 2%
- Hispanic origin (detail)
- Mexican 79%
- Foreign-born
- 19% · Canada
- Languages at home
- 39% English-only · Spanish 60%
Political lean MEDSL · Bexar
- 2024 margin
- Lean D (+9.8) · D 54.3% · R 44.6% · Other 1.1%
- 2008→2024 swing
- +4.2pp toward D · 2008: 5.6pp · 2024: 9.8pp
- All cycles
- 2024: D+9.8 2020: D+18.2 2016: D+13.5 2012: D+4.6 2008: D+5.6
Not yet ingested
- Civics
- —
Market trends
- HPI YoY
- ▲ 34.92%
- Current HPI
- 264.7559
- Rent YoY
- ▲ 7.73%
- Metro
- San Antonio-New Braunfels, TX
- State GDP YoY
- ▲ 3.95%
- F500 in state
- 110
Industry mix (Fortune 500 HQ in TX)
| Industry | F500 HQs | Revenue |
|---|---|---|
| Energy | 16 | $1,198B |
|
||
| Technology | 5 | $198B |
|
||
| Engineering / Construction | 4 | $72B |
|
||
| Energy Services | 3 | $60B |
|
||
| Utilities | 3 | $41B |
|
||
| Healthcare | 2 | $330B |
|
||
Price history
+301.3% since first listed16 events — show timeline
- 2026-05-24 Listed $120,000 LERA
- 2019-08-02 Sold (Public Records) — Public Records
- 2019-07-22 Sold (MLS) — LERA
- 2019-07-11 Listed $55,000 LERA
- 2016-03-30 Sold (Public Records) — Public Records
- 2016-03-29 Sold (MLS) — LERA
- 2016-03-21 Contingent — LERA
- 2016-02-16 Price Changed $49,900 LERA
- 2016-01-28 Listed $52,900 LERA
- 2015-12-01 Sold (Public Records) — Public Records
- 2015-11-25 Sold (MLS) — LERA
- 2015-11-11 Contingent — LERA
- 2015-11-10 Listed $44,900 LERA
- 2011-10-13 Sold (MLS) — LERA
- 2011-09-28 Listing Removed — LERA
- 2009-10-27 Listed $29,900 LERA
Property tax history
+5.3%/yrLatest (2025): $2,142 · -7.1% YoY. Source: county tax records.
Cash-flow waterfall
monthlySold comps — $/sqft
last 12 mo · ≤1 miLoading sold comps…