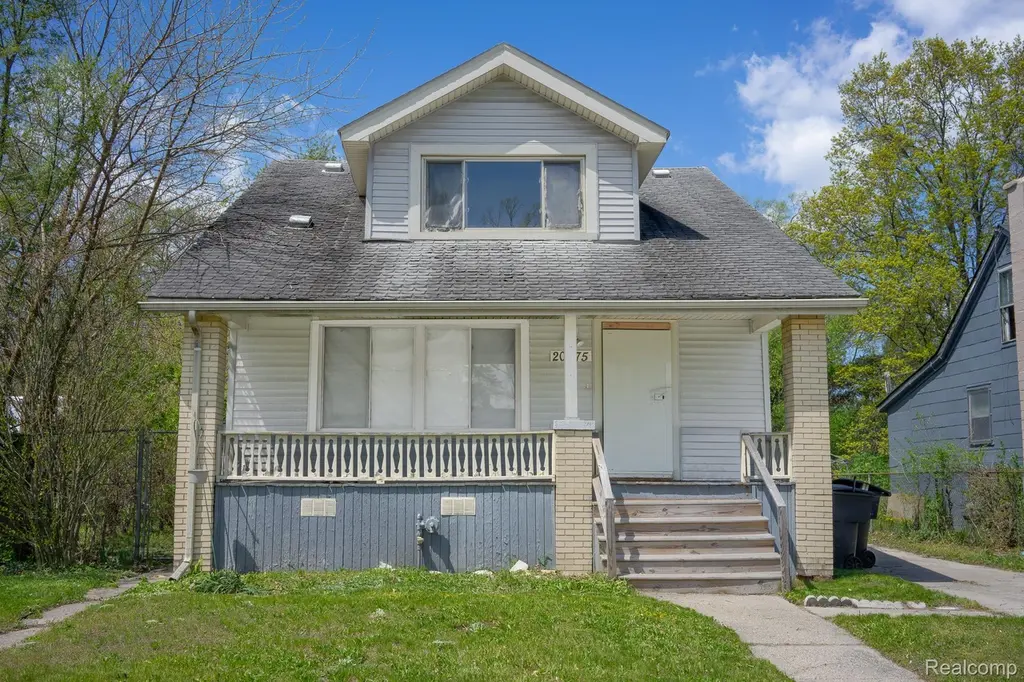
20475 San Juan Dr · Detroit, MI
Flood risk 1/10 · Minimal
- FEMA flood zone
- X (unshaded)
- Chance of flooding over 30 yrs
- 0.0%
- Est. flood insurance / yr
- $473 – $860
Fire risk 1/10 · Minimal
- Est. fire insurance / yr
- $784 – $1,456
Heat risk 3/10 · Minor
- Hot days now (above 97°F)
- 7 days/yr
- Hot days in 30 yrs
- 15 days/yr
Wind risk 2/10 · Minimal
- Chance of severe wind over 30 yrs
- —
Air-quality risk 4/10 · Minor
- Unhealthy air days now
- 4 days/yr
- Unhealthy air days in 30 yrs
- 6 days/yr
Risk factors via First Street. Map © Google.
Why this score? — see what drove the B- grade
The composite is a weighted blend of 9 inputs, each scored 0–100. Each bar is that input's sub-score; the figure is the points it added to the 100-point composite (weight × sub-score).
- Cash flow +30.0/30.0
- 1% rule +10.0/10.0
- DSCR +10.0/10.0
- ARV discount +7.5/15.0
- Livability +3.7/5.0
- Rent growth +3.4/5.0
- Condition / age +2.5/5.0
- Schools +1.3/10.0
- Appreciation +0.0/10.0
$89,900
🖨 Deal sheet 📄 Offer letter ✓ Due diligence
Listing remarks MLS
Opportunity awaits with this duplex full of potential and ready for your vision and finishing touches. Whether you're an investor looking to add to your portfolio or an owner-occupant seeking an income-producing opportunity, this property offers flexibility and endless possibilities. Conveniently located near major highways, schools, parks, shopping, and local amenities, the location provides easy access to everything the city has to offer. Bring your ideas and unlock the potential this duplex has to offer. Schedule your private showing today! Purchaser to pay 395 processing fee. As-is sale. SELLER FINANCING / LAND CONTRACT TERMS AVAILABLE AT 95,000 PURCHASE PRICE, 35,000 DOWN PAYMENT, 8% INTEREST, 96 MONTH TERM. 919 / MONTH. seller financing/land contract terms are negotiable.
Key facts
- 9,583 sq ft lot
- Built 1929
- Listed 31 days
Property features AI
Finance
- Other: No pets allowed
- Financial info: Residential income / multi-family property
- HOA & community:
Exterior
- Parking:
- Security:
- Utilities: Public water; Public sewer
- Home design: Multi-family residential property; Two stories; Located in the Garden Homes subdivision; south of 8 Mile and west of Livernois
- Construction: Vinyl siding; Block foundation
- Exterior features: Asphalt roof; Paved road access; Lot approximately 0.22 acres (50 x 194)
Interior
- Kitchen:
- Bedrooms: 2-bedroom unit (one unit listed)
- Flooring:
- Bathrooms: 2 full bathrooms; 1 half bathroom; Each unit includes 1 bathroom (where specified)
- Heating & cooling: Forced air heating; Natural gas heating; No central cooling
- Interior features: Unfinished basement
- Laundry & utility:
Neighborhood map
What this means for you Summary
Snapshot
- This is a 4-bed/1.0-bath single-family listed at $90k.
Deal economics
- At list price, monthly cash flow is $688 ($8k/yr) — positive.
- The deal already cash-flows at list — no discount required.
- Meets the 1% rule at list price ($2k rent vs $90k).
- Recommended offer: $87k (3.0% below list) — sets the bar for market timing.
- Cap rate 15.5% vs local median 10.2% in Detroit — top-decile yield for the area; either an underpriced asset or a hidden risk that comps aren't pricing in. Stress-test before assuming the spread holds.
Location & tenants
- Location reads 73/100 on livability (#218 in MI) — a middle-class / working-renter tenant base. Strengths: amenities A+, commute A+, cost of living A+; Watch: schools F, crime F, employment F.
- Detroit Public Schools Community District (urban): math 10% / reading 24% proficiency, ranked #499 of 540 in MI (top 92%) — low school quality limits family demand, transient renter base, plan for 1-2y turnover; 90% free/reduced lunch — lower-income household profile, screen leases tightly.
- Market conditions: Rents rising (+3.4%/yr); 349 active listings in the ZIP; 18 comparable units currently listed for rent nearby; rentals at typical pace (median 21d on market — plan ~3-4 weeks tenant-placement turnaround); 2,639 units permitted in Wayne County in 2024 (1,216 in 5+ unit buildings).
- This rent runs 35% of the median local income ($58k/yr) — at the standard rent-burdened threshold; future hikes will face affordability resistance.
Forward outlook
- Local home prices are declining (-3.0%/yr); year-one equity from $622 of loan paydown is wiped out by about $3k of value loss. Plan a longer hold.
- Wayne County population projected at -17% by 2050 — secular population decline; favor cash flow + early exit over multi-decade hold.
- At projected returns (-3.0% appreciation + 3.4% rent growth), your $25k cash investment doubles in ~4 years — after that, you're playing with house money.
Negotiation context
- It's been on market 31 days — a 3% lower offer ($87k) is reasonable based on typical stale-listing flexibility.
- 2 sale attempts with the ask held roughly flat each time — persistent listings suggest the price (not the market) is what's stuck; bring a comps-based counter.
Risks & watch-outs
- Watch-outs: built in 1929 — expect roof / HVAC / electrical / plumbing capex.
Questions for the listing agent
- It's been on market 31 days. Have you received any prior offers? Is the seller open to a 3% concession, seller financing, or rate buy-down credit?
- Built in 1929 — when were the roof, HVAC, electrical panel, plumbing, and water heater last replaced?
- Is there a deadline driving the sale (1031 exchange, divorce, estate, relocation)? That informs how much negotiation room exists.
- Schools are F-rated, which usually means shorter tenancies and higher turnover. Who's the typical renter profile here, and what's been the actual vacancy rate?
- Crime grade is F in this area — have there been break-ins, vandalism, or insurance claims at this property in the last 3 years? What carrier currently insures it and at what premium?
- What's the average days-on-market for RENTAL listings here right now (not sales)? A rising rental-DOM trend means longer vacancies and softer asking-rent achievability than the comps imply.
- What's the recent tenant-quality profile in this submarket — average credit score on applications, eviction rate, late-payment / NSF rate, and stable-employment percentage? A property-management company in the area should have these aggregated.
- How much new for-sale + rental construction is in the pipeline within 1–3 miles? Heavy new supply typically softens prices + rents 12–24 months out; constrained supply supports both.
Investment metrics
- 1% rule
- 1.87% ✓
- Cap rate
- 15.48%
- Cash-on-cash
- 32.82%
- DSCR
- 2.46
- GRM
- 4.5
CMA / ARV
- ARV (on-the-fly)
- $204,408
- Comps found
- 12
Show comp detail 12 sales within ~0.75 mi
| Address | Dist | Beds/Ba | Sqft | Sold | Price | $/sf | Match |
|---|---|---|---|---|---|---|---|
| 410 Stratford Rd | 0.36mi | 3/1.5 (-1) | 1,302 (-2%) | 1mo | $360,000 | $276 | 71 |
| 20441 Gardendale St | 0.46mi | 4/1.5 | 1,400 (+5%) | 1mo | $130,000 | $93 | 68 |
| 207 Farmdale St | 0.37mi | 4/1.0 | 1,244 (-7%) | 6mo | $190,000 | $153 | 66 |
| 230 Allen St | 0.58mi | 3/1.0 (-1) | 1,249 (-6%) | 0mo | $252,000 | $202 | 57 |
| 19940 Prairie St | 0.38mi | 3/1.0 (-1) | 1,165 (-13%) | 2mo | $140,000 | $120 | 55 |
| 19489 San Juan Dr | 0.56mi | 3/1.0 (-1) | 1,200 (-10%) | 1mo | $110,000 | $92 | 51 |
| 20885 Westview Ave | 0.53mi | 3/2.0 (-1) | 1,451 (+9%) | 4mo | $198,000 | $136 | 49 |
| 768 Pinecrest Dr | 0.54mi | 3/2.0 (-1) | 1,440 (+8%) | 5mo | $333,000 | $231 | 49 |
| 19372 Santa Barbara Dr | 0.71mi | 3/1.5 (-1) | 1,421 (+6%) | 2mo | $218,500 | $154 | 48 |
| 3127 W 8 Mile Rd | 0.73mi | 3/2.0 (-1) | 1,274 (-5%) | 3mo | $113,000 | $89 | 47 |
| 718 Meadowdale St | 0.71mi | 3/1.0 (-1) | 1,200 (-10%) | 2mo | $290,000 | $242 | 43 |
| 21304 Glen Lodge Rd | 0.73mi | 5/1.5 (+1) | 1,166 (-13%) | 7mo | $122,555 | $105 | 32 |
Match score weights: distance 35% · size 25% · config 20% · recency 20%. Top-matched comps best support the ARV.
Projected returns pro-forma
-3.0% appreciation · 3.44% rent growth · sell at horizon
- IRR
- 28.5%
- Equity multiple
- 2.19×
- Total profit
- $30,064
- Equity at exit
- $13,404
- IRR
- 36.2%
- Equity multiple
- 4.41×
- Total profit
- $85,877
- Equity at exit
- $7,773
Cash invested: $25,172 (down + closing). Projections, not guarantees.
Landlord ↔ Tenant lean methodology
- Overall (STATE)
- 62 Landlord-Friendly
- State Michigan
- 62 Landlord-Friendly · EVEN
- County
- — inherits STATE
- City
- — inherits STATE
ZIP-level market 48221
- Rents YoY
- 3.4%
- Active inventory
- 349
- Price-to-rent
- 4.5×
Monthly cashflow live
- Estimated rent
- $1,679 high interval (Pro) →
- Mortgage (P&I)
- −$471
- Tax from tax record
- −$129 /mo · $1,547/yr
- Insurance
- −$37
- HOA
- −$0
- Vacancy / Maint / Mgmt
- −$353
- Net cashflow
- $688
Break-even live
UW: 25.0% down · 7.5% · 30yr · 1.5% tax · 5.0% vac · 8.0% maint · 8.0% mgmt
Financing live
Cash to close
- Down payment
- $22,475
- Closing costs
- $2,697
- Reserves months
- —
- Total cash needed
- —
Loan-product check · same deal, 3 products live
Conventional
25% down · 7.5% · 30yr
- Down + closing
- —
- Monthly P&I
- —
- Monthly cashflow
- —
- DSCR
- —
- Eligible?
- —
Personal DTI + credit; lowest rate.
DSCR
20% down · 8.5% · 30yr
- Down + closing
- —
- Monthly P&I
- —
- Monthly cashflow
- —
- DSCR
- —
- Eligible?
- —
No personal income docs; deal must DSCR.
Hard money
10% down · 12.0% · 12mo
- Down + closing
- —
- Monthly P&I
- —
- Monthly cashflow
- —
- DSCR
- —
- Eligible?
- —
Short-term bridge; refi at stabilization.
Rent comps 18 comps
| Address | Beds | Baths | Sqft | Rent | $/sqft | DOM | Units | Dist |
|---|---|---|---|---|---|---|---|---|
| 20038 Santa Rosa Dr Detroit, MI | 3.0 | 1.0 | 927 | $1,300 | $1.40 | 17d | 1 | 0.36mi |
| 20045 Greenlawn St Detroit, MI | 3.0 | 1.0 | 925 | $1,350 | $1.46 | 44d | 1 | 0.37mi |
| 631 Shasta Pl Ferndale, MI | 3.0 | 2.0 | 1317 | $2,100 | $1.59 | 44d | 1 | 0.41mi |
| 20110 Northlawn St Detroit, MI | 3.0 | 1.0 | 1100 | $1,350 | $1.23 | 17d | 1 | 0.42mi |
| 19986 Cherrylawn St Detroit, MI | 4.0 | 1.5 | 1144 | $1,700 | $1.49 | 17d | 1 | 0.52mi |
| 20458 Indiana St Detroit, MI | 3.0 | 1.0 | 1049 | $1,300 | $1.24 | 18d | 1 | 0.57mi |
| 20009 Wisconsin St Detroit, MI | 3.0 | 1.5 | 1051 | $1,400 | $1.33 | 17d | 1 | 0.62mi |
| 20445 Kentucky St Detroit, MI | 3.0 | 1.0 | 1046 | $1,200 | $1.15 | 24d | 1 | 0.65mi |
| 20515 Ilene St Detroit, MI | 3.0 | 1.0 | 891 | $1,450 | $1.63 | 44d | 1 | 0.81mi |
| 1557 Leroy St Ferndale, MI | 3.0 | 2.0 | 1380 | $2,523 | $1.83 | 5d | 1 | 0.84mi |
| 351 Edgewood Pl Unit 2 Ferndale, MI | 3.0 | 2.0 | 1600 | $2,200 | $1.38 | 18d | 1 | 0.86mi |
| 21374 Ithaca Ave Ferndale, MI | 3.0 | 1.0 | 996 | $1,775 | $1.78 | 24d | 1 | 0.88mi |
| 20032 Monte Vista St Detroit, MI | 3.0 | 1.0 | 1000 | $1,294 | $1.29 | 20d | 1 | 1.10mi |
| 20122 Manor St Detroit, MI | 3.0 | 1.0 | 1028 | $1,200 | $1.17 | 44d | 1 | 1.14mi |
| 20245 Manor Detroit, MI | 3.0 | 1.0 | 1018 | $1,400 | $1.38 | 3d | 1 | 1.15mi |
| 18935 Indiana St Detroit, MI | 3.0 | 1.0 | 1248 | $1,523 | $1.22 | 5d | 1 | 1.17mi |
| 22811 Rosewood St Oak Park, MI | 3.0 | 1.0 | 1000 | $1,600 | $1.60 | 24d | 1 | 1.19mi |
| 320 E Troy St Ferndale, MI | 4.0 | 2.0 | 1627 | $2,200 | $1.35 | 44d | 1 | 1.35mi |
Listing history 15 events
-
2026-06-18days on market $89,900 Active 31 DOM
-
2026-06-17days on market $89,900 Active 30 DOM
-
2026-06-15days on market $89,900 Active 28 DOM
-
2026-06-13days on market $89,900 Active 26 DOM
-
2026-06-13days on market $89,900 Active 25 DOM
-
2026-06-09days on market $89,900 Active 22 DOM
-
2026-06-08days on market $89,900 Active 21 DOM
-
2026-06-07days on market $89,900 Active 20 DOM
-
2026-06-04days on market $89,900 Active 17 DOM
-
2026-06-03days on market $89,900 Active 16 DOM
-
2026-06-02days on market $89,900 Active 15 DOM
-
2026-06-01days on market $89,900 Active 14 DOM
-
2026-05-31days on market $89,900 Active 13 DOM
-
2026-05-18$89,900 Active
Show marketing remark (788 chars)
Opportunity awaits with this duplex full of potential and ready for your vision and finishing touches. Whether you're an investor looking to add to your portfolio or an owner-occupant seeking an income-producing opportunity, this property offers flexibility and endless possibilities. Conveniently located near major highways, schools, parks, shopping, and local amenities, the location provides easy access to everything the city has to offer. Bring your ideas and unlock the potential this duplex has to offer. Schedule your private showing today! Purchaser to pay 395 processing fee. As-is sale. SELLER FINANCING / LAND CONTRACT TERMS AVAILABLE AT 95,000 PURCHASE PRICE, 35,000 DOWN PAYMENT, 8% INTEREST, 96 MONTH TERM. 919 / MONTH. seller financing/land contract terms are negotiable.
-
2026-05-18$89,900 Active 788-char remark
Show marketing remark (788 chars)
Opportunity awaits with this duplex full of potential and ready for your vision and finishing touches. Whether you're an investor looking to add to your portfolio or an owner-occupant seeking an income-producing opportunity, this property offers flexibility and endless possibilities. Conveniently located near major highways, schools, parks, shopping, and local amenities, the location provides easy access to everything the city has to offer. Bring your ideas and unlock the potential this duplex has to offer. Schedule your private showing today! Purchaser to pay 395 processing fee. As-is sale. SELLER FINANCING / LAND CONTRACT TERMS AVAILABLE AT 95,000 PURCHASE PRICE, 35,000 DOWN PAYMENT, 8% INTEREST, 96 MONTH TERM. 919 / MONTH. seller financing/land contract terms are negotiable.
ⓘ Source: listings_history table (triggers on properties + properties_extension) + one-shot
backfill from property_details.listing_events for pre-trigger history.
Tax reassessment forecast MI · Partial reset (capped growth)
- Current annual tax
- $1,547 · $129/mo
- Projected year-2 tax
- $1,547 · $129/mo
- Expected delta
- $0/yr ($0/mo · 0.0%)
ⓘ Screening estimate from a state-policy table — verify with the county assessor before closing.
Climate risk First Street
- Flood 1/10 Low FEMA zone X (unshaded) · 0% chance over 30 yrs
- Wildfire 1/10 Low
- Heat 3/10 Moderate 7 d/yr ≥97°F today · 15 d/yr by 30 yrs out
- Wind 2/10 Low
- Air quality 4/10 Moderate 4 unhealthy d/yr today · 6 by 30 yrs out
Nearby sold comps map
Loading sold comps map…
Walkable amenities ~0.75 mi
Loading nearby amenities…
Taxation est. · year 1
- Rental income
- $20,146
- − Mortgage interest
- −$5,036
- − Property taxes
- −$1,547
- − Insurance
- −$450
- − Repairs & maintenance
- −$1,612
- − Management
- −$1,612
- − Depreciation
- −$2,615
- Taxable income
- $7,275
- Est. tax owed @ 24.0%
- −$1,746
- After-tax cash flow
- $6,516/yr
For passive investors: Depreciation is non-cash, so a rental often shows a tax loss while cash-flowing — sheltering income. Rental losses are passive: they offset passive income freely, and up to $25,000/yr can offset ordinary (W-2) income if you actively participate and your MAGI is under $100k (phasing out to $0 by $150k); unused losses carry forward. On sale, claimed depreciation is recaptured at up to 25%, and gains may owe capital-gains tax (a 1031 exchange can defer both). Figures are a year-1 estimate at your 24.0% rate — not tax advice; consult a CPA.
Schools (NCES district)
- District
- Detroit Public Schools Community District
- NCES district ID
- 2601103
- Math proficiency
- 10% ▼ -2.00%
- Reading proficiency
- 24% ▲ 6.00%
- Median HH income
- $25,815
- Composite
- 13.06/100
- National rank
- #9564
- State rank
- #499 of 540 in MI
Livability — Detroit
- Score
- 73/100
- State rank
- #218
- US rank
- #5427
Category grades
Schools grade is shown separately in the Schools card above.
Census & demographics
- Census place
- Detroit, MI
- County
- Wayne County · 1,562,939 people
- City population
- 572,865
- Metro
- Detroit-Warren-Dearborn, MI
- Population (ZIP)
- 41,392
- Household income
- $57,878
- Rent vs Own
- Severe rent burden
- 1646.0
Population outlook (Wayne County) Hauer SSP2
- Today (2025)
- 1,675,273 people
- By 2030
- 1,620,300 · -3.3%
- By 2040
- 1,502,341 · -10.3%
- By 2050
- 1,384,039 · -17.4%
- By 2075
- 1,124,592 · -32.9%
- By 2100
- 881,193 · -47.4%
Race, ethnicity, and origin ACS 2023
- Neighborhood character
- Predominantly Black (85%)
- Race & ethnicity
- Black 85% White 8% Two or more races 4% Asian 1%
- Common ancestry
- Romanian 1% Lithuanian 1%
- Foreign-born
- 2% · Canada
- Languages at home
- 97% English-only · Spanish 1% Other Indo-European 1%
Political lean MEDSL · Wayne
- 2024 margin
- Strong D (+29.0) · D 62.7% · R 33.7% · Other 3.6%
- 2008→2024 swing
- -20.5pp toward R · 2008: 49.5pp · 2024: 29.0pp
- All cycles
- 2024: D+29.0 2020: D+38.1 2016: D+37.3 2012: D+46.9 2008: D+49.5
Not yet ingested
- Civics
- —
Market trends
- HPI YoY
- ▼ -433.14%
- Current HPI
- 280.5434
- Rent YoY
- ▲ 3.44%
- Metro
- Detroit-Warren-Dearborn, MI
- State GDP YoY
- ▲ 1.37%
- F500 in state
- 28
Industry mix (Fortune 500 HQ in MI)
| Industry | F500 HQs | Revenue |
|---|---|---|
| Automotive Parts | 3 | $48B |
|
||
| Automotive | 2 | $372B |
|
||
| Chemicals | 1 | $45B |
|
||
| Automotive Retail | 1 | $29B |
|
||
| Healthcare / Medical Devices | 1 | $23B |
|
||
| Automotive Technology | 1 | $20B |
|
||
Price history
+0.0% since first listed2 events — show timeline
- 2026-05-18 Listed $89,900 REALCOMP
- 2026-05-18 Listed $89,900 MiRealSource-MiMLS
Property tax history
+4.8%/yrLatest (2025): $1,547 · -9.5% YoY. Source: county tax records.
Cash-flow waterfall
monthlySold comps — $/sqft
last 12 mo · ≤1 miLoading sold comps…