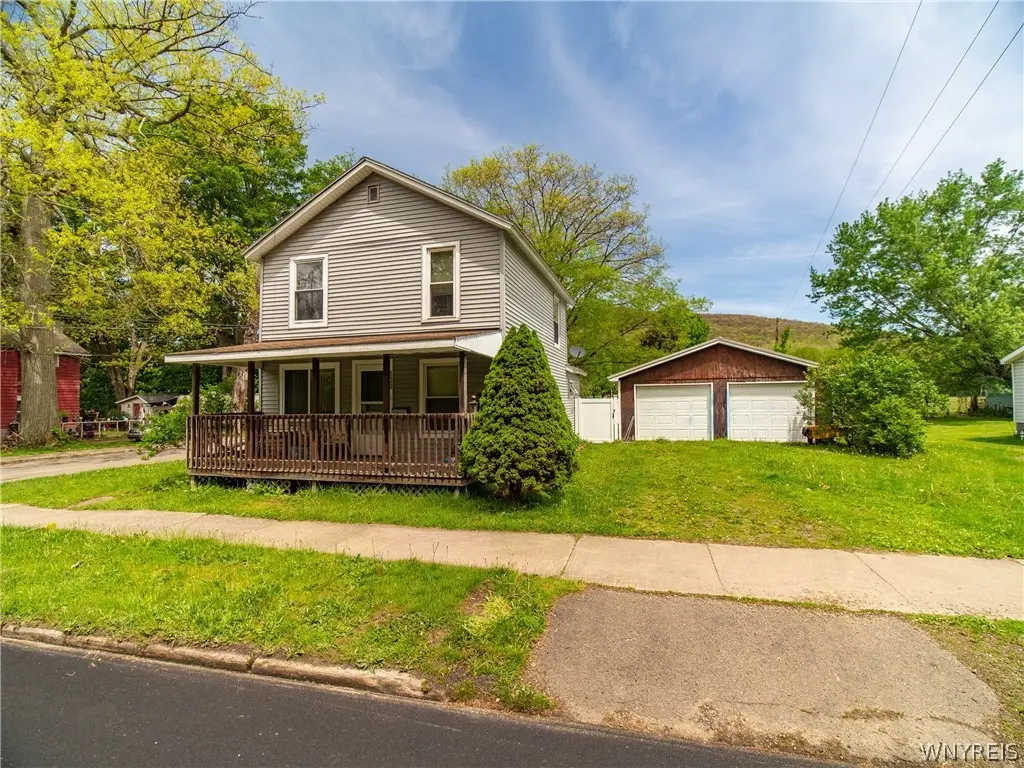
139 Wildwood Ave · Salamanca, NY
Flood risk 1/10 · Minimal
- FEMA flood zone
- X
- Chance of flooding over 30 yrs
- 0.0%
- Est. flood insurance / yr
- $473 – $860
Fire risk 2/10 · Minimal
- Est. fire insurance / yr
- $691 – $1,283
Heat risk 2/10 · Minimal
- Hot days now (above 90°F)
- 8 days/yr
- Hot days in 30 yrs
- 19 days/yr
Wind risk 1/10 · Minimal
- Chance of severe wind over 30 yrs
- —
Air-quality risk 1/10 · Minimal
- Unhealthy air days now
- 0 days/yr
- Unhealthy air days in 30 yrs
- 0 days/yr
Risk factors via First Street. Map © Google.
Why this score? — see what drove the A- grade
The composite is a weighted blend of 9 inputs, each scored 0–100. Each bar is that input's sub-score; the figure is the points it added to the 100-point composite (weight × sub-score).
- Cash flow +30.0/30.0
- ARV discount +11.5/15.0
- 1% rule +10.0/10.0
- DSCR +10.0/10.0
- Appreciation +7.3/10.0
- Livability +3.6/5.0
- Schools +3.0/10.0
- Rent growth +2.5/5.0
- Condition / age +2.5/5.0
$95,000
🖨 Deal sheet (PDF) 📄 Offer letter ✓ Due diligence
Listing remarks
Welcome to 139 Wildwood Ave in Salamanca, NY! This charming and affordable home offers 2 spacious bedrooms, 1.5 bathrooms, and a large eat-in kitchen with plenty of room for cooking, dining, and gathering. The home features generous living space throughout, giving you comfort and flexibility to fit your lifestyle. Located right across from the Allegheny River, you’ll enjoy beautiful nearby scenery and a convenient location close to local amenities. Outside, the detached 2-car garage offers excellent storage and functionality, complete with a newer metal roof. Whether you’re looking for a place to call home or simply searching for a property with space, charm, and affordability,
Key facts
- Large eat-in kitchen
- Newer metal roof
- 6,664 sq ft lot
Tags
Property features AI
Exterior
- Parking: Detached garage; 2-car garage
- Utilities: Public water connected; Sewer connected
- Home design: 2 stories; Existing/resale property
- Construction: Vinyl siding; Block foundation
- Exterior features: Dirt driveway; Gravel driveway; Rectangular residential lot; Road frontage on a city street and main thoroughfare; Lot dimensions approximately 68 x 97
Interior
- Kitchen: Electric range; Electric oven; Refrigerator
- Bedrooms: Total of 7 rooms (includes bedrooms and living spaces)
- Flooring: Carpet; Laminate; Varied flooring
- Bathrooms: 1 full bathroom; 1 half bathroom; Main level bathroom present
- Heating & cooling: Gas forced-air heating
- Interior features: Eat-in kitchen; Full basement
- Laundry & utility: Main-level laundry; Washer; Dryer; Gas water heater
Neighborhood map
What this means for you Summary
Snapshot
- This is a 3-bed/1.0-bath single-family listed at $95k.
Deal economics
- At list price, monthly cash flow is $837 ($10k/yr) — positive.
- The deal already cash-flows at list — no discount required.
- Meets the 1% rule at list price ($2k rent vs $95k).
- Recommended offer: $94k (1.5% below list) — sets the bar for market timing.
Location & tenants
- Location reads 71/100 on livability (#380 in NY) — a middle-class / working-renter tenant base. Strengths: cost of living A+, housing A+, health & safety A+; Watch: schools C-, crime C-, amenities F.
- Salamanca City School District (town): math 29% / reading 43% proficiency, ranked #560 of 590 in NY (top 95%) — families likely to look elsewhere, expect single-tenant / working-renter base with shorter leases.
- Market conditions: 27 active listings in the ZIP; 128 units permitted in Cattaraugus County in 2024 (21 in 5+ unit buildings).
Forward outlook
- In year one you build about $5k of equity ($657 loan paydown + $4k appreciation (4.5% local appreciation)).
- Cattaraugus County population projected at -28% by 2050 — secular population decline; favor cash flow + early exit over multi-decade hold.
- At projected returns (4.5% appreciation + 3.0% rent growth), your $27k cash investment doubles in ~2 years — after that, you're playing with house money.
- By year 7, paydown + projected appreciation supports a ~$32k cash-out refi (75% LTV) — recoverable capital for the next deal without selling this one.
Negotiation context
- It's been on market 29 days — a 2% lower offer ($94k) is reasonable based on typical stale-listing flexibility.
- Current owner paid $14k; list at $95k implies a 579% gain — meaningful room to come down on a strong offer.
Risks & watch-outs
- Watch-outs: built in 1915 — expect roof / HVAC / electrical / plumbing capex.
Questions for the listing agent
- Built in 1915 — when were the roof, HVAC, electrical panel, plumbing, and water heater last replaced?
- Is there a deadline driving the sale (1031 exchange, divorce, estate, relocation)? That informs how much negotiation room exists.
- What's the average days-on-market for RENTAL listings here right now (not sales)? A rising rental-DOM trend means longer vacancies and softer asking-rent achievability than the comps imply.
- What's the recent tenant-quality profile in this submarket — average credit score on applications, eviction rate, late-payment / NSF rate, and stable-employment percentage? A property-management company in the area should have these aggregated.
- How much new for-sale + rental construction is in the pipeline within 1–3 miles? Heavy new supply typically softens prices + rents 12–24 months out; constrained supply supports both.
Investment metrics
- 1% rule
- 1.89% ✓
- Cap rate
- 16.86%
- Cash-on-cash
- 37.75%
- DSCR
- 2.68
- GRM
- 4.4
CMA / ARV
- ARV (on-the-fly)
- $104,222
- Comps found
- 9
Show comp detail 9 sales within ~0.75 mi
| Address | Dist | Beds/Ba | Sqft | Sold | Price | $/sf | Match |
|---|---|---|---|---|---|---|---|
| 24 Jackson Ave | 0.29mi | 3/1.0 | 1,188 (-6%) | 8mo | $122,000 | $103 | 68 |
| 51 Wilson St | 0.33mi | 2/1.0 (-1) | 1,215 (-4%) | 8mo | $40,000 | $33 | 65 |
| 116 Merden St | 0.60mi | 3/1.0 | 1,256 (-1%) | 9mo | $70,000 | $56 | 63 |
| 82 Merden St | 0.58mi | 3/1.0 | 1,218 (-4%) | 5mo | $89,900 | $74 | 62 |
| 60 Cleveland Ave | 0.69mi | 3/1.5 | 1,356 (+7%) | 5mo | $130,000 | $96 | 50 |
| 40 Fawn Ave | 0.56mi | 3/1.0 | 1,200 (-6%) | 18mo | $105,000 | $88 | 49 |
| 36 Baker St | 0.49mi | 2/1.0 (-1) | 1,410 (+11%) | 11mo | $115,000 | $82 | 45 |
| 533 Wildwood Ave | 0.71mi | 3/1.0 | 1,344 (+6%) | 20mo | $85,000 | $63 | 40 |
| 19 Academy St | 0.61mi | 4/1.5 (+1) | 1,164 (-8%) | 22mo | $140,000 | $120 | 32 |
Match score weights: distance 35% · size 25% · config 20% · recency 20%. Top-matched comps best support the ARV.
Projected returns pro-forma
4.52% appreciation · 3.0% rent growth · sell at horizon
- IRR
- 45.6%
- Equity multiple
- 3.73×
- Total profit
- $72,614
- Equity at exit
- $51,111
- IRR
- 43.9%
- Equity multiple
- 7.57×
- Total profit
- $174,699
- Equity at exit
- $86,037
Cash invested: $26,600 (down + closing). Projections, not guarantees.
Landlord ↔ Tenant lean methodology
- Overall (STATE)
- 15 Strongly Tenant-Friendly
- State New York
- 15 Strongly Tenant-Friendly · D+10
- County
- — inherits STATE
- City
- — inherits STATE
ZIP-level market 14779
- Home prices YoY
- 1.4%
- Active inventory
- 27
- Price-to-rent
- 4.4×
Monthly cashflow live
- Estimated rent
- $1,799 medium interval (Pro) →
- Mortgage (P&I)
- −$498
- Tax from tax record
- −$46 /mo · $556/yr
- Insurance
- −$40
- HOA
- −$0
- Vacancy / Maint / Mgmt
- −$378
- Net cashflow
- $837
Break-even live
Sensitivity live
| Price | -10% $891 | -5% $864 | +0% $837 | +5% $810 | +10% $783 |
|---|---|---|---|---|---|
| Rent | -10% $695 | -5% $766 | +0% $837 | +5% $908 | +10% $979 |
| Rate | -1.0pp $885 | -0.5pp $861 | base $837 | +0.5pp $812 | +1.0pp $787 |
UW: 25.0% down · 7.5% · 30yr · 1.5% tax · 5.0% vac · 8.0% maint · 8.0% mgmt
Financing live
Cash to close
- Down payment
- $23,750
- Closing costs
- $2,850
- Reserves months
- —
- Total cash needed
- —
Loan-product check · same deal, 3 products live
Conventional
25% down · 7.5% · 30yr
- Down + closing
- —
- Monthly P&I
- —
- Monthly cashflow
- —
- DSCR
- —
- Eligible?
- —
Personal DTI + credit; lowest rate.
DSCR
20% down · 8.5% · 30yr
- Down + closing
- —
- Monthly P&I
- —
- Monthly cashflow
- —
- DSCR
- —
- Eligible?
- —
No personal income docs; deal must DSCR.
Hard money
10% down · 12.0% · 12mo
- Down + closing
- —
- Monthly P&I
- —
- Monthly cashflow
- —
- DSCR
- —
- Eligible?
- —
Short-term bridge; refi at stabilization.
Listing history 17 events
-
2026-06-21pricedays on market $95,000 Active 29 DOM
-
2026-06-18days on market $100,000 Active 27 DOM
-
2026-06-17days on market $100,000 Active 26 DOM
-
2026-06-16days on market $100,000 Active 25 DOM
-
2026-06-15days on market $100,000 Active 24 DOM
-
2026-06-13days on market $100,000 Active 22 DOM
-
2026-06-12days on market $100,000 Active 21 DOM
-
2026-06-09days on market $100,000 Active 18 DOM
-
2026-06-08days on market $100,000 Active 17 DOM
-
2026-06-07days on market $100,000 Active 16 DOM
-
2026-06-05days on market $100,000 Active 14 DOM
-
2026-06-04days on market $100,000 Active 12 DOM
-
2026-06-02days on market $100,000 Active 11 DOM
-
2026-06-01days on market $100,000 Active 10 DOM
-
2026-05-31days on market $100,000 Active 9 DOM
-
2026-05-22$100,000 Active
-
2000-05-17soldstatus $14,000
ⓘ Source: listings_history table (triggers on properties + properties_extension) + one-shot
backfill from property_details.listing_events for pre-trigger history.
Tax reassessment forecast NY · Partial reset (capped growth)
- Current annual tax
- $556 · $46/mo
- Projected year-2 tax
- $1,081 · $90/mo
- Expected delta
- +$525/yr (+$44/mo · 94.3%)
ⓘ Screening estimate from a state-policy table — verify with the county assessor before closing.
Climate risk First Street
- Flood 1/10 Low FEMA zone X · 0% chance over 30 yrs
- Wildfire 2/10 Low
- Heat 2/10 Low 8 d/yr ≥90°F today · 19 d/yr by 30 yrs out
- Wind 1/10 Low
- Air quality 1/10 Low 0 unhealthy d/yr today · 0 by 30 yrs out
Nearby sold comps map
Loading sold comps map…
Walkable amenities ~0.75 mi
Loading nearby amenities…
Taxation est. · year 1
- Rental income
- $21,584
- − Mortgage interest
- −$5,321
- − Property taxes
- −$556
- − Insurance
- −$475
- − Repairs & maintenance
- −$1,727
- − Management
- −$1,727
- − Depreciation
- −$2,764
- Taxable income
- $9,014
- Est. tax owed @ 24.0%
- −$2,163
- After-tax cash flow
- $7,878/yr
For passive investors: Depreciation is non-cash, so a rental often shows a tax loss while cash-flowing — sheltering income. Rental losses are passive: they offset passive income freely, and up to $25,000/yr can offset ordinary (W-2) income if you actively participate and your MAGI is under $100k (phasing out to $0 by $150k); unused losses carry forward. On sale, claimed depreciation is recaptured at up to 25%, and gains may owe capital-gains tax (a 1031 exchange can defer both). Figures are a year-1 estimate at your 24.0% rate — not tax advice; consult a CPA.
Schools (NCES district)
- District
- Salamanca City School District
- NCES district ID
- 3625440
- Math proficiency
- 29% ▼ -12.00%
- Reading proficiency
- 43% ▲ 5.00%
- Median HH income
- $33,251
- Composite
- 29.52/100
- National rank
- #6500
- State rank
- #560 of 590 in NY
Livability — Salamanca
- Score
- 71/100
- State rank
- #380
- US rank
- #6521
Category grades
Schools grade is shown separately in the Schools card above.
Census & demographics
- Census place
- Salamanca, NY
- Population (ZIP)
- 6,791
Population outlook (Cattaraugus County) Hauer SSP2
- Today (2025)
- 71,623 people
- By 2030
- 67,751 · -5.4%
- By 2040
- 59,488 · -16.9%
- By 2050
- 51,601 · -28.0%
- By 2075
- 35,025 · -51.1%
- By 2100
- 21,243 · -70.3%
Race, ethnicity, and origin ACS 2023
- Neighborhood character
- Predominantly White (68%)
- Race & ethnicity
- White 68% Native American 18% Two or more races 9% Hispanic / Latino 5% Black 2%
- Common ancestry
- Romanian 9% Lithuanian 2% Slovak 1%
- Foreign-born
- 2% · Canada
- Languages at home
- 95% English-only · Spanish 2%
Political lean MEDSL · Cattaraugus
- 2024 margin
- Solid R (+32.8) · D 33.6% · R 66.4%
- 2008→2024 swing
- -22.2pp toward R · 2008: -10.6pp · 2024: -32.8pp
- All cycles
- 2024: R+32.8 2020: R+29.5 2016: R+34.4 2012: R+13.4 2008: R+10.6
Not yet ingested
- Civics
- —
Market trends
- HPI YoY
- ▲ 4.52%
- Current HPI
- 320.5286
- Rent YoY
- —
- Metro
- —
- State GDP YoY
- ▲ 2.60%
- F500 in state
- 92
Industry mix (Fortune 500 HQ in NY)
| Industry | F500 HQs | Revenue |
|---|---|---|
| Financial Services | 10 | $950B |
|
||
| Consumer Goods | 9 | $162B |
|
||
| Insurance | 4 | $225B |
|
||
| Telecommunications | 2 | $144B |
|
||
| Pharmaceuticals | 2 | $112B |
|
||
| Media / Entertainment | 2 | $69B |
|
||
Price history
+614.3% since first listed2 events — show timeline
- 2026-05-22 Listed $100,000 WNYREIS
- 2000-05-17 Sold (Public Records) $14,000 Public Records
Property tax history
-0.5%/yrLatest (2025): $556 · +15.1% YoY. Source: county tax records.
Cash-flow waterfall
monthlySold comps — $/sqft
last 12 mo · ≤1 miLoading sold comps…