15820 S Harlan Rd #5 · Lathrop, CA
Flood risk 5/10 · Moderate
- FEMA flood zone
- X
- Chance of flooding over 30 yrs
- 0.24%
- Est. flood insurance / yr
- $507 – $1,088
Fire risk 4/10 · Minor
- Est. fire insurance / yr
- $659 – $1,223
Heat risk 7/10 · Major
- Hot days now (above 103°F)
- 7 days/yr
- Hot days in 30 yrs
- 14 days/yr
Wind risk 1/10 · Minimal
- Chance of severe wind over 30 yrs
- —
Air-quality risk 10/10 · Severe
- Unhealthy air days now
- 25 days/yr
- Unhealthy air days in 30 yrs
- 25 days/yr
Risk factors via First Street. Map © Google.
Why this score? — see what drove the B grade
The composite is a weighted blend of 9 inputs, each scored 0–100. Each bar is that input's sub-score; the figure is the points it added to the 100-point composite (weight × sub-score).
- Cash flow +30.0/30.0
- ARV discount +11.2/15.0
- 1% rule +10.0/10.0
- DSCR +10.0/10.0
- Condition / age +3.8/5.0
- Rent growth +3.2/5.0
- Schools +2.9/10.0
- Livability +2.8/5.0
- Appreciation +0.0/10.0
$165,000
🖨 Deal sheet 📄 Offer letter ✓ Due diligence
Listing remarks
Welcome to Camino Mobile Home! ALL AGES PARK. Are you a commuter? This home is perfect for you. This charming residence offers 3 bedrooms, 2 full baths, and an open-concept living. Recently updated, it's ready for a loving family to call it home. Enjoy the family-friendly atmosphere with an all- park and a swimming pool!!!
Key facts
- Parking
- Built 1973
- Listed 57 days
Neighborhood map
What this means for you Summary
Snapshot
- This is a 3-bed/2.0-bath manufactured listed at $165k. Condition is rated good.
Deal economics
- At list price, monthly cash flow is $1k ($16k/yr) — positive.
- The deal already cash-flows at list — no discount required.
- Meets the 1% rule at list price ($3k rent vs $165k).
- Recommended offer: $160k (3.0% below list) — sets the bar for market timing.
- Cap rate 16.3% vs local median 3.1% in Lathrop — top-decile yield for the area; either an underpriced asset or a hidden risk that comps aren't pricing in. Stress-test before assuming the spread holds.
Location & tenants
- Location reads 55/100 on livability (#842 in CA) — a working-class tenant base; expect higher turnover. Strengths: employment A+, housing A+; Watch: amenities D, schools F, commute F.
- Manteca Unified (suburban): math 15% / reading 48% proficiency, ranked #297 of 517 in CA (top 57%) — families likely to look elsewhere, expect single-tenant / working-renter base with shorter leases.
- Market conditions: Rents rising (+2.6%/yr); 135 active listings in the ZIP; 7 comparable units currently listed for rent nearby; rentals at typical pace (median 24d on market — plan ~3-4 weeks tenant-placement turnaround); high-income renter base; 3,779 units permitted in San Joaquin County in 2024 (0 in 5+ unit buildings).
- This rent runs 30% of the median local income ($125k/yr) — at the standard rent-burdened threshold; future hikes will face affordability resistance.
Forward outlook
- Local home prices are declining (-3.0%/yr); year-one equity from $1k of loan paydown is wiped out by about $5k of value loss. Plan a longer hold.
- San Joaquin County population projected at +17% by 2050 — long-run rental-demand tailwind backs the buy-and-hold thesis.
- At projected returns (-3.0% appreciation + 2.6% rent growth), your $46k cash investment doubles in ~4 years — after that, you're playing with house money.
Negotiation context
- It's been on market 57 days — a 3% lower offer ($160k) is reasonable based on typical stale-listing flexibility.
Risks & watch-outs
- Climate carrying-cost: moderate flood risk; extreme-heat days projected 7→14/yr by 2055 (HVAC capex compounding) — expect insurance premiums to compound above CPI over the hold.
Questions for the listing agent
- It's been on market 57 days. Have you received any prior offers? Is the seller open to a 3% concession, seller financing, or rate buy-down credit?
- Built in 1973 — when were the roof, HVAC, electrical panel, plumbing, and water heater last replaced?
- Is there a deadline driving the sale (1031 exchange, divorce, estate, relocation)? That informs how much negotiation room exists.
- Schools are F-rated, which usually means shorter tenancies and higher turnover. Who's the typical renter profile here, and what's been the actual vacancy rate?
- What's the average days-on-market for RENTAL listings here right now (not sales)? A rising rental-DOM trend means longer vacancies and softer asking-rent achievability than the comps imply.
- What's the recent tenant-quality profile in this submarket — average credit score on applications, eviction rate, late-payment / NSF rate, and stable-employment percentage? A property-management company in the area should have these aggregated.
- How much new for-sale + rental construction is in the pipeline within 1–3 miles? Heavy new supply typically softens prices + rents 12–24 months out; constrained supply supports both.
Investment metrics
- 1% rule
- 1.93% ✓
- Cap rate
- 16.28%
- Cash-on-cash
- 35.69%
- DSCR
- 2.59
- GRM
- 4.3
CMA / ARV
- ARV (median comp)
- $180,000
- List price
- $165,000
- Delta
- -8.33%
- Verdict
- FAIR
- Comps
- 5 within 1.0 mi
Show comp detail 3 sales within ~0.75 mi
| Address | Dist | Beds/Ba | Sqft | Sold | Price | $/sf | Match |
|---|---|---|---|---|---|---|---|
| 15820 S Harlan Rd #13 | 0.00mi | 2/2.0 (-1) | 1,192 (-5%) | 14mo | $112,500 | $94 | 76 |
| 15820 S Harlan Rd #158 | 0.06mi | 3/2.0 | 1,368 (+9%) | 7mo | $192,000 | $140 | 76 |
| 15820 S Harlan Rd #16 | 0.06mi | 3/2.0 | 1,152 (-8%) | 13mo | $169,000 | $147 | 73 |
Match score weights: distance 35% · size 25% · config 20% · recency 20%. Top-matched comps best support the ARV.
Projected returns pro-forma
-3.0% appreciation · 2.62% rent growth · sell at horizon
- IRR
- 30.9%
- Equity multiple
- 2.29×
- Total profit
- $59,602
- Equity at exit
- $24,602
- IRR
- 37.9%
- Equity multiple
- 4.46×
- Total profit
- $159,834
- Equity at exit
- $14,266
Cash invested: $46,200 (down + closing). Projections, not guarantees.
Landlord ↔ Tenant lean methodology
- Overall (STATE)
- 18 Strongly Tenant-Friendly
- State California
- 18 Strongly Tenant-Friendly · D+13
- County
- — inherits STATE
- City
- — inherits STATE
ZIP-level market 95330
- Rents YoY
- 2.6%
- Active inventory
- 135
- Price-to-rent
- 4.3×
Monthly cashflow live
- Estimated rent
- $3,182 high interval (Pro) →
- Mortgage (P&I)
- −$865
- Tax est. 1.5%
- −$206 /mo · $2,475/yr
- Insurance
- −$69
- HOA
- −$0
- Vacancy / Maint / Mgmt
- −$668
- Net cashflow
- $1,374
Break-even live
UW: 25.0% down · 7.5% · 30yr · 1.5% tax · 5.0% vac · 8.0% maint · 8.0% mgmt
Financing live
Cash to close
- Down payment
- $41,250
- Closing costs
- $4,950
- Reserves months
- —
- Total cash needed
- —
Loan-product check · same deal, 3 products live
Conventional
25% down · 7.5% · 30yr
- Down + closing
- —
- Monthly P&I
- —
- Monthly cashflow
- —
- DSCR
- —
- Eligible?
- —
Personal DTI + credit; lowest rate.
DSCR
20% down · 8.5% · 30yr
- Down + closing
- —
- Monthly P&I
- —
- Monthly cashflow
- —
- DSCR
- —
- Eligible?
- —
No personal income docs; deal must DSCR.
Hard money
10% down · 12.0% · 12mo
- Down + closing
- —
- Monthly P&I
- —
- Monthly cashflow
- —
- DSCR
- —
- Eligible?
- —
Short-term bridge; refi at stabilization.
Rent comps 7 comps
| Address | Beds | Baths | Sqft | Rent | $/sqft | DOM | Units | Dist |
|---|---|---|---|---|---|---|---|---|
| 400 Stanford Xg Lathrop, CA | 2.0–3.0 | 2.5 | 1472 | $3,326 | $2.26 | 2d | 47 | 0.36mi |
| 16012 Julie Ln Lathrop, CA | 3.0 | 2.0 | 1144 | $2,800 | $2.45 | 23d | 1 | 0.38mi |
| 631 Estancia St Lathrop, CA | 4.0 | 3.0 | 1870 | $3,199 | $1.71 | 2d | 1 | 0.67mi |
| 1241 Shawn Ct Lathrop, CA | 3.0 | 2.0 | 1353 | $2,395 | $1.77 | 23d | 1 | 0.88mi |
| 240 Towne Centre Dr Unit A301 Lathrop, CA | 2.0 | 2.0 | 1046 | $2,461 | $2.35 | 43d | 1 | 1.02mi |
| 994 Osprey Dr Lathrop, CA | 3.0 | 2.0 | 1515 | $2,800 | $1.85 | 2d | 1 | 1.04mi |
| 14061 Jasper St Lathrop, CA | 3.0 | 2.0 | 1353 | $2,700 | $2.00 | 44d | 1 | 1.29mi |
Listing history 15 events
-
2026-06-18days on market $165,000 Active 57 DOM
-
2026-06-17days on market $165,000 Active 56 DOM
-
2026-06-16days on market $165,000 Active 55 DOM
-
2026-06-15days on market $165,000 Active 54 DOM
-
2026-06-14days on market $165,000 Active 52 DOM
-
2026-06-13days on market $165,000 Active 51 DOM
-
2026-06-10days on market $165,000 Active 49 DOM
-
2026-06-09days on market $165,000 Active 48 DOM
-
2026-06-08days on market $165,000 Active 47 DOM
-
2026-06-07days on market $165,000 Active 46 DOM
-
2026-06-05days on market $165,000 Active 43 DOM
-
2026-06-03pricedays on market $165,000 Active 42 DOM
-
2026-06-03days on market $169,000 Active 41 DOM
-
2026-06-01days on market $169,000 Active 40 DOM
-
2026-05-31days on market $169,000 Active 39 DOM
ⓘ Source: listings_history table (triggers on properties + properties_extension) + one-shot
backfill from property_details.listing_events for pre-trigger history.
Climate risk First Street
- Flood 5/10 Major FEMA zone X · 24% chance over 30 yrs
- Wildfire 4/10 Moderate
- Heat 7/10 Severe 7 d/yr ≥103°F today · 14 d/yr by 30 yrs out
- Wind 1/10 Low
- Air quality 10/10 Extreme 25 unhealthy d/yr today · 25 by 30 yrs out
Nearby sold comps map
Loading sold comps map…
Walkable amenities ~0.75 mi
Loading nearby amenities…
Taxation est. · year 1
- Rental income
- $38,190
- − Mortgage interest
- −$9,243
- − Property taxes
- −$2,475
- − Insurance
- −$825
- − Repairs & maintenance
- −$3,055
- − Management
- −$3,055
- − Depreciation
- −$4,800
- Taxable income
- $14,737
- Est. tax owed @ 24.0%
- −$3,537
- After-tax cash flow
- $12,950/yr
For passive investors: Depreciation is non-cash, so a rental often shows a tax loss while cash-flowing — sheltering income. Rental losses are passive: they offset passive income freely, and up to $25,000/yr can offset ordinary (W-2) income if you actively participate and your MAGI is under $100k (phasing out to $0 by $150k); unused losses carry forward. On sale, claimed depreciation is recaptured at up to 25%, and gains may owe capital-gains tax (a 1031 exchange can defer both). Figures are a year-1 estimate at your 24.0% rate — not tax advice; consult a CPA.
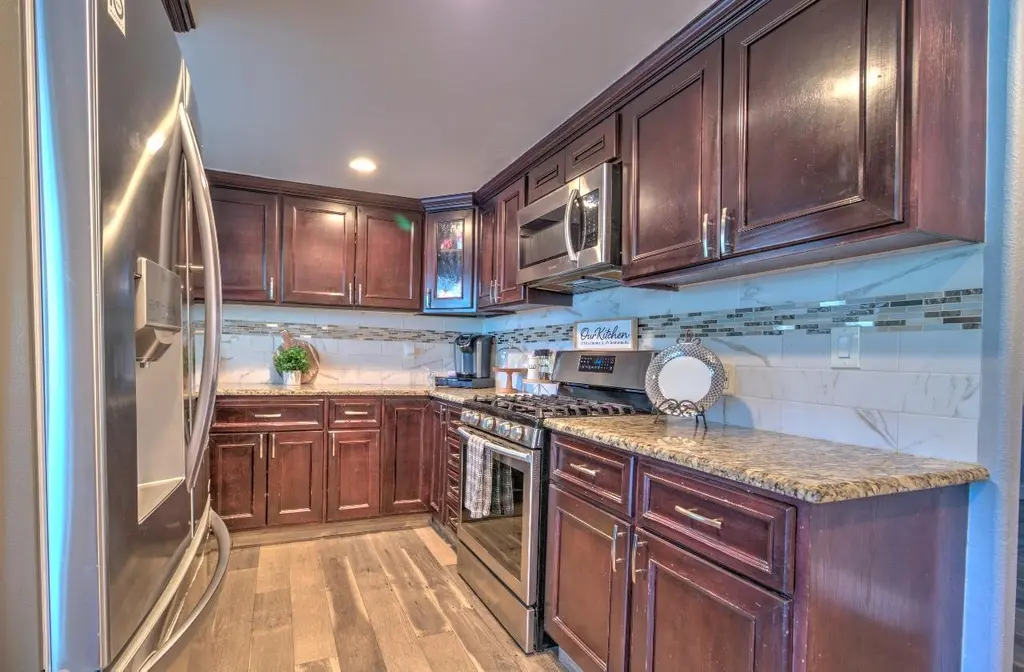
Condition & rehab AI · 10 photos
This well-maintained mobile home is move-in ready with good condition and recent updates. It offers a good balance of curb appeal and interior comfort.
Value-add opportunities
- Both Paint interior walls — Fresh paint enhances curb appeal and interior aesthetics
- Both Replace window treatments — New curtains or blinds can improve light and privacy
- Both Update kitchen backsplash — Fresh backsplash can modernize the kitchen and add value
- Both Install new flooring in bathrooms — New tile or wood-look flooring can improve aesthetics and functionality
Renovation cost estimate screening
Value-add ROI direction
- Both Paint interior walls — Fresh paint enhances curb appeal and interior aesthetics ↑
- Both Replace window treatments — New curtains or blinds can improve light and privacy ↑
- Both Update kitchen backsplash — Fresh backsplash can modernize the kitchen and add value ↑
- Both Install new flooring in bathrooms — New tile or wood-look flooring can improve aesthetics and functionality ↑
ⓘ Cost ranges are severity-bucket heuristics (US national rule-of-thumb). Get contractor quotes + a written scope before underwriting a rehab budget.
Schools (NCES district)
- District
- Manteca Unified
- NCES district ID
- 0623610
- Math proficiency
- 15% ▼ -14.00%
- Reading proficiency
- 48% ▬ 0.00%
- Median HH income
- $62,426
- Composite
- 28.5/100
- National rank
- #6737
- State rank
- #297 of 517 in CA
Livability — Lathrop
- Score
- 55/100
- State rank
- #842
- US rank
- #23278
Category grades
Schools grade is shown separately in the Schools card above.
Census & demographics
- Census place
- Lathrop, CA
- County
- San Joaquin County · 729,570 people
- City population
- 35,395
- Metro
- Stockton, CA
- Population (ZIP)
- 35,395
- Household income
- $125,421
- Rent vs Own
- Severe rent burden
- 309.0
Population outlook (San Joaquin County) Hauer SSP2
- Today (2025)
- 796,965 people
- By 2030
- 828,849 · +4.0%
- By 2040
- 885,611 · +11.1%
- By 2050
- 929,798 · +16.7%
- By 2075
- 994,578 · +24.8%
- By 2100
- 971,291 · +21.9%
Race, ethnicity, and origin ACS 2023
- Neighborhood character
- Highly diverse neighborhood (Simpson 0.73)
- Race & ethnicity
- Hispanic / Latino 35% Asian 32% Two or more races 22% White 19% Black 7% Native American 1%
- Hispanic origin (detail)
- Mexican 28% Puerto Rican 2%
- Common ancestry
- Serbian 3% Russian 1% Romanian 1%
- Foreign-born
- 31% · Canada, Vietnam, China
- Languages at home
- 54% English-only · Spanish 19% Other Indo-European 12% Tagalog/Filipino 7%
Political lean MEDSL · San Joaquin
- 2024 margin
- Toss-up / Even · D 48.0% · R 48.9% · Other 3.0%
- 2008→2024 swing
- -11.6pp toward R · 2008: 10.7pp · 2024: -0.9pp
- All cycles
- 2024: R+0.9 2020: D+13.9 2016: D+12.9 2012: D+8.9 2008: D+10.7
Not yet ingested
- Civics
- —
Market trends
- HPI YoY
- ▼ -197.75%
- Current HPI
- 306.2299
- Rent YoY
- ▲ 2.62%
- Metro
- Stockton, CA
- State GDP YoY
- ▲ 3.21%
- F500 in state
- 116
Industry mix (Fortune 500 HQ in CA)
| Industry | F500 HQs | Revenue |
|---|---|---|
| Technology | 27 | $1,492B |
|
||
| Financial Services | 3 | $174B |
|
||
| Retail | 3 | $44B |
|
||
| Insurance | 3 | $26B |
|
||
| Media / Entertainment | 2 | $115B |
|
||
| Pharmaceuticals / Biotech | 2 | $62B |
|
||
Cash-flow waterfall
monthlySold comps — $/sqft
last 12 mo · ≤1 miLoading sold comps…