216 North St · Greenport, NY
Flood risk 1/10 · Minimal
- FEMA flood zone
- X (unshaded)
- Chance of flooding over 30 yrs
- 0.0%
- Est. flood insurance / yr
- $507 – $1,088
Fire risk 1/10 · Minimal
- Est. fire insurance / yr
- $691 – $1,283
Heat risk 5/10 · Moderate
- Hot days now (above 90°F)
- 7 days/yr
- Hot days in 30 yrs
- 19 days/yr
Wind risk 8/10 · Major
- Chance of severe wind over 30 yrs
- 80.0%
Air-quality risk 3/10 · Minor
- Unhealthy air days now
- 3 days/yr
- Unhealthy air days in 30 yrs
- 4 days/yr
Risk factors via First Street. Map © Google.
Why this score? — see what drove the F grade
The composite is a weighted blend of 9 inputs, each scored 0–100. Each bar is that input's sub-score; the figure is the points it added to the 100-point composite (weight × sub-score).
- Cash flow +5.5/30.0
- ARV discount +4.6/15.0
- Schools +4.5/10.0
- Livability +3.8/5.0
- Rent growth +2.5/5.0
- Condition / age +2.5/5.0
- 1% rule +1.1/10.0
- DSCR +0.0/10.0
- Appreciation +0.0/10.0
$1,095,000
🖨 Deal sheet 📄 Offer letter ✓ Due diligence
Listing remarks MLS
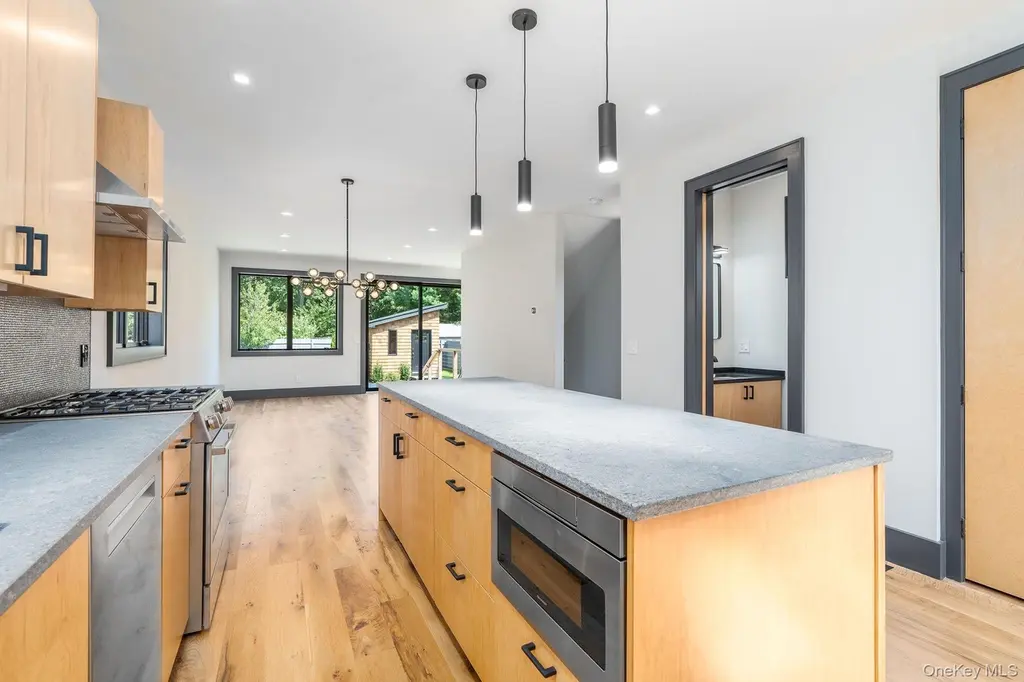
CHIC. STYLISH. SOPHISTICATED. This Brooklyn Brownstone-inspired beauty brings big-city edge to North Fork living. 3 Beds | 3.5 Baths. Stunning new construction. Entertainer's dream kitchen. EV charging ready. Chic studio shed. Fenced + professionally landscaped backyard. Sun-drenched. Designer-finished. MINT+++. Stroll to farmers markets, restaurants, bars, boutiques, and the waterfront. This is Greenport living at its most irresistible.
Key facts
- 5,227 sq ft lot
- Built 2024
- Listed 79 days
Neighborhood map
What this means for you Summary
Snapshot
- This is a 3-bed/3.5-bath single-family listed at $1.09M.
Deal economics
- At list price, monthly cash flow is $-2k ($-28k/yr) — negative.
- To cash-flow at today's rent, offer at most $758k (30.8% below list).
- To meet the 1% rule (rent ≥ 1% of price), the offer needs to be $663k (39.5% below list).
- Recommended offer: $663k (39.5% below list) — sets the bar for 1% rule.
Location & tenants
- Location reads 76/100 on livability (#217 in NY, #3,399 nationally) — a middle-class / working-renter tenant base. Strengths: crime A+, health & safety A+, commute B+; Watch: housing C-, cost of living F.
- Greenport Union Free School District (town): math 55% / reading 45% proficiency, ranked #450 of 755 in NY (top 60%) — acceptable for families but not a draw, mixed tenant base, ~2y average lease.
- Market conditions: 67 active listings in the ZIP; 11 comparable units currently listed for rent nearby; rentals lingering (median 44d on market — plan ~5-8 weeks vacancy on turnover, expect pricing pressure); 55% of comp listings sitting > 30 days — soft ceiling on asking rent; 1,366 units permitted in Suffolk County in 2024 (216 in 5+ unit buildings).
Forward outlook
- Local home prices are declining (-3.0%/yr); year-one equity from $8k of loan paydown is wiped out by about $33k of value loss. Plan a longer hold.
- Suffolk County population projected to shrink 5% by 2050 — rents likely to lag national; underwrite the cash flow, not the appreciation.
Negotiation context
- It's been on market 79 days — a 6% lower offer ($1.03M) is reasonable based on typical stale-listing flexibility.
- 2 sale attempts since 2y ago with the ask held roughly flat each time — persistent listings suggest the price (not the market) is what's stuck; bring a comps-based counter.
- Current owner paid $389k; list at $1.09M implies a 181% gain — meaningful room to come down on a strong offer.
Risks & watch-outs
- Climate carrying-cost: severe wind risk, 80% chance of damaging wind over 30y; extreme-heat days projected 7→19/yr by 2055 (HVAC capex compounding) — expect insurance premiums to compound above CPI over the hold.
Questions for the listing agent
- What do current leases actually rent for vs. the listed asking? Can we see a recent rent roll and the last 12 months of T-12 income?
- It's been on market 79 days. Have you received any prior offers? Is the seller open to a 39% concession, seller financing, or rate buy-down credit?
- Why hasn't it sold? Are there any deal-killer items the seller is aware of (foundation, flood, title, zoning, code violations)?
- Is there a deadline driving the sale (1031 exchange, divorce, estate, relocation)? That informs how much negotiation room exists.
- The area grade is low — what's the realistic commute time and amenity access for the typical tenant pool here? Any planned neighborhood developments (good or bad) we should know about?
- What's the average days-on-market for RENTAL listings here right now (not sales)? A rising rental-DOM trend means longer vacancies and softer asking-rent achievability than the comps imply.
- What's the recent tenant-quality profile in this submarket — average credit score on applications, eviction rate, late-payment / NSF rate, and stable-employment percentage? A property-management company in the area should have these aggregated.
- How much new for-sale + rental construction is in the pipeline within 1–3 miles? Heavy new supply typically softens prices + rents 12–24 months out; constrained supply supports both.
Investment metrics
- 1% rule
- 0.61% ✗
- Cap rate
- 3.74%
- Cash-on-cash
- -9.12%
- DSCR
- 0.59
- GRM
- 13.8
CMA / ARV
- ARV (median comp)
- $1,028,506
- List price
- $1,095,000
- Delta
- 6.47%
- Verdict
- FAIR
- Comps
- 20 within 1.0 mi
Show comp detail 12 sales within ~0.75 mi
| Address | Dist | Beds/Ba | Sqft | Sold | Price | $/sf | Match |
|---|---|---|---|---|---|---|---|
| 216 North St | 0.00mi | 3/3.5 | 1,724 (0%) | 0mo | $999,000 | $579 | 100 |
| 1605 Washington Ave | 0.41mi | 4/3.0 (+1) | 1,740 (+1%) | 6mo | $1,295,000 | $744 | 67 |
| 237 5th Ave | 0.29mi | 3/1.5 | 1,700 (-1%) | 11mo | $1,250,000 | $735 | 67 |
| 312 5th Ave | 0.21mi | 3/2.0 | 1,620 (-6%) | 10mo | $875,000 | $540 | 66 |
| 336 2nd St | 0.15mi | 4/2.0 (+1) | 1,800 (+4%) | 14mo | $578,000 | $321 | 62 |
| 520 4th St | 0.36mi | 3/2.0 | 1,599 (-7%) | 11mo | $890,000 | $557 | 56 |
| 330 2nd St | 0.16mi | 2/2.0 (-1) | 1,946 (+13%) | 6mo | $675,000 | $347 | 55 |
| 426 Clark St | 0.72mi | 3/2.5 | 1,672 (-3%) | 3mo | $1,645,000 | $984 | 55 |
| 516 4th St | 0.38mi | 4/2.5 (+1) | 1,840 (+7%) | 14mo | $1,195,000 | $649 | 51 |
| 16 Washington Ave | 0.35mi | 3/1.5 | 1,550 (-10%) | 12mo | $979,000 | $632 | 49 |
| 57 (aka 400) Wilmarth Ave | 0.39mi | 3/1.0 | 1,500 (-13%) | 4mo | $585,000 | $390 | 47 |
| 1295 Washington Ave | 0.37mi | 2/1.5 (-1) | 1,500 (-13%) | 3mo | $630,000 | $420 | 45 |
Match score weights: distance 35% · size 25% · config 20% · recency 20%. Top-matched comps best support the ARV.
Projected returns pro-forma
-3.0% appreciation · 3.0% rent growth · sell at horizon
- IRR
- -32.5%
- Equity multiple
- -0.06×
- Total profit
- $-325,778
- Equity at exit
- $163,268
- IRR
- -38.1%
- Equity multiple
- -0.55×
- Total profit
- $-474,418
- Equity at exit
- $94,676
Cash invested: $306,600 (down + closing). Projections, not guarantees.
Landlord ↔ Tenant lean methodology
- Overall (STATE)
- 15 Strongly Tenant-Friendly
- State New York
- 15 Strongly Tenant-Friendly · D+10
- County
- — inherits STATE
- City
- — inherits STATE
ZIP-level market 11944
- Home prices YoY
- -23.7%
- Active inventory
- 67
- Price-to-rent
- 13.8×
Monthly cashflow live
- Estimated rent
- $6,629 high interval (Pro) →
- Mortgage (P&I)
- −$5,742
- Tax est. 1.5%
- −$1,369 /mo · $16,425/yr
- Insurance
- −$456
- HOA
- −$0
- Vacancy / Maint / Mgmt
- −$1,392
- Net cashflow
- $-2,331
Break-even live
UW: 25.0% down · 7.5% · 30yr · 1.5% tax · 5.0% vac · 8.0% maint · 8.0% mgmt
Financing live
Cash to close
- Down payment
- $273,750
- Closing costs
- $32,850
- Reserves months
- —
- Total cash needed
- —
Loan-product check · same deal, 3 products live
Conventional
25% down · 7.5% · 30yr
- Down + closing
- —
- Monthly P&I
- —
- Monthly cashflow
- —
- DSCR
- —
- Eligible?
- —
Personal DTI + credit; lowest rate.
DSCR
20% down · 8.5% · 30yr
- Down + closing
- —
- Monthly P&I
- —
- Monthly cashflow
- —
- DSCR
- —
- Eligible?
- —
No personal income docs; deal must DSCR.
Hard money
10% down · 12.0% · 12mo
- Down + closing
- —
- Monthly P&I
- —
- Monthly cashflow
- —
- DSCR
- —
- Eligible?
- —
Short-term bridge; refi at stabilization.
Rent comps 11 comps
| Address | Beds | Baths | Sqft | Rent | $/sqft | DOM | Units | Dist |
|---|---|---|---|---|---|---|---|---|
| 312 5th Ave Greenport, NY | 4.0 | 2.0 | 1900 | $12,000 | $6.32 | 43d | 1 | 0.21mi |
| 744 Main St Unit 2 Greenport, NY | 2.0 | 2.0 | 1200 | $3,400 | $2.83 | 43d | 1 | 0.24mi |
| 248 5th Ave Greenport, NY | 2.0 | 1.0 | 1306 | $3,500 | $2.68 | 43d | 1 | 0.25mi |
| 123 Sterling Ave #2 Greenport, NY | 3.0 | 3.0 | 1528 | $45,000 | $29.45 | 43d | 1 | 0.31mi |
| 517 Flint St Greenport, NY | 2.0 | 1.0 | 1100 | $3,500 | $3.18 | 43d | 1 | 0.59mi |
| 237 6th St Greenport, NY | 2.0 | 2.5 | 1452 | $14,000 | $9.64 | 11d | 1 | 0.67mi |
| 485 Sutton Pl Greenport, NY | 4.0 | 2.5 | 2026 | $20,000 | $9.87 | 43d | 1 | 0.70mi |
| 134 6th St Greenport, NY | 3.0 | 2.0 | 1560 | $18,500 | $11.86 | 19d | 1 | 0.81mi |
| 131 6th St Unit G Greenport, NY | 3.0 | 2.5 | 2238 | $5,000 | $2.23 | 24d | 1 | 0.85mi |
| 8 Oyster Pt Greenport, NY | 2.0 | 2.0 | 1190 | $5,500 | $4.62 | 3d | 1 | 0.88mi |
| 1110 Gillette Dr East Marion, NY | 4.0 | 2.0 | 1500 | $7,000 | $4.67 | 19d | 1 | 1.43mi |
Listing history 11 events
-
2026-05-16status Pending 442-char remark
Show marketing remark (442 chars)
CHIC. STYLISH. SOPHISTICATED. This Brooklyn Brownstone-inspired beauty brings big-city edge to North Fork living. 3 Beds | 3.5 Baths. Stunning new construction. Entertainer's dream kitchen. EV charging ready. Chic studio shed. Fenced + professionally landscaped backyard. Sun-drenched. Designer-finished. MINT+++. Stroll to farmers markets, restaurants, bars, boutiques, and the waterfront. This is Greenport living at its most irresistible.
-
2026-02-27$1,095,000 Active 442-char remark
Show marketing remark (442 chars)
CHIC. STYLISH. SOPHISTICATED. This Brooklyn Brownstone-inspired beauty brings big-city edge to North Fork living. 3 Beds | 3.5 Baths. Stunning new construction. Entertainer's dream kitchen. EV charging ready. Chic studio shed. Fenced + professionally landscaped backyard. Sun-drenched. Designer-finished. MINT+++. Stroll to farmers markets, restaurants, bars, boutiques, and the waterfront. This is Greenport living at its most irresistible.
-
2026-02-19historical $1,095,000 442-char remark
Show marketing remark (442 chars)
CHIC. STYLISH. SOPHISTICATED. This Brooklyn Brownstone-inspired beauty brings big-city edge to North Fork living. 3 Beds | 3.5 Baths. Stunning new construction. Entertainer's dream kitchen. EV charging ready. Chic studio shed. Fenced + professionally landscaped backyard. Sun-drenched. Designer-finished. MINT+++. Stroll to farmers markets, restaurants, bars, boutiques, and the waterfront. This is Greenport living at its most irresistible.
-
2025-12-15historical
-
2025-05-13price $1,195,000
-
2024-10-25price $1,250,000
-
2024-08-16$1,295,000 Active
-
2024-08-15historical
-
2021-12-06soldstatus $389,000
-
2008-01-29soldstatus $200,000
-
1985-03-14soldstatus $38,000
ⓘ Source: listings_history table (triggers on properties + properties_extension) + one-shot
backfill from property_details.listing_events for pre-trigger history.
Climate risk First Street
- Flood 1/10 Low FEMA zone X (unshaded) · 0% chance over 30 yrs
- Wildfire 1/10 Low
- Heat 5/10 Major 7 d/yr ≥90°F today · 19 d/yr by 30 yrs out
- Wind 8/10 Severe 80% chance of damaging wind over 30 yrs
- Air quality 3/10 Moderate 3 unhealthy d/yr today · 4 by 30 yrs out
Nearby sold comps map
Loading sold comps map…
Walkable amenities ~0.75 mi
Loading nearby amenities…
Taxation est. · year 1
- Rental income
- $79,544
- − Mortgage interest
- −$61,337
- − Property taxes
- −$16,425
- − Insurance
- −$5,475
- − Repairs & maintenance
- −$6,364
- − Management
- −$6,364
- − Depreciation
- −$31,855
- Taxable loss
- −$48,275
- Est. tax savings @ 24.0%
- +$11,586
- After-tax cash flow
- $-16,382/yr
For passive investors: Depreciation is non-cash, so a rental often shows a tax loss while cash-flowing — sheltering income. Rental losses are passive: they offset passive income freely, and up to $25,000/yr can offset ordinary (W-2) income if you actively participate and your MAGI is under $100k (phasing out to $0 by $150k); unused losses carry forward. On sale, claimed depreciation is recaptured at up to 25%, and gains may owe capital-gains tax (a 1031 exchange can defer both). Figures are a year-1 estimate at your 24.0% rate — not tax advice; consult a CPA.
Schools (NCES district)
- District
- Greenport Union Free School District
- NCES district ID
- 3612840
- Math proficiency
- 55% ▲ 5.00%
- Reading proficiency
- 45% ▼ -5.00%
- Median HH income
- $54,490
- Composite
- 45.25/100
- National rank
- #5759
- State rank
- #450 of 755 in NY
Livability — Greenport
- Score
- 76/100
- State rank
- #217
- US rank
- #3399
Category grades
Schools grade is shown separately in the Schools card above.
Census & demographics
- Census place
- Greenport, NY
- City population
- 4,744
- Population (ZIP)
- 4,744
Population outlook (Suffolk County) Hauer SSP2
- Today (2025)
- 1,505,262 people
- By 2030
- 1,498,318 · -0.5%
- By 2040
- 1,471,101 · -2.3%
- By 2050
- 1,424,848 · -5.3%
- By 2075
- 1,337,157 · -11.2%
- By 2100
- 1,217,720 · -19.1%
Race, ethnicity, and origin ACS 2023
- Neighborhood character
- Predominantly White (69%)
- Race & ethnicity
- White 69% Hispanic / Latino 23% Two or more races 6% Black 4% Asian 2%
- Hispanic origin (detail)
- Mexican 5% Puerto Rican 2%
- Common ancestry
- Romanian 6% Lithuanian 2% Subsaharan African 2%
- Foreign-born
- 19% · Canada, China
- Languages at home
- 69% English-only · Spanish 22% German/W. Germanic 3% Russian/Polish/Slavic 2%
Political lean MEDSL · Suffolk
- 2024 margin
- Lean R (+10.0) · D 45.0% · R 55.0%
- 2008→2024 swing
- -16.0pp toward R · 2008: 6.0pp · 2024: -10.0pp
- All cycles
- 2024: R+10.0 2020: R+0.0 2016: R+8.2 2012: D+2.9 2008: D+6.0
Not yet ingested
- Civics
- —
Market trends
- HPI YoY
- ▼ -143.97%
- Current HPI
- 462.3431
- Rent YoY
- —
- Metro
- —
- State GDP YoY
- ▲ 2.60%
- F500 in state
- 92
Industry mix (Fortune 500 HQ in NY)
| Industry | F500 HQs | Revenue |
|---|---|---|
| Financial Services | 10 | $950B |
|
||
| Consumer Goods | 9 | $162B |
|
||
| Insurance | 4 | $225B |
|
||
| Telecommunications | 2 | $144B |
|
||
| Pharmaceuticals | 2 | $112B |
|
||
| Media / Entertainment | 2 | $69B |
|
||
Price history
+2781.6% since first listed11 events — show timeline
- 2026-05-16 Pending — OneKey® MLS as Distributed by MLS Grid
- 2026-02-27 Listed $1,095,000 OneKey® MLS as Distributed by MLS Grid
- 2026-02-19 Coming Soon $1,095,000 OneKey® MLS as Distributed by MLS Grid
- 2025-12-15 Listing Removed — OneKey® MLS as Distributed by MLS Grid
- 2025-05-13 Price Changed $1,195,000 OneKey® MLS as Distributed by MLS Grid
- 2024-10-25 Price Changed $1,250,000 OneKey® MLS as Distributed by MLS Grid
- 2024-08-16 Listed $1,295,000 OneKey® MLS as Distributed by MLS Grid
- 2024-08-15 Coming Soon — OneKey® MLS as Distributed by MLS Grid
- 2021-12-06 Sold (Public Records) $389,000 Public Records
- 2008-01-29 Sold (Public Records) $200,000 Public Records
- 1985-03-14 Sold (Public Records) $38,000 Public Records
Property tax history
+1.8%/yrLatest (2025): $2,052 · +0.0% YoY. Source: county tax records.
Cash-flow waterfall
monthlySold comps — $/sqft
last 12 mo · ≤1 miLoading sold comps…