4001 Lakeview Rd · Petersburg, VA
Flood risk 1/10 · Minimal
- FEMA flood zone
- X (unshaded)
- Chance of flooding over 30 yrs
- 0.0%
- Est. flood insurance / yr
- $507 – $1,088
Fire risk 2/10 · Minimal
- Est. fire insurance / yr
- $666 – $1,236
Heat risk 7/10 · Major
- Hot days now (above 108°F)
- 7 days/yr
- Hot days in 30 yrs
- 15 days/yr
Wind risk 6/10 · Moderate
- Chance of severe wind over 30 yrs
- 40.0%
Air-quality risk 2/10 · Minimal
- Unhealthy air days now
- 0 days/yr
- Unhealthy air days in 30 yrs
- 1 days/yr
Risk factors via First Street. Map © Google.
Why this score? — see what drove the D- grade
The composite is a weighted blend of 9 inputs, each scored 0–100. Each bar is that input's sub-score; the figure is the points it added to the 100-point composite (weight × sub-score).
- ARV discount +10.1/15.0
- Cash flow +6.6/30.0
- Appreciation +5.7/10.0
- Schools +5.2/10.0
- Rent growth +4.0/5.0
- Livability +3.1/5.0
- Condition / age +2.5/5.0
- 1% rule +1.0/10.0
- DSCR +0.9/10.0
$325,000
🖨 Deal sheet (PDF) 📄 Offer letter ✓ Due diligence
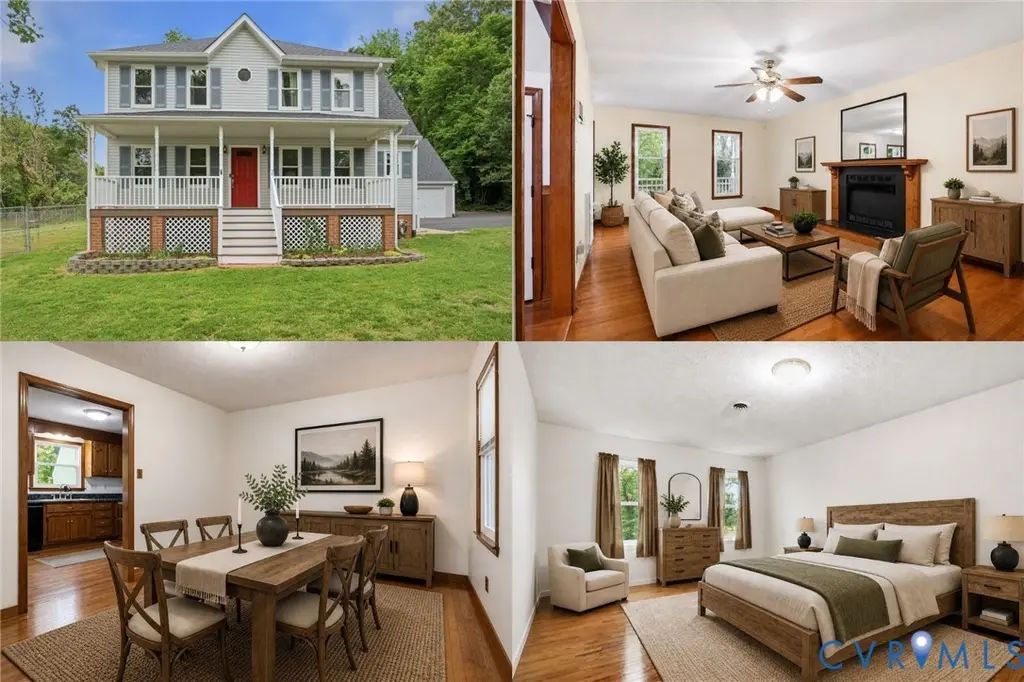
Listing remarks
Step into a home that feels like a true retreat from the moment you arrive. Surrounded by the quiet whisper of mature trees on a spacious lot, this property offers a rare sense of privacy and breathing room while keeping you anchored to everything you need. The paved driveway and detached garage add a sense of ease to your daily rhythm, setting the tone for a lifestyle that is both intentional and serene. Inside, natural light dances across the original hardwood floors, creating a warm, golden glow that instantly feels like home. The heart of the house balances timeless charm with modern peace of mind. The eat-in kitchen, featuring its original shaker cabinetry, stands as a beautiful canvas
Key facts
- 0.8 acre lot
- 2 garage spots
- Built 1996
Property features AI
Exterior
- Parking: Detached 2-car garage; Driveway parking (paved)
- Security: Security system
- Utilities: Well water; Septic tank
- Home design: Two-story home; Frame construction with vinyl siding; Composition roof; Above-grade living area present; Property resale condition
- Construction: Built (year reported as actual); Frame construction; Vinyl siding; Composition roof
- Exterior features: Deck; Storage shed; Paved driveway; Fenced yard (full); Landscaped, level lot
Interior
- Kitchen: Refrigerator; Stove; Dishwasher; Disposal; Pantry; Eat-in layout
- Bedrooms: Bedroom 2 on second floor; Bedroom 3 on second floor; Additional bedrooms located on second floor
- Flooring: Tile; Wood
- Bathrooms: Two full bathrooms; One half bathroom; Second-floor full bath with tub and shower
- Heating & cooling: Forced air heating (natural gas); Central air conditioning
- Interior features: Ceiling fans; Separate/formal dining room; Eat-in kitchen; High-speed internet; Laminate countertops; Primary bedroom with bath; Pantry; Cable TV; Wired for data; Walk-in closets; Fireplace (gas)
- Laundry & utility: Washer; Dryer; Electric water heater; Generator
Neighborhood map
What this means for you Summary
Snapshot
- This is a 3-bed/2.5-bath single-family listed at $325k.
Deal economics
- At list price, monthly cash flow is $-533 ($-6k/yr) — negative.
- To cash-flow at today's rent, offer at most $231k (29.0% below list).
- To meet the 1% rule (rent ≥ 1% of price), the offer needs to be $195k (39.9% below list).
- Recommended offer: $195k (39.9% below list) — sets the bar for 1% rule.
Location & tenants
- Location reads 61/100 on livability (#413 in VA) — a middle-class / working-renter tenant base. Strengths: cost of living A+, housing A; Watch: schools D+, crime F, amenities F.
- Chesterfield County Public School District (suburban): math 52% / reading 64% proficiency, ranked #57 of 131 in VA (top 44%) — acceptable for families but not a draw, mixed tenant base, ~2y average lease.
- Market conditions: Rents rising fast (+5.9%/yr); 295 active listings in the ZIP; 7 comparable units currently listed for rent nearby; rentals leasing fast (median 12d on market — plan ~1-2 weeks tenant-placement turnaround); 2,307 units permitted in Chesterfield County in 2024 (462 in 5+ unit buildings).
- This rent runs 41% of the median local income ($58k/yr) — at the standard rent-burdened threshold; future hikes will face affordability resistance.
Forward outlook
- In year one you build about $7k of equity ($2k loan paydown + $5k appreciation (1.4% local appreciation)).
- Chesterfield County population projected at +20% by 2050 — long-run rental-demand tailwind backs the buy-and-hold thesis.
- By year 5, paydown + projected appreciation supports a ~$31k cash-out refi (75% LTV) — recoverable capital for the next deal without selling this one.
Negotiation context
- Only 3 days on market — expect competitive offers; lowballing is unlikely to land.
Risks & watch-outs
- Climate carrying-cost: major wind risk, 40% chance of damaging wind over 30y; extreme-heat days projected 7→15/yr by 2055 (HVAC capex compounding) — expect insurance premiums to compound above CPI over the hold.
Questions for the listing agent
- What do current leases actually rent for vs. the listed asking? Can we see a recent rent roll and the last 12 months of T-12 income?
- Is there a deadline driving the sale (1031 exchange, divorce, estate, relocation)? That informs how much negotiation room exists.
- Schools are D-rated, which usually means shorter tenancies and higher turnover. Who's the typical renter profile here, and what's been the actual vacancy rate?
- Crime grade is F in this area — have there been break-ins, vandalism, or insurance claims at this property in the last 3 years? What carrier currently insures it and at what premium?
- The area grade is low — what's the realistic commute time and amenity access for the typical tenant pool here? Any planned neighborhood developments (good or bad) we should know about?
- What's the average days-on-market for RENTAL listings here right now (not sales)? A rising rental-DOM trend means longer vacancies and softer asking-rent achievability than the comps imply.
- What's the recent tenant-quality profile in this submarket — average credit score on applications, eviction rate, late-payment / NSF rate, and stable-employment percentage? A property-management company in the area should have these aggregated.
- How much new for-sale + rental construction is in the pipeline within 1–3 miles? Heavy new supply typically softens prices + rents 12–24 months out; constrained supply supports both.
Investment metrics
- 1% rule
- 0.60% ✗
- Cap rate
- 4.33%
- Cash-on-cash
- -7.03%
- DSCR
- 0.69
- GRM
- 13.9
CMA / ARV
- ARV (median comp)
- $345,276
- List price
- $325,000
- Delta
- -5.87%
- Verdict
- FAIR
- Comps
- 20 within 1.0 mi
Show comp detail 12 sales within ~0.75 mi
| Address | Dist | Beds/Ba | Sqft | Sold | Price | $/sf | Match |
|---|---|---|---|---|---|---|---|
| 4001 Lakeview Rd | 0.00mi | 3/2.5 | 1,698 (0%) | 1mo | $355,000 | $209 | 99 |
| 18531 Twisted Oak Ter | 0.12mi | 3/2.5 | 1,778 (+5%) | 5mo | $307,000 | $173 | 82 |
| 18515 Rollingside Dr | 0.19mi | 3/2.5 | 1,902 (+12%) | 3mo | $355,000 | $187 | 69 |
| 4307 Twisted Oak Dr | 0.35mi | 3/2.5 | 1,530 (-10%) | 2mo | $338,000 | $221 | 66 |
| 4107 Fallen Pine Ct | 0.39mi | 4/2.5 (+1) | 1,728 (+2%) | 16mo | $339,000 | $196 | 61 |
| 902 Lakeview Ave | 0.39mi | 4/2.0 (+1) | 1,669 (-2%) | 13mo | $305,000 | $183 | 61 |
| 116 Homestead Dr | 0.75mi | 3/1.5 | 1,686 (-1%) | 1mo | $310,000 | $184 | 60 |
| 116 Verbov Ave | 0.55mi | 3/2.0 | 1,653 (-3%) | 12mo | $258,000 | $156 | 58 |
| 3536 Betz Ct | 0.75mi | 3/2.0 | 1,601 (-6%) | 1mo | $345,000 | $215 | 53 |
| 4107 Forest Vine Pl | 0.38mi | 3/2.5 | 1,456 (-14%) | 10mo | $342,700 | $235 | 50 |
| 110 Lakeside Dr | 0.58mi | 3/2.5 | 1,866 (+10%) | 11mo | $350,000 | $188 | 47 |
| 18802 Pine Grove Ave | 0.62mi | 3/2.0 | 1,584 (-7%) | 18mo | $309,500 | $195 | 42 |
Match score weights: distance 35% · size 25% · config 20% · recency 20%. Top-matched comps best support the ARV.
Projected returns pro-forma
1.45% appreciation · 5.89% rent growth · sell at horizon
- IRR
- -3.1%
- Equity multiple
- 0.84×
- Total profit
- $-14,899
- Equity at exit
- $118,605
- IRR
- 3.1%
- Equity multiple
- 1.42×
- Total profit
- $38,520
- Equity at exit
- $163,715
Cash invested: $91,000 (down + closing). Projections, not guarantees.
Landlord ↔ Tenant lean methodology
- Overall (STATE)
- 55 Moderately Landlord-Leaning
- State Virginia
- 55 Moderately Landlord-Leaning · D+2
- County
- — inherits STATE
- City
- — inherits STATE
ZIP-level market 23803
- Home prices YoY
- 0.3%
- Rents YoY
- 5.9%
- Active inventory
- 295
- Price-to-rent
- 13.9×
Monthly cashflow live
- Estimated rent
- $1,953 high interval (Pro) →
- Mortgage (P&I)
- −$1,704
- Tax from tax record
- −$236 /mo · $2,833/yr
- Insurance
- −$135
- HOA
- −$0
- Vacancy / Maint / Mgmt
- −$410
- Net cashflow
- $-533
Break-even live
Sensitivity live
| Price | -10% $-349 | -5% $-441 | +0% $-533 | +5% $-625 | +10% $-717 |
|---|---|---|---|---|---|
| Rent | -10% $-687 | -5% $-610 | +0% $-533 | +5% $-456 | +10% $-379 |
| Rate | -1.0pp $-369 | -0.5pp $-450 | base $-533 | +0.5pp $-617 | +1.0pp $-703 |
UW: 25.0% down · 7.5% · 30yr · 1.5% tax · 5.0% vac · 8.0% maint · 8.0% mgmt
Financing live
Cash to close
- Down payment
- $81,250
- Closing costs
- $9,750
- Reserves months
- —
- Total cash needed
- —
Loan-product check · same deal, 3 products live
Conventional
25% down · 7.5% · 30yr
- Down + closing
- —
- Monthly P&I
- —
- Monthly cashflow
- —
- DSCR
- —
- Eligible?
- —
Personal DTI + credit; lowest rate.
DSCR
20% down · 8.5% · 30yr
- Down + closing
- —
- Monthly P&I
- —
- Monthly cashflow
- —
- DSCR
- —
- Eligible?
- —
No personal income docs; deal must DSCR.
Hard money
10% down · 12.0% · 12mo
- Down + closing
- —
- Monthly P&I
- —
- Monthly cashflow
- —
- DSCR
- —
- Eligible?
- —
Short-term bridge; refi at stabilization.
Rent comps 7 comps
| Address | Beds | Baths | Sqft | Rent | $/sqft | DOM | Units | Dist |
|---|---|---|---|---|---|---|---|---|
| 4019 Frye Ter South Chesterfield, VA | 3.0 | 2.5 | 1816 | $2,300 | $1.27 | 15d | 1 | 0.22mi |
| 925 Lakeview Ave Unit C Colonial Heights, VA | 2.0 | 1.5 | 1080 | $1,495 | $1.38 | 45d | 1 | 0.29mi |
| 919 Lakeview Ave Apt Q Colonial Heights, VA | 2.0 | 1.5 | 1250 | $1,895 | $1.52 | 11d | 1 | 0.33mi |
| 4307 Twisted Oak Dr South Chesterfield, VA | 3.0 | 2.5 | 1530 | $2,500 | $1.63 | 3d | 1 | 0.33mi |
| 100 Lakeview Park Rd #141 Colonial Heights, VA | 1.0–3.0 | 1.0–1.5 | 870 | $1,825 | $2.10 | 3d | 1 | 0.42mi |
| 103 Sadler Ave Colonial Heights, VA | 3.0 | 1.0 | 1230 | $1,800 | $1.46 | 13d | 1 | 0.46mi |
| 104 Brijidan Ln Colonial Heights, VA | 3.0 | 2.0 | 1355 | $2,241 | $1.65 | 11d | 1 | 0.70mi |
Listing history 7 events
-
2026-05-08status Pending 1884-char remark
-
2026-05-06$325,000 Active 1884-char remark
-
2026-04-30historical $325,000 1884-char remark
-
2004-09-08soldstatus $180,000
-
2004-09-08soldstatus $180,000
-
1996-08-26soldstatus $105,750
-
1988-05-06soldstatus $15,960
ⓘ Source: listings_history table (triggers on properties + properties_extension) + one-shot
backfill from property_details.listing_events for pre-trigger history.
Tax reassessment forecast VA · Resets to sale price
- Current annual tax
- $2,833 · $236/mo
- Projected year-2 tax
- $2,833 · $236/mo
- Expected delta
- $0/yr ($0/mo · -0.0%)
ⓘ Screening estimate from a state-policy table — verify with the county assessor before closing.
Climate risk First Street
- Flood 1/10 Low FEMA zone X (unshaded) · 0% chance over 30 yrs
- Wildfire 2/10 Low
- Heat 7/10 Severe 7 d/yr ≥108°F today · 15 d/yr by 30 yrs out
- Wind 6/10 Major 40% chance of damaging wind over 30 yrs
- Air quality 2/10 Low 0 unhealthy d/yr today · 1 by 30 yrs out
Nearby sold comps map
Loading sold comps map…
Walkable amenities ~0.75 mi
Loading nearby amenities…
Taxation est. · year 1
- Rental income
- $23,437
- − Mortgage interest
- −$18,205
- − Property taxes
- −$2,833
- − Insurance
- −$1,625
- − Repairs & maintenance
- −$1,875
- − Management
- −$1,875
- − Depreciation
- −$9,455
- Taxable loss
- −$12,431
- Est. tax savings @ 24.0%
- +$2,983
- After-tax cash flow
- $-3,412/yr
For passive investors: Depreciation is non-cash, so a rental often shows a tax loss while cash-flowing — sheltering income. Rental losses are passive: they offset passive income freely, and up to $25,000/yr can offset ordinary (W-2) income if you actively participate and your MAGI is under $100k (phasing out to $0 by $150k); unused losses carry forward. On sale, claimed depreciation is recaptured at up to 25%, and gains may owe capital-gains tax (a 1031 exchange can defer both). Figures are a year-1 estimate at your 24.0% rate — not tax advice; consult a CPA.
Schools (NCES district)
- District
- Chesterfield County Public School District
- NCES district ID
- 5100840
- Math proficiency
- 52% ▼ -30.00%
- Reading proficiency
- 64% ▼ -15.00%
- Median HH income
- $72,821
- Composite
- 51.56/100
- National rank
- #1712
- State rank
- #57 of 131 in VA
Livability — Petersburg
- Score
- 61/100
- State rank
- #413
- US rank
- #17309
Category grades
Schools grade is shown separately in the Schools card above.
Census & demographics
- County
- Chesterfield County · 406,988 people
- City population
- 63,420
- Metro
- Richmond, VA
- Population (ZIP)
- 42,012
- Household income
- $57,813
- Rent vs Own
- Severe rent burden
- 2485.0
Population outlook (Chesterfield County) Hauer SSP2
- Today (2025)
- 377,190 people
- By 2030
- 395,710 · +4.9%
- By 2040
- 427,694 · +13.4%
- By 2050
- 452,706 · +20.0%
- By 2075
- 505,533 · +34.0%
- By 2100
- 521,282 · +38.2%
Race, ethnicity, and origin ACS 2023
- Neighborhood character
- Diverse neighborhood (Simpson 0.57)
- Race & ethnicity
- Black 58% White 31% Hispanic / Latino 6% Two or more races 5%
- Hispanic origin (detail)
- Mexican 1% Puerto Rican 2%
- Common ancestry
- Italian 1% Romanian 1% Slovak 1%
- Foreign-born
- 4% · Canada
- Languages at home
- 93% English-only · Spanish 5%
Political lean MEDSL · Chesterfield
- 2024 margin
- Lean D (+9.0) · D 53.8% · R 44.8% · Other 1.4%
- 2008→2024 swing
- +16.4pp toward D · 2008: -7.5pp · 2024: 9.0pp
- All cycles
- 2024: D+9.0 2020: D+6.7 2016: R+2.2 2012: R+7.1 2008: R+7.5
Not yet ingested
- Civics
- —
Market trends
- HPI YoY
- ▲ 1.45%
- Current HPI
- 480.5365
- Rent YoY
- ▲ 5.89%
- Metro
- Richmond, VA
- State GDP YoY
- ▲ 2.40%
- F500 in state
- 50
Industry mix (Fortune 500 HQ in VA)
| Industry | F500 HQs | Revenue |
|---|---|---|
| Aerospace / Defense | 4 | $236B |
|
||
| Technology / Defense | 3 | $32B |
|
||
| Financial Services | 2 | $176B |
|
||
| Utilities | 2 | $27B |
|
||
| Insurance | 2 | $25B |
|
||
| Technology | 2 | $15B |
|
||
Price history
+2124.3% since first listed9 events — show timeline
- 2026-05-28 Sold (Public Records) $355,000 Public Records
- 2026-05-28 Sold (MLS) $355,000 CVRMLS
- 2026-05-08 Pending — CVRMLS
- 2026-05-06 Listed $325,000 CVRMLS
- 2026-04-30 Coming Soon $325,000 CVRMLS
- 2004-09-08 Sold (Public Records) $180,000 Public Records
- 2004-09-08 Sold (Public Records) $180,000 Public Records
- 1996-08-26 Sold (Public Records) $105,750 Public Records
- 1988-05-06 Sold (Public Records) $15,960 Public Records
Property tax history
+4.2%/yrLatest (2025): $2,833 · +4.5% YoY. Source: county tax records.
Cash-flow waterfall
monthlySold comps — $/sqft
last 12 mo · ≤1 miLoading sold comps…