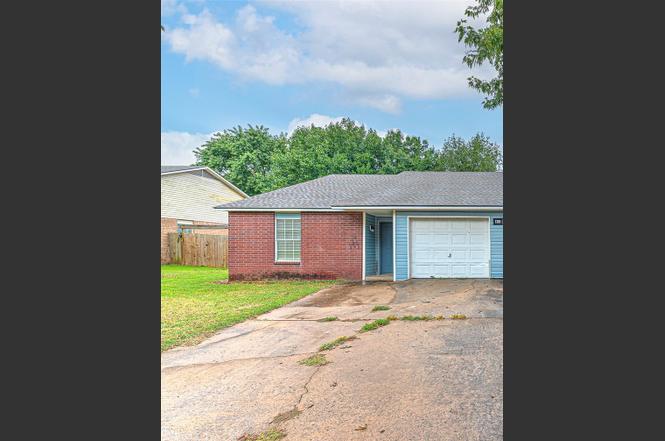
1389 N Boxley Ave · Fayetteville, AR
Flood risk 1/10 · Minimal
- FEMA flood zone
- X (unshaded)
- Chance of flooding over 30 yrs
- 0.0%
- Est. flood insurance / yr
- $507 – $1,088
Fire risk 5/10 · Moderate
- Est. fire insurance / yr
- $1,499 – $2,785
Heat risk 5/10 · Moderate
- Hot days now (above 105°F)
- 7 days/yr
- Hot days in 30 yrs
- 20 days/yr
Wind risk 2/10 · Minimal
- Chance of severe wind over 30 yrs
- 2.0%
Air-quality risk 1/10 · Minimal
- Unhealthy air days now
- 0 days/yr
- Unhealthy air days in 30 yrs
- 0 days/yr
Risk factors via First Street. Map © Google.
Why this score? — see what drove the D grade
The composite is a weighted blend of 9 inputs, each scored 0–100. Each bar is that input's sub-score; the figure is the points it added to the 100-point composite (weight × sub-score).
- Cash flow +13.7/30.0
- ARV discount +7.5/15.0
- Livability +4.2/5.0
- DSCR +4.1/10.0
- Schools +4.1/10.0
- 1% rule +3.0/10.0
- Rent growth +3.0/5.0
- Condition / age +2.5/5.0
- Appreciation +0.0/10.0
$212,500
🖨 Deal sheet (PDF) 📄 Offer letter ✓ Due diligence
Listing remarks
Excellent starter home or investment property in West Fayetteville! Freshly remodeled townhome (3 bedroom, 2 bathroom, 1 car garage) with Newer Roof, new flooring, paint, counter tops, refinished cabinets, and new lighting & plumbing fixtures throughout. Brand new kitchen appliances including Refrigerator! Washer/dryer hookups. Kitchen Pantry. Conveniently located less than 2 miles from I-49 and only 3.5 miles to the UofA. Close to bus routes, schools, shopping, restaurants, and all amenities Fayetteville. Come see this property today! Listing is for the single townhome unit on the left side. The unit on the right side (1391 N Boxley Ave) is also for sale separately, see ML#1319514. A
Key facts
- New lighting
- Remodeled townhome
- Newer roof
Tags
Neighborhood map
What this means for you Summary
Snapshot
- This is a 3-bed/2.0-bath condo listed at $212k.
Deal economics
- At list price, monthly cash flow is $16 ($192/yr) — positive.
- The deal already cash-flows at list — no discount required.
- To meet the 1% rule (rent ≥ 1% of price), the offer needs to be $169k (20.3% below list).
- Recommended offer: $169k (20.3% below list) — sets the bar for 1% rule.
- Cap rate 6.4% vs local median 3.5% in Fayetteville — top-decile yield for the area; either an underpriced asset or a hidden risk that comps aren't pricing in. Stress-test before assuming the spread holds.
Location & tenants
- Location reads 83/100 on livability (#3 in AR, #871 nationally) — a professional / high-income tenant draw. Strengths: amenities A+, commute A+, health & safety A+; Watch: employment D+, crime D-.
- Fayetteville School District (urban): math 50% / reading 49% proficiency, ranked #19 of 238 in AR (top 8%) — families likely to look elsewhere, expect single-tenant / working-renter base with shorter leases.
- Zoned schools: Holcomb Elementary School (math 65% / reading 52%, grade B-, #45 of 454 statewide, top 10%, 643 students, 31% FRL); Ramay Junior High School (math 39% / reading 39%, grade F, #102 of 201 statewide, top 52%, 645 students, 54% FRL); Fayetteville High School East (math 41% / reading 50%, grade D-, #24 of 292 statewide, top 9%, 2,685 students, 27% FRL) — zoned schools at 37% FRL track the district average.
- Market conditions: Rents rising (+2.2%/yr); 550 active listings in the ZIP; 40 comparable units currently listed for rent nearby; rentals at typical pace (median 25d on market — plan ~3-4 weeks tenant-placement turnaround); solid renter incomes; 3,494 units permitted in Washington County in 2024 (1,497 in 5+ unit buildings).
Forward outlook
- Local home prices are declining (-3.0%/yr); year-one equity from $1k of loan paydown is wiped out by about $6k of value loss. Plan a longer hold.
- Washington County population projected at +47% by 2050 — long-run rental-demand tailwind backs the buy-and-hold thesis.
Negotiation context
- It's been on market 236 days — a 12% lower offer ($187k) is reasonable based on typical stale-listing flexibility.
- 3 sale attempts with the ask held roughly flat each time — persistent listings suggest the price (not the market) is what's stuck; bring a comps-based counter.
Risks & watch-outs
- Climate carrying-cost: moderate wildfire risk; extreme-heat days projected 7→20/yr by 2055 (HVAC capex compounding) — expect insurance premiums to compound above CPI over the hold.
Questions for the listing agent
- It's been on market 236 days. Have you received any prior offers? Is the seller open to a 20% concession, seller financing, or rate buy-down credit?
- What does the HOA fee cover, when was the last increase, and are there any pending special assessments or reserve-fund shortfalls?
- Any open or pending special assessments — roof, HVAC, plumbing, elevator, façade? What's the per-unit balance and payoff schedule, and is the seller paying it off at close or rolling it to the buyer?
- Why hasn't it sold? Are there any deal-killer items the seller is aware of (foundation, flood, title, zoning, code violations)?
- Is there a deadline driving the sale (1031 exchange, divorce, estate, relocation)? That informs how much negotiation room exists.
- Schools are B-rated — typically a magnet for longer-tenancy family renters. What's the average tenant stay here, and is there a school-zone premium baked into asking?
- Crime grade is D in this area — have there been break-ins, vandalism, or insurance claims at this property in the last 3 years? What carrier currently insures it and at what premium?
- The area grade is low — what's the realistic commute time and amenity access for the typical tenant pool here? Any planned neighborhood developments (good or bad) we should know about?
- What's the average days-on-market for RENTAL listings here right now (not sales)? A rising rental-DOM trend means longer vacancies and softer asking-rent achievability than the comps imply.
- What's the recent tenant-quality profile in this submarket — average credit score on applications, eviction rate, late-payment / NSF rate, and stable-employment percentage? A property-management company in the area should have these aggregated.
- How much new apartment / multifamily construction is in the pipeline within 1–3 miles? Heavy new supply (>2% of stock underway) typically softens rents 12–24 months out; light construction supports rent growth.
Investment metrics
- 1% rule
- 0.80% ✗
- Cap rate
- 6.38%
- Cash-on-cash
- 0.32%
- DSCR
- 1.01
- GRM
- 10.5
CMA / ARV
No comps found within radius.
Projected returns pro-forma
-3.0% appreciation · 2.17% rent growth · sell at horizon
- IRR
- -16.7%
- Equity multiple
- 0.41×
- Total profit
- $-34,881
- Equity at exit
- $31,684
- IRR
- -10.0%
- Equity multiple
- 0.41×
- Total profit
- $-34,983
- Equity at exit
- $18,373
Cash invested: $59,500 (down + closing). Projections, not guarantees.
Landlord ↔ Tenant lean methodology
- Overall (STATE)
- 92 Strongly Landlord-Friendly
- State Arkansas
- 92 Strongly Landlord-Friendly · R+14
- County
- — inherits STATE
- City
- — inherits STATE
ZIP-level market 72704
- Home prices YoY
- -20.2%
- Rents YoY
- 2.2%
- Active inventory
- 550
- Price-to-rent
- 10.5×
Monthly cashflow live
- Estimated rent
- $1,693 high interval (Pro) →
- Mortgage (P&I)
- −$1,114
- Tax from tax record
- −$116 /mo · $1,390/yr
- Insurance
- −$89
- HOA
- −$3
- Vacancy / Maint / Mgmt
- −$356
- Net cashflow
- $16
Break-even live
Sensitivity live
| Price | -10% $136 | -5% $76 | +0% $16 | +5% $-44 | +10% $-104 |
|---|---|---|---|---|---|
| Rent | -10% $-118 | -5% $-51 | +0% $16 | +5% $83 | +10% $150 |
| Rate | -1.0pp $123 | -0.5pp $70 | base $16 | +0.5pp $-39 | +1.0pp $-95 |
UW: 25.0% down · 7.5% · 30yr · 1.5% tax · 5.0% vac · 8.0% maint · 8.0% mgmt
Financing live
Cash to close
- Down payment
- $53,125
- Closing costs
- $6,375
- Reserves months
- —
- Total cash needed
- —
Loan-product check · same deal, 3 products live
Conventional
25% down · 7.5% · 30yr
- Down + closing
- —
- Monthly P&I
- —
- Monthly cashflow
- —
- DSCR
- —
- Eligible?
- —
Personal DTI + credit; lowest rate.
DSCR
20% down · 8.5% · 30yr
- Down + closing
- —
- Monthly P&I
- —
- Monthly cashflow
- —
- DSCR
- —
- Eligible?
- —
No personal income docs; deal must DSCR.
Hard money
10% down · 12.0% · 12mo
- Down + closing
- —
- Monthly P&I
- —
- Monthly cashflow
- —
- DSCR
- —
- Eligible?
- —
Short-term bridge; refi at stabilization.
Rent comps 40 comps
| Address | Beds | Baths | Sqft | Rent | $/sqft | DOM | Units | Dist |
|---|---|---|---|---|---|---|---|---|
| 4530 W Franciscan Trl Fayetteville, AR | 2.0 | 1.0 | 800 | $1,195 | $1.49 | 25d | 1 | 0.11mi |
| 4520 W Franciscan Trl Fayetteville, AR | 2.0 | 1.5 | 997 | $1,500 | $1.50 | 45d | 1 | 0.12mi |
| 4418 Acoma St Fayetteville, AR | 2.0 | 1.5 | 998 | $1,350 | $1.35 | 16d | 1 | 0.20mi |
| 4451 Acoma St Unit 4451 Fayetteville, AR | 2.0 | 1.0 | 840 | $1,150 | $1.37 | 25d | 1 | 0.22mi |
| 1355 N Plum Tree Dr Fayetteville, AR | 3.0 | 2.0 | 1255 | $1,675 | $1.33 | 45d | 1 | 0.33mi |
| 999 N Crater Ave Unit 1 Fayetteville, AR | 3.0 | 2.5 | 1500 | $1,695 | $1.13 | 25d | 1 | 0.56mi |
| 987 N Crater Ave #1 Fayetteville, AR | 3.0 | 2.5 | 1500 | $1,695 | $1.13 | 15d | 1 | 0.57mi |
| 802 N Crater Ave Unit 1 Fayetteville, AR | 3.0 | 2.5 | 1500 | $1,695 | $1.13 | 25d | 1 | 0.60mi |
| 827 N Crater Ave Unit 1 Fayetteville, AR | 3.0 | 2.5 | 1500 | $1,695 | $1.13 | 25d | 1 | 0.61mi |
| 805 N Crater Ave Unit 1 Fayetteville, AR | 3.0 | 2.5 | 1500 | $1,695 | $1.13 | 25d | 1 | 0.62mi |
| 3600 W Player Ln Fayetteville, AR | 1.0–2.0 | 1.0–2.0 | 818 | $1,125 | $1.37 | 45d | 1 | 0.62mi |
| 755 N Crater Ave Unit 1 Fayetteville, AR | 3.0 | 2.5 | 1500 | $1,695 | $1.13 | 25d | 1 | 0.63mi |
| 1314 N Tradition Ave Fayetteville, AR | 3.0 | 2.0 | 1368 | $1,670 | $1.22 | 45d | 1 | 0.79mi |
| 158-426 N Broyles Rd Fayetteville, AR | 3.0 | 2.0 | 1408 | $1,875 | $1.33 | 15d | 1 | 0.96mi |
| 3493 W Chevaux Dr Fayetteville, AR | 2.0 | 2.5 | 1299 | $1,500 | $1.15 | 45d | 1 | 0.97mi |
| 3468 W Yale St Fayetteville, AR | 3.0 | 2.0 | 1320 | $1,795 | $1.36 | 25d | 1 | 1.01mi |
| 5707 W Michael Cole Dr Fayetteville, AR | 2.0 | 2.0 | 950 | $1,395 | $1.47 | 45d | 1 | 1.04mi |
| 5709 W Michael Cole Dr Unit 5707 Fayetteville, AR | 2.0 | 2.0 | 950 | $1,395 | $1.47 | 45d | 1 | 1.05mi |
| 4476 W Anthem Dr Fayetteville, AR | 3.0 | 2.0 | 1483 | $1,875 | $1.26 | 16d | 1 | 1.07mi |
| 3690 W Mountain View Dr Fayetteville, AR | 3.0 | 2.0 | 1500 | $2,100 | $1.40 | 25d | 1 | 1.09mi |
| 4441 W Anthem Dr Fayetteville, AR | 3.0 | 2.0 | 1358 | $1,850 | $1.36 | 45d | 1 | 1.10mi |
| 4405 W Anthem Dr Fayetteville, AR | 3.0 | 2.0 | 1353 | $2,200 | $1.63 | 25d | 1 | 1.11mi |
| 591 N Cresswell Dr Fayetteville, AR | 3.0 | 2.0 | 1356 | $1,695 | $1.25 | 15d | 1 | 1.11mi |
| 3033 W Mica St Fayetteville, AR | 3.0 | 2.0 | 1494 | $1,550 | $1.04 | 15d | 1 | 1.14mi |
| 3033 W Mica St Fayetteville, AR | 3.0 | 2.0 | 1494 | $1,600 | $1.07 | 23d | 1 | 1.14mi |
| 668 N Littleleaf Ter Unit 14 Fayetteville, AR | 2.0 | 2.5 | 1146 | $1,595 | $1.39 | 25d | 1 | 1.18mi |
| 1035 N Betty Jo Dr Fayetteville, AR | 2.0 | 1.5 | 1000 | $1,062 | $1.06 | 23d | 13 | 1.18mi |
| 4192 W Anthem Dr Fayetteville, AR | 3.0 | 2.0 | 1408 | $1,895 | $1.35 | 45d | 1 | 1.18mi |
| 642 N Littleleaf Ter Unit 33 Fayetteville, AR | 2.0 | 2.5 | 1146 | $1,595 | $1.39 | 45d | 1 | 1.21mi |
| 711 N Honey Locust Bnd Unit 61 Fayetteville, AR | 2.0 | 2.5 | 1146 | $1,625 | $1.42 | 45d | 1 | 1.21mi |
| 642 N Littleleaf Ter Unit 31 Fayetteville, AR | 2.0 | 2.5 | 1146 | $1,625 | $1.42 | 45d | 1 | 1.21mi |
| 995 N Brook Dr Unit 995 Fayetteville, AR | 2.0 | 2.0 | 1050 | $1,325 | $1.26 | 25d | 1 | 1.24mi |
| 687 N Betty Jo Dr Fayetteville, AR | 2.0 | 1.5 | 1015 | $1,095 | $1.08 | 16d | 1 | 1.26mi |
| 3191 W Oakfield St Unit 1229426P Fayetteville, AR | 2.0 | 2.0 | 839 | $3,978 | $4.74 | 16d | 1 | 1.26mi |
| 2650 N Snowball Dr Fayetteville, AR | 3.0 | 2.0 | 1291 | $1,995 | $1.55 | 16d | 1 | 1.27mi |
| 3130 W Telluride Dr Fayetteville, AR | 1.0–2.0 | 1.0–2.0 | 694 | $1,150 | $1.66 | 23d | 5 | 1.30mi |
| 605 N Betty Jo Dr Unit 6052 Betty Jo Fayetteville, AR | 2.0 | 1.0 | 1056 | $895 | $0.85 | 45d | 1 | 1.30mi |
| 3001 W Wedington Dr Fayetteville, AR | 1.0–4.0 | 1.0–2.5 | 1000 | $1,380 | $1.38 | 45d | 3 | 1.31mi |
| 189 S Geranium Ln Fayetteville, AR | 3.0 | 2.0 | 1463 | $1,950 | $1.33 | 45d | 1 | 1.33mi |
| 539 N Betty Jo Dr Unit 1 Fayetteville, AR | 2.0 | 1.5 | 1000 | $1,000 | $1.00 | 25d | 1 | 1.34mi |
HOA detail condo
- Monthly dues
- $3 · $36/yr
- Assessments
- None detected in remarks — confirm with the listing agent.
Listing history 8 events
-
2026-04-25status Pending
-
2025-12-29status Active
-
2025-12-28historical
-
2025-11-06status Active
-
2025-11-03status Pending
-
2025-10-08price $212,500
-
2025-08-28$215,000 Active
-
2010-05-06soldstatus $15,062,000
ⓘ Source: listings_history table (triggers on properties + properties_extension) + one-shot
backfill from property_details.listing_events for pre-trigger history.
Tax reassessment forecast AR · Resets to sale price
- Current annual tax
- $1,390 · $116/mo
- Projected year-2 tax
- $1,390 · $116/mo
- Expected delta
- $0/yr ($0/mo · 0.0%)
ⓘ Screening estimate from a state-policy table — verify with the county assessor before closing.
Climate risk First Street
- Flood 1/10 Low FEMA zone X (unshaded) · 0% chance over 30 yrs
- Wildfire 5/10 Major
- Heat 5/10 Major 7 d/yr ≥105°F today · 20 d/yr by 30 yrs out
- Wind 2/10 Low 2% chance of damaging wind over 30 yrs
- Air quality 1/10 Low 0 unhealthy d/yr today · 0 by 30 yrs out
Nearby sold comps map
Loading sold comps map…
Walkable amenities ~0.75 mi
Loading nearby amenities…
Taxation est. · year 1
- Rental income
- $20,321
- − Mortgage interest
- −$11,903
- − Property taxes
- −$1,390
- − Insurance
- −$1,062
- − Repairs & maintenance
- −$1,626
- − Management
- −$1,626
- − HOA
- −$36
- − Depreciation
- −$6,182
- Taxable loss
- −$3,504
- Est. tax savings @ 24.0%
- +$841
- After-tax cash flow
- $1,033/yr
For passive investors: Depreciation is non-cash, so a rental often shows a tax loss while cash-flowing — sheltering income. Rental losses are passive: they offset passive income freely, and up to $25,000/yr can offset ordinary (W-2) income if you actively participate and your MAGI is under $100k (phasing out to $0 by $150k); unused losses carry forward. On sale, claimed depreciation is recaptured at up to 25%, and gains may owe capital-gains tax (a 1031 exchange can defer both). Figures are a year-1 estimate at your 24.0% rate — not tax advice; consult a CPA.
Schools (NCES district)
- District
- Fayetteville School District
- NCES district ID
- 0506120
- Math proficiency
- 50% ▼ -11.00%
- Reading proficiency
- 49% ▼ -8.00%
- Median HH income
- $39,595
- Composite
- 41.39/100
- National rank
- #3477
- State rank
- #19 of 238 in AR
Livability — Fayetteville
- Score
- 83/100
- State rank
- #3
- US rank
- #871
Category grades
Schools grade is shown separately in the Schools card above.
Census & demographics
- Census place
- Fayetteville, AR
- County
- Washington County · 252,056 people
- City population
- 910
- Metro
- Fayetteville-Springdale-Rogers, AR
- Population (ZIP)
- 32,497
- Household income
- $96,014
- Rent vs Own
- Severe rent burden
- 883.0
Population outlook (Washington County) Hauer SSP2
- Today (2025)
- 271,748 people
- By 2030
- 296,414 · +9.1%
- By 2040
- 346,874 · +27.6%
- By 2050
- 398,552 · +46.7%
- By 2075
- 523,309 · +92.6%
- By 2100
- 615,280 · +126.4%
Race, ethnicity, and origin ACS 2023
- Neighborhood character
- Predominantly White (77%)
- Race & ethnicity
- White 77% Two or more races 14% Hispanic / Latino 7% Black 3% Asian 2%
- Hispanic origin (detail)
- Mexican 5%
- Common ancestry
- Slovak 3% Italian 3% Lithuanian 2%
- Foreign-born
- 5% · Canada
- Languages at home
- 94% English-only · Spanish 3% Other Indo-European 2% Other Asian/Pacific 1%
Political lean MEDSL · Washington
- 2024 margin
- Lean R (+6.7) · D 45.1% · R 51.7% · Other 3.2%
- 2008→2024 swing
- +6.4pp toward D · 2008: -13.1pp · 2024: -6.7pp
- All cycles
- 2024: R+6.7 2020: R+3.9 2016: R+10.4 2012: R+16.3 2008: R+13.1
Not yet ingested
- Civics
- —
Market trends
- HPI YoY
- ▼ -73.44%
- Current HPI
- 289.7478
- Rent YoY
- ▲ 2.17%
- Metro
- Fayetteville-Springdale-Rogers, AR
- State GDP YoY
- ▲ 3.80%
- F500 in state
- 10
Industry mix (Fortune 500 HQ in AR)
| Industry | F500 HQs | Revenue |
|---|---|---|
| Retail | 1 | $681B |
|
||
| Food / Agriculture | 1 | $53B |
|
||
| Retail / Energy | 1 | $22B |
|
||
| Transportation / Logistics | 1 | $12B |
|
||
| Energy | 1 | $4B |
|
||
Price history
-98.6% since first listed8 events — show timeline
- 2026-04-25 Pending — NWARMLS
- 2025-12-29 Relisted — NWARMLS
- 2025-12-28 Delisted — NWARMLS
- 2025-11-06 Relisted — NWARMLS
- 2025-11-03 Pending — NWARMLS
- 2025-10-08 Price Changed $212,500 NWARMLS
- 2025-08-28 Listed $215,000 NWARMLS
- 2010-05-06 Sold (Public Records) $15,062,000 Public Records
Property tax history
+7.5%/yrLatest (2025): $1,390 · +8.3% YoY. Source: county tax records.
Cash-flow waterfall
monthlySold comps — $/sqft
last 12 mo · ≤1 miLoading sold comps…