901 Colony Point Cir · Pembroke Pines, FL
Flood risk 1/10 · Minimal
- FEMA flood zone
- X (shaded)
- Chance of flooding over 30 yrs
- 0.0%
- Est. flood insurance / yr
- $507 – $1,088
Fire risk 1/10 · Minimal
- Est. fire insurance / yr
- $947 – $1,759
Heat risk 9/10 · Severe
- Hot days now (above 105°F)
- 7 days/yr
- Hot days in 30 yrs
- 27 days/yr
Wind risk 10/10 · Severe
- Chance of severe wind over 30 yrs
- 99.0%
Air-quality risk 2/10 · Minimal
- Unhealthy air days now
- 2 days/yr
- Unhealthy air days in 30 yrs
- 2 days/yr
Risk factors via First Street. Map © Google.
Why this score? — see what drove the B grade
The composite is a weighted blend of 9 inputs, each scored 0–100. Each bar is that input's sub-score; the figure is the points it added to the 100-point composite (weight × sub-score).
- Cash flow +30.0/30.0
- DSCR +10.0/10.0
- 1% rule +9.5/10.0
- ARV discount +7.5/15.0
- Livability +4.2/5.0
- Schools +4.1/10.0
- Rent growth +2.9/5.0
- Condition / age +2.5/5.0
- Appreciation +0.0/10.0
$199,900
🖨 Deal sheet (PDF) 📄 Offer letter ✓ Due diligence
Listing remarks MLS
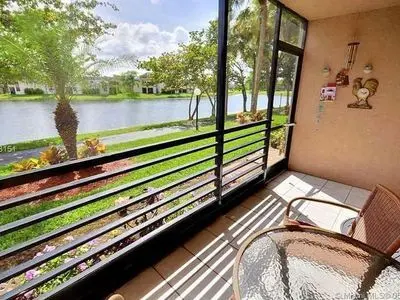
This 3 bedroom 2 bath single family home is located in Cinnamon Place. It features a large fenced backyard with a shed. There is also a screened patio. This is a short sale that is subject to lender approval.
Key facts
- Lake view
- Club house
- Walk in closet
Tags
Neighborhood map
What this means for you Summary
Snapshot
- This is a 3-bed/1.0-bath single-family listed at $200k.
Deal economics
- At list price, monthly cash flow is $944 ($11k/yr) — positive.
- The deal already cash-flows at list — no discount required.
- Meets the 1% rule at list price ($3k rent vs $200k).
- Cap rate 12.0% vs local median 4.0% in Pembroke Pines — top-decile yield for the area; either an underpriced asset or a hidden risk that comps aren't pricing in. Stress-test before assuming the spread holds.
Location & tenants
- Location reads 83/100 on livability (#54 in FL, #933 nationally) — a professional / high-income tenant draw. Strengths: housing A+, health & safety A+, schools A-; Watch: amenities D+, cost of living D+.
- Broward (suburban): math 42% / reading 53% proficiency, ranked #46 of 73 in FL (top 63%) — families likely to look elsewhere, expect single-tenant / working-renter base with shorter leases.
- Market conditions: Rents rising (+1.6%/yr); 222 active listings in the ZIP; 40 comparable units currently listed for rent nearby; rentals at typical pace (median 25d on market — plan ~3-4 weeks tenant-placement turnaround); solid renter incomes; 2,111 units permitted in Broward County in 2024 (1,265 in 5+ unit buildings).
- This rent runs 39% of the median local income ($89k/yr) — at the standard rent-burdened threshold; future hikes will face affordability resistance.
Forward outlook
- Local home prices are declining (-3.0%/yr); year-one equity from $1k of loan paydown is wiped out by about $6k of value loss. Plan a longer hold.
- Broward County population projected at +34% by 2050 — long-run rental-demand tailwind backs the buy-and-hold thesis.
- At projected returns (-3.0% appreciation + 1.6% rent growth), your $56k cash investment doubles in ~7 years — after that, you're playing with house money.
Negotiation context
- Only 14 days on market — expect competitive offers; lowballing is unlikely to land.
- 3 sale attempts since 17y ago with the ask held roughly flat each time — persistent listings suggest the price (not the market) is what's stuck; bring a comps-based counter.
Risks & watch-outs
- Climate carrying-cost: severe wind risk, 99% chance of damaging wind over 30y; extreme-heat days projected 7→27/yr by 2055 (HVAC capex compounding) — expect insurance premiums to compound above CPI over the hold.
Questions for the listing agent
- Is there a deadline driving the sale (1031 exchange, divorce, estate, relocation)? That informs how much negotiation room exists.
- Schools are A-rated — typically a magnet for longer-tenancy family renters. What's the average tenant stay here, and is there a school-zone premium baked into asking?
- What's the average days-on-market for RENTAL listings here right now (not sales)? A rising rental-DOM trend means longer vacancies and softer asking-rent achievability than the comps imply.
- What's the recent tenant-quality profile in this submarket — average credit score on applications, eviction rate, late-payment / NSF rate, and stable-employment percentage? A property-management company in the area should have these aggregated.
- How much new for-sale + rental construction is in the pipeline within 1–3 miles? Heavy new supply typically softens prices + rents 12–24 months out; constrained supply supports both.
Investment metrics
- 1% rule
- 1.45% ✓
- Cap rate
- 11.96%
- Cash-on-cash
- 20.24%
- DSCR
- 1.90
- GRM
- 5.8
CMA / ARV
- ARV (on-the-fly)
- $411,419
- Comps found
- 2
Show comp detail 2 sales within ~0.75 mi
| Address | Dist | Beds/Ba | Sqft | Sold | Price | $/sf | Match |
|---|---|---|---|---|---|---|---|
| 11654 NW 11th St #11654 | 0.38mi | 2/2.0 (-1) | 972 (-12%) | 3mo | $363,000 | $373 | 51 |
| 11687 NW 11th St | 0.35mi | 3/2.5 | 1,268 (+15%) | 20mo | $450,000 | $355 | 36 |
Match score weights: distance 35% · size 25% · config 20% · recency 20%. Top-matched comps best support the ARV.
Projected returns pro-forma
-3.0% appreciation · 1.58% rent growth · sell at horizon
- IRR
- 10.9%
- Equity multiple
- 1.42×
- Total profit
- $23,670
- Equity at exit
- $29,806
- IRR
- 18.8%
- Equity multiple
- 2.46×
- Total profit
- $81,852
- Equity at exit
- $17,284
Cash invested: $55,972 (down + closing). Projections, not guarantees.
Landlord ↔ Tenant lean methodology
- Overall (STATE)
- 87 Strongly Landlord-Friendly
- State Florida
- 87 Strongly Landlord-Friendly · R+3
- County
- — inherits STATE
- City
- — inherits STATE
ZIP-level market 33026
- Rents YoY
- 1.6%
- Active inventory
- 222
- Price-to-rent
- 5.8×
Monthly cashflow live
- Estimated rent
- $2,891 high interval (Pro) →
- Mortgage (P&I)
- −$1,048
- Tax from tax record
- −$209 /mo · $2,504/yr
- Insurance
- −$83
- HOA
- −$0
- Vacancy / Maint / Mgmt
- −$607
- Net cashflow
- $944
Break-even live
Sensitivity live
| Price | -10% $1,057 | -5% $1,000 | +0% $944 | +5% $887 | +10% $831 |
|---|---|---|---|---|---|
| Rent | -10% $715 | -5% $830 | +0% $944 | +5% $1,058 | +10% $1,172 |
| Rate | -1.0pp $1,045 | -0.5pp $995 | base $944 | +0.5pp $892 | +1.0pp $839 |
UW: 25.0% down · 7.5% · 30yr · 1.5% tax · 5.0% vac · 8.0% maint · 8.0% mgmt
Financing live
Cash to close
- Down payment
- $49,975
- Closing costs
- $5,997
- Reserves months
- —
- Total cash needed
- —
Loan-product check · same deal, 3 products live
Conventional
25% down · 7.5% · 30yr
- Down + closing
- —
- Monthly P&I
- —
- Monthly cashflow
- —
- DSCR
- —
- Eligible?
- —
Personal DTI + credit; lowest rate.
DSCR
20% down · 8.5% · 30yr
- Down + closing
- —
- Monthly P&I
- —
- Monthly cashflow
- —
- DSCR
- —
- Eligible?
- —
No personal income docs; deal must DSCR.
Hard money
10% down · 12.0% · 12mo
- Down + closing
- —
- Monthly P&I
- —
- Monthly cashflow
- —
- DSCR
- —
- Eligible?
- —
Short-term bridge; refi at stabilization.
Rent comps 40 comps
| Address | Beds | Baths | Sqft | Rent | $/sqft | DOM | Units | Dist |
|---|---|---|---|---|---|---|---|---|
| 1111 N Hiatus Rd Pembroke Pines, FL | 3.0 | 2.5 | 1319 | $2,300 | $1.74 | 25d | 1 | 0.21mi |
| 10951 N Lakeview Dr Pembroke Pines, FL | 2.0 | 2.0 | 1318 | $3,000 | $2.28 | 25d | 1 | 0.29mi |
| 11313 NW 15th St Pembroke Pines, FL | 2.0 | 2.0 | 1318 | $3,399 | $2.58 | 18d | 1 | 0.29mi |
| 1424 NW 113th Way Pembroke Pines, FL | 2.0 | 1.5 | 1482 | $3,000 | $2.02 | 25d | 1 | 0.29mi |
| 11705 NW 12th St Pembroke Pines, FL | 3.0 | 2.5 | 1494 | $3,600 | $2.41 | 25d | 1 | 0.34mi |
| 11804 NW 13th St Unit 11804 Pembroke Pines, FL | 3.0 | 2.0 | 1304 | $3,500 | $2.68 | 3d | 1 | 0.35mi |
| 1411 W Fairway Rd Pembroke Pines, FL | 3.0 | 2.0 | 1323 | $3,000 | $2.27 | 13d | 1 | 0.37mi |
| 11838 NW 13th St Pembroke Pines, FL | 3.0 | 2.0 | 1304 | $3,650 | $2.80 | 6d | 1 | 0.43mi |
| 11761 NW 12th St Pembroke Pines, FL | 3.0 | 2.0 | 1304 | $3,799 | $2.91 | 25d | 1 | 0.44mi |
| 11905 NW 11th St #11905 Pembroke Pines, FL | 2.0 | 2.0 | 900 | $2,500 | $2.78 | 25d | 1 | 0.45mi |
| 11931 NW 11th St #11931 Pembroke Pines, FL | 2.0 | 2.0 | 900 | $2,400 | $2.67 | 6d | 1 | 0.45mi |
| 10723 NW 10th St Pembroke Pines, FL | 3.0 | 2.5 | 1399 | $3,100 | $2.22 | 25d | 1 | 0.49mi |
| 11992 NW 11th St #11992 Pembroke Pines, FL | 2.0 | 2.0 | 900 | $2,400 | $2.67 | 8d | 1 | 0.51mi |
| 11202 Taft St #11202 Pembroke Pines, FL | 2.0 | 2.0 | 1205 | $2,300 | $1.91 | 25d | 1 | 0.51mi |
| 11969 NW 11th St #11969 Pembroke Pines, FL | 2.0 | 2.0 | 970 | $2,400 | $2.47 | 25d | 1 | 0.52mi |
| 11969 NW 11th St #11969 Pembroke Pines, FL | 2.0 | 2.0 | 970 | $2,400 | $2.47 | 3d | 1 | 0.52mi |
| 1014 NW 107th Ave Pembroke Pines, FL | 2.0 | 1.5 | 1044 | $2,600 | $2.49 | 25d | 1 | 0.52mi |
| 12060 NW 11th St #12060 Pembroke Pines, FL | 2.0 | 2.0 | 970 | $2,350 | $2.42 | 8d | 1 | 0.56mi |
| 120 NW 108th Ter Pembroke Pines, FL | 1.0–3.0 | 1.0–2.0 | 1101 | $2,939 | $2.67 | 4d | 10 | 0.59mi |
| 101 SW 117th Ave #7101 Pembroke Pines, FL | 2.0 | 2.0 | 1130 | $2,200 | $1.95 | 2d | 1 | 0.62mi |
| 131 SW 117th Ave #8101 Pembroke Pines, FL | 2.0 | 2.0 | 1130 | $2,350 | $2.08 | 20d | 1 | 0.65mi |
| 131 SW 117th Ave #8307 Pembroke Pines, FL | 2.0 | 2.0 | 1130 | $2,380 | $2.11 | 25d | 1 | 0.65mi |
| 730 NW 106th Ter #730 Pembroke Pines, FL | 2.0 | 2.5 | 1224 | $2,500 | $2.04 | 25d | 1 | 0.65mi |
| 1072 NW 106th Ter #205 Pembroke Pines, FL | 2.0 | 2.0 | 806 | $2,100 | $2.61 | 18d | 1 | 0.65mi |
| 971 NW 122nd Ter Pembroke Pines, FL | 2.0 | 2.0 | 1368 | $2,800 | $2.05 | 8d | 1 | 0.66mi |
| 1061 NW 122nd Ter Pembroke Pines, FL | 2.0 | 2.0 | 1368 | $2,500 | $1.83 | 25d | 1 | 0.66mi |
| 11361 SW 3rd St #11361 Pembroke Pines, FL | 2.0 | 2.0 | 978 | $2,450 | $2.51 | 15d | 1 | 0.67mi |
| 11700 SW 1st St #3207 Pembroke Pines, FL | 3.0 | 2.0 | 1330 | $3,000 | $2.26 | 19d | 1 | 0.67mi |
| 151 SW 117th Ave #9308 Pembroke Pines, FL | 2.0 | 2.0 | 1130 | $2,650 | $2.35 | 25d | 1 | 0.68mi |
| 11601 SW 2nd St #21108 Pembroke Pines, FL | 2.0 | 2.0 | 1130 | $2,400 | $2.12 | 25d | 1 | 0.68mi |
| 730 NW 106th Ave #730 Pembroke Pines, FL | 2.0 | 2.5 | 1224 | $2,550 | $2.08 | 25d | 1 | 0.68mi |
| 140 SW 117th Ave #4301 Pembroke Pines, FL | 2.0 | 2.0 | 1130 | $2,400 | $2.12 | 13d | 1 | 0.68mi |
| 10609 NW 8th St Pembroke Pines, FL | 2.0 | 2.5 | 1224 | $2,700 | $2.21 | 15d | 1 | 0.69mi |
| 12266 NW 10th St Pembroke Pines, FL | 3.0 | 2.0 | 1432 | $2,999 | $2.09 | 25d | 1 | 0.69mi |
| 11631 SW 2nd St #20302 Pembroke Pines, FL | 2.0 | 2.0 | 1130 | $2,300 | $2.04 | 6d | 1 | 0.69mi |
| 11631 SW 2nd St #20302 Pembroke Pines, FL | 2.0 | 2.0 | 1130 | $2,375 | $2.10 | 18d | 1 | 0.69mi |
| 201 SW 116th Ave Unit 108 Pembroke Pines, FL | 3.0 | 2.0 | 1330 | $2,900 | $2.18 | 25d | 1 | 0.69mi |
| 10633 NW 10th St #102 Pembroke Pines, FL | 2.0 | 2.0 | 806 | $2,200 | $2.73 | 25d | 1 | 0.69mi |
| 10633 NW 10th St #102 Pembroke Pines, FL | 2.0 | 2.0 | 806 | $2,200 | $2.73 | 11d | 1 | 0.69mi |
| 10613 NW 11th St #205 Pembroke Pines, FL | 2.0 | 2.0 | 806 | $2,100 | $2.61 | 25d | 1 | 0.69mi |
Listing history 11 events
-
2026-05-12$199,900 Active
-
2026-01-12soldstatus $345,000
-
2013-07-23historical
-
2013-06-19$180,000 Active
-
2010-01-27soldstatus $145,000
-
2010-01-26soldstatus $145,000 208-char remark
Show marketing remark (208 chars)
This 3 bedroom 2 bath single family home is located in Cinnamon Place. It features a large fenced backyard with a shed. There is also a screened patio. This is a short sale that is subject to lender approval.
-
2009-06-25$159,000 208-char remark
Show marketing remark (208 chars)
This 3 bedroom 2 bath single family home is located in Cinnamon Place. It features a large fenced backyard with a shed. There is also a screened patio. This is a short sale that is subject to lender approval.
-
2006-10-20soldstatus $300,000
-
1996-07-29soldstatus $93,000
-
1994-08-31soldstatus $92,000
-
1986-04-07soldstatus $70,500
ⓘ Source: listings_history table (triggers on properties + properties_extension) + one-shot
backfill from property_details.listing_events for pre-trigger history.
Tax reassessment forecast FL · Resets to sale price
- Current annual tax
- $2,504 · $209/mo
- Projected year-2 tax
- $2,504 · $209/mo
- Expected delta
- $0/yr ($0/mo · 0.0%)
ⓘ Screening estimate from a state-policy table — verify with the county assessor before closing.
Climate risk First Street
- Flood 1/10 Low FEMA zone X (shaded) · 0% chance over 30 yrs
- Wildfire 1/10 Low
- Heat 9/10 Extreme 7 d/yr ≥105°F today · 27 d/yr by 30 yrs out
- Wind 10/10 Extreme 99% chance of damaging wind over 30 yrs
- Air quality 2/10 Low 2 unhealthy d/yr today · 2 by 30 yrs out
Nearby sold comps map
Loading sold comps map…
Walkable amenities ~0.75 mi
Loading nearby amenities…
Taxation est. · year 1
- Rental income
- $34,696
- − Mortgage interest
- −$11,198
- − Property taxes
- −$2,504
- − Insurance
- −$1,000
- − Repairs & maintenance
- −$2,776
- − Management
- −$2,776
- − Depreciation
- −$5,815
- Taxable income
- $8,628
- Est. tax owed @ 24.0%
- −$2,071
- After-tax cash flow
- $9,256/yr
For passive investors: Depreciation is non-cash, so a rental often shows a tax loss while cash-flowing — sheltering income. Rental losses are passive: they offset passive income freely, and up to $25,000/yr can offset ordinary (W-2) income if you actively participate and your MAGI is under $100k (phasing out to $0 by $150k); unused losses carry forward. On sale, claimed depreciation is recaptured at up to 25%, and gains may owe capital-gains tax (a 1031 exchange can defer both). Figures are a year-1 estimate at your 24.0% rate — not tax advice; consult a CPA.
Schools (NCES district)
- District
- Broward
- NCES district ID
- 1200180
- Math proficiency
- 42% ▼ -18.00%
- Reading proficiency
- 53% ▼ -5.00%
- Median HH income
- $52,139
- Composite
- 40.88/100
- National rank
- #3621
- State rank
- #46 of 73 in FL
Livability — Pembroke Pines
- Score
- 83/100
- State rank
- #54
- US rank
- #933
Category grades
Schools grade is shown separately in the Schools card above.
Census & demographics
- Census place
- Pembroke Pines, FL
- County
- Broward County · 1,963,430 people
- City population
- 180,224
- Metro
- Miami-Fort Lauderdale-Pompano Beach, FL
- Population (ZIP)
- 31,172
- Household income
- $89,306
- Rent vs Own
- Severe rent burden
- 517.0
Population outlook (Broward County) Hauer SSP2
- Today (2025)
- 2,207,033 people
- By 2030
- 2,360,704 · +7.0%
- By 2040
- 2,661,208 · +20.6%
- By 2050
- 2,946,698 · +33.5%
- By 2075
- 3,602,273 · +63.2%
- By 2100
- 3,970,984 · +79.9%
Race, ethnicity, and origin ACS 2023
- Neighborhood character
- Diverse neighborhood (Simpson 0.69)
- Race & ethnicity
- Hispanic / Latino 41% White 35% Two or more races 23% Black 15% Asian 4%
- Hispanic origin (detail)
- Puerto Rican 5% Cuban 13% Dominican 2%
- Common ancestry
- Hispanic 5% Romanian 3% Scotch-Irish 2%
- Foreign-born
- 35% · Canada, Jamaica, China
- Languages at home
- 52% English-only · Spanish 35% French/Haitian/Cajun 5% Other Indo-European 4%
Political lean MEDSL · Broward
- 2024 margin
- D (+17.0) · D 58.0% · R 41.0%
- 2008→2024 swing
- -17.8pp toward R · 2008: 34.7pp · 2024: 17.0pp
- All cycles
- 2024: D+17.0 2020: D+29.8 2016: D+35.0 2012: D+34.9 2008: D+34.7
Not yet ingested
- Civics
- —
Market trends
- HPI YoY
- ▼ -248.72%
- Current HPI
- 380.7596
- Rent YoY
- ▲ 1.58%
- Metro
- Miami-Fort Lauderdale-Pompano Beach, FL
- State GDP YoY
- ▲ 3.28%
- F500 in state
- 36
Industry mix (Fortune 500 HQ in FL)
| Industry | F500 HQs | Revenue |
|---|---|---|
| Industrial Technology | 2 | $29B |
|
||
| Insurance | 2 | $17B |
|
||
| Retail | 1 | $60B |
|
||
| Technology Distribution | 1 | $58B |
|
||
| Homebuilding | 1 | $35B |
|
||
| Technology Manufacturing | 1 | $35B |
|
||
Price history
+183.5% since first listed11 events — show timeline
- 2026-05-12 Listed $199,900 FSBO.com
- 2026-01-12 Sold (Public Records) $345,000 Public Records
- 2013-07-23 Listing Removed — MARMLS
- 2013-06-19 Listed $180,000 MARMLS
- 2010-01-27 Sold (Public Records) $145,000 Public Records
- 2010-01-26 Sold (MLS) $145,000 MARMLS
- 2009-06-25 Listed $159,000 MARMLS
- 2006-10-20 Sold (Public Records) $300,000 Public Records
- 1996-07-29 Sold (Public Records) $93,000 Public Records
- 1994-08-31 Sold (Public Records) $92,000 Public Records
- 1986-04-07 Sold (Public Records) $70,500 Public Records
Property tax history
+1.4%/yrLatest (2025): $2,504 · +2.9% YoY. Source: county tax records.
Cash-flow waterfall
monthlySold comps — $/sqft
last 12 mo · ≤1 miLoading sold comps…