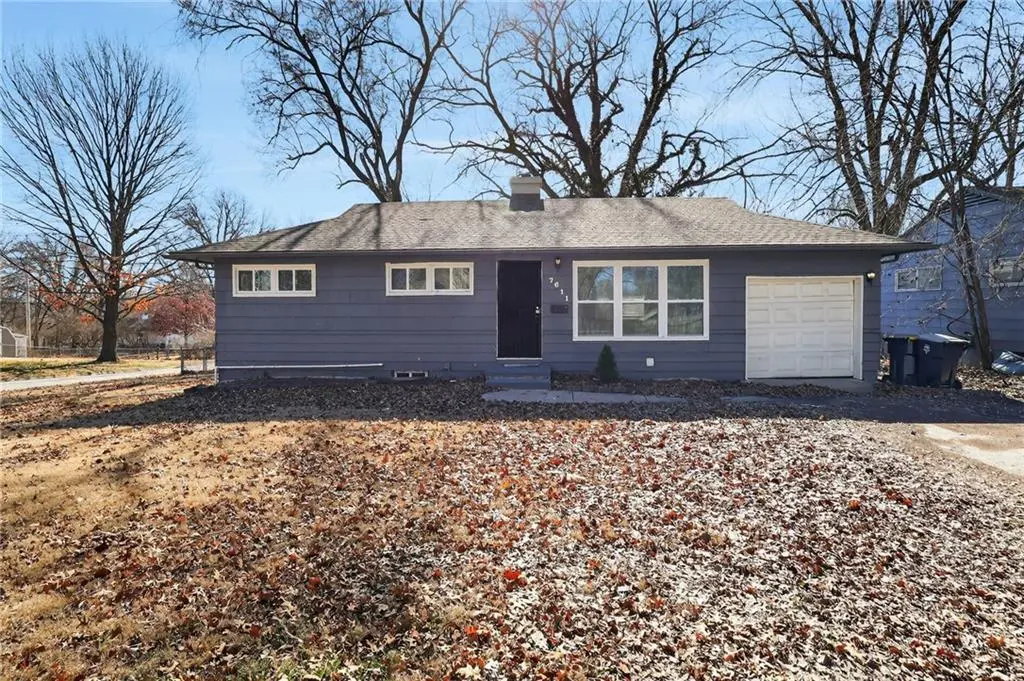
7611 E 107th St · Kansas City, MO
Flood risk 1/10 · Minimal
- FEMA flood zone
- X (unshaded)
- Chance of flooding over 30 yrs
- 0.0%
- Est. flood insurance / yr
- $473 – $860
Fire risk 1/10 · Minimal
- Est. fire insurance / yr
- $1,054 – $1,958
Heat risk 4/10 · Minor
- Hot days now (above 107°F)
- 7 days/yr
- Hot days in 30 yrs
- 16 days/yr
Wind risk 2/10 · Minimal
- Chance of severe wind over 30 yrs
- —
Air-quality risk 3/10 · Minor
- Unhealthy air days now
- 3 days/yr
- Unhealthy air days in 30 yrs
- 3 days/yr
Risk factors via First Street. Map © Google.
Why this score? — see what drove the C+ grade
The composite is a weighted blend of 9 inputs, each scored 0–100. Each bar is that input's sub-score; the figure is the points it added to the 100-point composite (weight × sub-score).
- Cash flow +25.5/30.0
- ARV discount +11.7/15.0
- DSCR +8.4/10.0
- 1% rule +6.1/10.0
- Rent growth +4.2/5.0
- Livability +3.9/5.0
- Condition / age +2.5/5.0
- Schools +1.1/10.0
- Appreciation +0.0/10.0
$139,900
🖨 Deal sheet (PDF) 📄 Offer letter ✓ Due diligence
Listing remarks MLS
Welcome to 7611 E 107th St, a 3-bedroom, 1 full-bath home located in Kansas City. This property offers a functional layout with comfortable living spaces and a full basement, providing additional storage and flexible-use space. The home features a living area with natural light, three bedrooms, and one full bathroom. The full basement offers potential for a variety of uses, such as storage, hobby space, or other permitted uses to fit your needs. Conveniently located near shopping, dining, schools, and major roadways, this property offers accessibility to everyday amenities.
Key facts
- Natural light
- Full basement
- Flexible-use space
Tags
Neighborhood map
What this means for you Summary
Snapshot
- This is a 3-bed/1.0-bath single-family listed at $140k.
Deal economics
- At list price, monthly cash flow is $325 ($4k/yr) — positive.
- The deal already cash-flows at list — no discount required.
- Meets the 1% rule at list price ($2k rent vs $140k).
- Recommended offer: $127k (9.0% below list) — sets the bar for market timing.
- Cap rate 9.1% vs local median 3.9% in Kansas City — top-decile yield for the area; either an underpriced asset or a hidden risk that comps aren't pricing in. Stress-test before assuming the spread holds.
Location & tenants
- Location reads 78/100 on livability (#28 in MO, #2,671 nationally) — a middle-class / working-renter tenant base. Strengths: amenities A+, commute A+, cost of living A+; Watch: schools C-, crime F.
- Hickman Mills C-1 (urban): math 8% / reading 18% proficiency, ranked #314 of 324 in MO (top 97%) — low school quality limits family demand, transient renter base, plan for 1-2y turnover; 78% free/reduced lunch — lower-income household profile, screen leases tightly.
- Market conditions: Rents rising fast (+6.7%/yr); 147 active listings in the ZIP; 36 comparable units currently listed for rent nearby; rentals at typical pace (median 25d on market — plan ~3-4 weeks tenant-placement turnaround); 4,002 units permitted in Jackson County in 2024 (2,271 in 5+ unit buildings).
- This rent runs 32% of the median local income ($58k/yr) — at the standard rent-burdened threshold; future hikes will face affordability resistance.
Forward outlook
- Local home prices are declining (-3.0%/yr); year-one equity from $967 of loan paydown is wiped out by about $4k of value loss. Plan a longer hold.
- Jackson County population projected at +4% by 2050 — modest demand growth; plan on rents tracking national, not racing it.
- At projected returns (-3.0% appreciation + 6.7% rent growth), your $39k cash investment doubles in ~8 years — after that, you're playing with house money.
Negotiation context
- It's been on market 98 days — a 9% lower offer ($127k) is reasonable based on typical stale-listing flexibility.
- 5 sale attempts since 26y ago; this cycle's ask has dropped $20k (13%) from the opening price — seller is motivated, your offer sets the floor, not the list.
Risks & watch-outs
- Watch-outs: built in 1955 — expect roof / HVAC / electrical / plumbing capex.
Questions for the listing agent
- It's been on market 98 days. Have you received any prior offers? Is the seller open to a 9% concession, seller financing, or rate buy-down credit?
- Built in 1955 — when were the roof, HVAC, electrical panel, plumbing, and water heater last replaced?
- What does the HOA fee cover, when was the last increase, and are there any pending special assessments or reserve-fund shortfalls?
- Why hasn't it sold? Are there any deal-killer items the seller is aware of (foundation, flood, title, zoning, code violations)?
- Is there a deadline driving the sale (1031 exchange, divorce, estate, relocation)? That informs how much negotiation room exists.
- Crime grade is F in this area — have there been break-ins, vandalism, or insurance claims at this property in the last 3 years? What carrier currently insures it and at what premium?
- What's the average days-on-market for RENTAL listings here right now (not sales)? A rising rental-DOM trend means longer vacancies and softer asking-rent achievability than the comps imply.
- What's the recent tenant-quality profile in this submarket — average credit score on applications, eviction rate, late-payment / NSF rate, and stable-employment percentage? A property-management company in the area should have these aggregated.
- How much new for-sale + rental construction is in the pipeline within 1–3 miles? Heavy new supply typically softens prices + rents 12–24 months out; constrained supply supports both.
Investment metrics
- 1% rule
- 1.11% ✓
- Cap rate
- 9.08%
- Cash-on-cash
- 9.94%
- DSCR
- 1.44
- GRM
- 7.5
CMA / ARV
- ARV (median comp)
- $154,157
- List price
- $139,900
- Delta
- -9.25%
- Verdict
- FAIR
- Comps
- 20 within 1.0 mi
Show comp detail 12 sales within ~0.75 mi
| Address | Dist | Beds/Ba | Sqft | Sold | Price | $/sf | Match |
|---|---|---|---|---|---|---|---|
| 7402 E 109th St | 0.32mi | 3/1.0 | 960 (+5%) | 0mo | $139,900 | $146 | 76 |
| 7905 E 112th St | 0.31mi | 3/1.0 | 864 (-5%) | 2mo | $120,000 | $139 | 75 |
| 10712 Blue Ridge Blvd | 0.44mi | 3/1.0 | 927 (+2%) | 2mo | $164,950 | $178 | 75 |
| 10803 Blue Ridge Blvd | 0.46mi | 3/1.0 | 888 (-3%) | 1mo | $150,000 | $169 | 74 |
| 8201 E 110th St | 0.47mi | 3/1.0 | 960 (+5%) | 1mo | $153,700 | $160 | 68 |
| 7119 E 111th Ter | 0.68mi | 3/1.0 | 912 (0%) | 2mo | $160,000 | $175 | 67 |
| 11017 Booth Ave | 0.67mi | 3/1.5 | 912 (0%) | 2mo | $95,000 | $104 | 65 |
| 10800 Ewing Ave | 0.63mi | 3/1.0 | 888 (-3%) | 4mo | $164,500 | $185 | 63 |
| 7405 E 112th St | 0.58mi | 4/1.0 (+1) | 936 (+3%) | 4mo | $125,000 | $134 | 60 |
| 7705 E 112th Ter | 0.57mi | 3/1.0 | 960 (+5%) | 6mo | $175,000 | $182 | 60 |
| 10427 Richmond Ave | 0.29mi | 3/2.0 | 1,029 (+13%) | 2mo | $59,900 | $58 | 59 |
| 7806 E 113th St E | 0.55mi | 4/1.5 (+1) | 936 (+3%) | 6mo | $119,900 | $128 | 58 |
Match score weights: distance 35% · size 25% · config 20% · recency 20%. Top-matched comps best support the ARV.
Projected returns pro-forma
-3.0% appreciation · 6.73% rent growth · sell at horizon
- IRR
- 2.6%
- Equity multiple
- 1.10×
- Total profit
- $4,048
- Equity at exit
- $20,860
- IRR
- 15.4%
- Equity multiple
- 2.45×
- Total profit
- $56,948
- Equity at exit
- $12,096
Cash invested: $39,172 (down + closing). Projections, not guarantees.
Landlord ↔ Tenant lean methodology
- Overall (STATE)
- 81 Strongly Landlord-Friendly
- State Missouri
- 81 Strongly Landlord-Friendly · R+10
- County
- — inherits STATE
- City
- — inherits STATE
ZIP-level market 64134
- Rents YoY
- 6.7%
- Active inventory
- 147
- Price-to-rent
- 7.5×
Monthly cashflow live
- Estimated rent
- $1,557 high interval (Pro) →
- Mortgage (P&I)
- −$734
- Tax from tax record
- −$111 /mo · $1,328/yr
- Insurance
- −$58
- HOA
- −$3
- Vacancy / Maint / Mgmt
- −$327
- Net cashflow
- $325
Break-even live
Sensitivity live
| Price | -10% $404 | -5% $364 | +0% $325 | +5% $285 | +10% $245 |
|---|---|---|---|---|---|
| Rent | -10% $202 | -5% $263 | +0% $325 | +5% $386 | +10% $448 |
| Rate | -1.0pp $395 | -0.5pp $360 | base $325 | +0.5pp $288 | +1.0pp $251 |
UW: 25.0% down · 7.5% · 30yr · 1.5% tax · 5.0% vac · 8.0% maint · 8.0% mgmt
Financing live
Cash to close
- Down payment
- $34,975
- Closing costs
- $4,197
- Reserves months
- —
- Total cash needed
- —
Loan-product check · same deal, 3 products live
Conventional
25% down · 7.5% · 30yr
- Down + closing
- —
- Monthly P&I
- —
- Monthly cashflow
- —
- DSCR
- —
- Eligible?
- —
Personal DTI + credit; lowest rate.
DSCR
20% down · 8.5% · 30yr
- Down + closing
- —
- Monthly P&I
- —
- Monthly cashflow
- —
- DSCR
- —
- Eligible?
- —
No personal income docs; deal must DSCR.
Hard money
10% down · 12.0% · 12mo
- Down + closing
- —
- Monthly P&I
- —
- Monthly cashflow
- —
- DSCR
- —
- Eligible?
- —
Short-term bridge; refi at stabilization.
Rent comps 36 comps
| Address | Beds | Baths | Sqft | Rent | $/sqft | DOM | Units | Dist |
|---|---|---|---|---|---|---|---|---|
| 10607 Richmond Ave Kansas City, MO | 3.0 | 1.0 | 912 | $1,499 | $1.64 | 17d | 1 | 0.14mi |
| 10719 Bristol Ter Kansas City, MO | 3.0 | 2.0 | 1096 | $1,456 | $1.33 | 24d | 1 | 0.23mi |
| 7800 E 112th St Kansas City, MO | 3.0 | 1.0 | 900 | $1,600 | $1.78 | 24d | 1 | 0.34mi |
| 10401 Richmond Ave Kansas City, MO | 3.0 | 1.0 | 1000 | $1,350 | $1.35 | 24d | 1 | 0.39mi |
| 8304 E 110 Ter Kansas City, MO | 3.0 | 1.0 | 912 | $1,450 | $1.59 | 44d | 1 | 0.54mi |
| 8622 E 108th Ter Kansas City, MO | 3.0 | 1.0 | 993 | $1,995 | $2.01 | 4d | 1 | 0.55mi |
| 7405 E 112th St Kansas City, MO | 4.0 | 1.0 | 936 | $1,850 | $1.98 | 44d | 1 | 0.58mi |
| 7305 E 111th Ter Kansas City, MO | 4.0 | 1.0 | 1100 | $1,345 | $1.22 | 15d | 1 | 0.58mi |
| 11116 Bristol Ter Kansas City, MO | 3.0 | 1.0 | 956 | $1,390 | $1.45 | 24d | 1 | 0.63mi |
| 10716 Ewing Ave Kansas City, MO | 4.0 | 2.0 | 1032 | $1,550 | $1.50 | 44d | 1 | 0.64mi |
| 8310 E 111th Ter Kansas City, MO | 3.0 | 1.0 | 912 | $950 | $1.04 | 17d | 1 | 0.66mi |
| 7119 E 111th Ter Kansas City, MO | 3.0 | 1.0 | 912 | $1,349 | $1.48 | 44d | 1 | 0.68mi |
| 8517 E 110th Ter Kansas City, MO | 3.0 | 2.0 | 1095 | $1,450 | $1.32 | 44d | 1 | 0.70mi |
| 10919 Ewing Ave Kansas City, MO | 3.0 | 1.0 | 840 | $1,850 | $2.20 | 5d | 1 | 0.71mi |
| 10712 Bennington Ave Kansas City, MO | 3.0 | 1.0 | 912 | $1,395 | $1.53 | 17d | 1 | 0.74mi |
| 7114 E 112th St Kansas City, MO | 4.0 | 1.0 | 936 | $1,850 | $1.98 | 24d | 1 | 0.75mi |
| 11208 Marsh Ave Kansas City, MO | 3.0 | 1.0 | 912 | $1,395 | $1.53 | 4d | 1 | 0.76mi |
| 11127 Blue Ridge Blvd Kansas City, MO | 3.0 | 1.0 | 1000 | $1,599 | $1.60 | 44d | 1 | 0.86mi |
| 6905 E 112th St Kansas City, MO | 3.0 | 1.0 | 972 | $1,550 | $1.59 | 44d | 1 | 0.90mi |
| 11410 Palmer Ave Kansas City, MO | 4.0 | 2.0 | 936 | $1,300 | $1.39 | 44d | 1 | 0.91mi |
| 11316 Donnelly Ave Kansas City, MO | 3.0 | 1.0 | 1000 | $1,475 | $1.48 | 44d | 1 | 0.93mi |
| 11406 Sycamore Ter Kansas City, MO | 3.0 | 1.0 | 912 | $1,450 | $1.59 | 17d | 1 | 0.98mi |
| 11407 Winchester Ave Kansas City, MO | 3.0 | 1.0 | 936 | $1,360 | $1.45 | 4d | 1 | 1.06mi |
| 11513 Richmond Ave Kansas City, MO | 3.0 | 1.5 | 1114 | $1,450 | $1.30 | 15d | 1 | 1.09mi |
| 7104 Longview Rd Kansas City, MO | 3.0 | 1.0 | 912 | $1,275 | $1.40 | 15d | 1 | 1.10mi |
| 9811 Marsh Ave Kansas City, MO | 3.0 | 1.0 | 912 | $1,295 | $1.42 | 44d | 1 | 1.13mi |
| 8407 E 98th Ter Kansas City, MO | 3.0 | 1.0 | 940 | $1,395 | $1.48 | 17d | 1 | 1.14mi |
| 8407 E 98th Ter Kansas City, MO | 3.0 | 1.0 | 940 | $1,395 | $1.48 | 24d | 1 | 1.14mi |
| 6904 Longview Rd Kansas City, MO | 4.0 | 1.0 | 900 | $1,850 | $2.06 | 2d | 1 | 1.15mi |
| 10000 Bennington Ave Kansas City, MO | 4.0 | 2.5 | 1032 | $1,550 | $1.50 | 44d | 1 | 1.18mi |
| 9809 Wallace Ave Kansas City, MO | 3.0 | 1.0 | 956 | $1,500 | $1.57 | 24d | 1 | 1.23mi |
| 10500 Hillcrest Rd Kansas City, MO | 1.0–2.0 | 1.0–2.0 | 875 | $1,350 | $1.54 | 2d | 63 | 1.30mi |
| 5907 E 101st St Kansas City, MO | 3.0 | 1.0 | 912 | $1,595 | $1.75 | 4d | 1 | 1.37mi |
| 5907 E 101st St Kansas City, MO | 3.0 | 1.0 | 912 | $1,595 | $1.75 | 17d | 1 | 1.37mi |
| 11803 Holiday Dr #5 Kansas City, MO | 1.0–3.0 | 1.0 | 1016 | $1,130 | $1.11 | 2d | 1 | 1.40mi |
| 5906 E 99th Ter Kansas City, MO | 3.0 | 1.0 | 912 | $1,399 | $1.53 | 20d | 1 | 1.50mi |
HOA detail
- Monthly dues
- $3 · $36/yr
Listing history 31 events
-
2026-06-21days on market $139,900 Active 98 DOM
-
2026-06-18days on market $139,900 Active 95 DOM
-
2026-06-17days on market $139,900 Active 94 DOM
-
2026-06-16days on market $139,900 Active 93 DOM
-
2026-06-15days on market $139,900 Active 92 DOM
-
2026-06-13days on market $139,900 Active 90 DOM
-
2026-06-13days on market $139,900 Active 89 DOM
-
2026-06-09days on market $139,900 Active 86 DOM
-
2026-06-08days on market $139,900 Active 85 DOM
-
2026-06-07days on market $139,900 Active 84 DOM
-
2026-06-03days on market $139,900 Active 80 DOM
-
2026-06-02days on market $139,900 Active 79 DOM
-
2026-06-01days on market $139,900 Active 78 DOM
-
2026-05-31days on market $139,900 Active 77 DOM
-
2026-05-14price $149,900 580-char remark
Show marketing remark (580 chars)
Welcome to 7611 E 107th St, a 3-bedroom, 1 full-bath home located in Kansas City. This property offers a functional layout with comfortable living spaces and a full basement, providing additional storage and flexible-use space. The home features a living area with natural light, three bedrooms, and one full bathroom. The full basement offers potential for a variety of uses, such as storage, hobby space, or other permitted uses to fit your needs. Conveniently located near shopping, dining, schools, and major roadways, this property offers accessibility to everyday amenities.
-
2026-04-24status Active 580-char remark
Show marketing remark (580 chars)
Welcome to 7611 E 107th St, a 3-bedroom, 1 full-bath home located in Kansas City. This property offers a functional layout with comfortable living spaces and a full basement, providing additional storage and flexible-use space. The home features a living area with natural light, three bedrooms, and one full bathroom. The full basement offers potential for a variety of uses, such as storage, hobby space, or other permitted uses to fit your needs. Conveniently located near shopping, dining, schools, and major roadways, this property offers accessibility to everyday amenities.
-
2026-04-13status Pending 580-char remark
Show marketing remark (580 chars)
Welcome to 7611 E 107th St, a 3-bedroom, 1 full-bath home located in Kansas City. This property offers a functional layout with comfortable living spaces and a full basement, providing additional storage and flexible-use space. The home features a living area with natural light, three bedrooms, and one full bathroom. The full basement offers potential for a variety of uses, such as storage, hobby space, or other permitted uses to fit your needs. Conveniently located near shopping, dining, schools, and major roadways, this property offers accessibility to everyday amenities.
-
2026-03-04$159,900 Active 580-char remark
Show marketing remark (580 chars)
Welcome to 7611 E 107th St, a 3-bedroom, 1 full-bath home located in Kansas City. This property offers a functional layout with comfortable living spaces and a full basement, providing additional storage and flexible-use space. The home features a living area with natural light, three bedrooms, and one full bathroom. The full basement offers potential for a variety of uses, such as storage, hobby space, or other permitted uses to fit your needs. Conveniently located near shopping, dining, schools, and major roadways, this property offers accessibility to everyday amenities.
-
2017-05-22soldstatus
-
2017-05-18soldstatus Sold 182-char remark
Show marketing remark (182 chars)
New Carpet, freshly painted, very nice rehab. One of the nicest homes in Ruskin Heights and this one has a basement. No sellers disclosure. Seller will "Owner Finance"!!!!
-
2017-04-21status Pending 182-char remark
Show marketing remark (182 chars)
New Carpet, freshly painted, very nice rehab. One of the nicest homes in Ruskin Heights and this one has a basement. No sellers disclosure. Seller will "Owner Finance"!!!!
-
2017-04-01price $74,300 182-char remark
Show marketing remark (182 chars)
New Carpet, freshly painted, very nice rehab. One of the nicest homes in Ruskin Heights and this one has a basement. No sellers disclosure. Seller will "Owner Finance"!!!!
-
2017-02-09$74,800 Active 182-char remark
Show marketing remark (182 chars)
New Carpet, freshly painted, very nice rehab. One of the nicest homes in Ruskin Heights and this one has a basement. No sellers disclosure. Seller will "Owner Finance"!!!!
-
2016-10-21historical
-
2016-07-21$74,900 Active
-
2015-07-01soldstatus
-
2000-06-29soldstatus
-
2000-06-28soldstatus
-
2000-04-01$58,900
-
1996-05-22soldstatus
-
1996-05-22soldstatus
ⓘ Source: listings_history table (triggers on properties + properties_extension) + one-shot
backfill from property_details.listing_events for pre-trigger history.
Tax reassessment forecast MO · Resets to sale price
- Current annual tax
- $1,328 · $111/mo
- Projected year-2 tax
- $1,357 · $113/mo
- Expected delta
- +$29/yr (+$2/mo · 2.2%)
ⓘ Screening estimate from a state-policy table — verify with the county assessor before closing.
Climate risk First Street
- Flood 1/10 Low FEMA zone X (unshaded) · 0% chance over 30 yrs
- Wildfire 1/10 Low
- Heat 4/10 Moderate 7 d/yr ≥107°F today · 16 d/yr by 30 yrs out
- Wind 2/10 Low
- Air quality 3/10 Moderate 3 unhealthy d/yr today · 3 by 30 yrs out
Nearby sold comps map
Loading sold comps map…
Walkable amenities ~0.75 mi
Loading nearby amenities…
Taxation est. · year 1
- Rental income
- $18,686
- − Mortgage interest
- −$7,837
- − Property taxes
- −$1,328
- − Insurance
- −$700
- − Repairs & maintenance
- −$1,495
- − Management
- −$1,495
- − HOA
- −$36
- − Depreciation
- −$4,070
- Taxable income
- $1,726
- Est. tax owed @ 24.0%
- −$414
- After-tax cash flow
- $3,480/yr
For passive investors: Depreciation is non-cash, so a rental often shows a tax loss while cash-flowing — sheltering income. Rental losses are passive: they offset passive income freely, and up to $25,000/yr can offset ordinary (W-2) income if you actively participate and your MAGI is under $100k (phasing out to $0 by $150k); unused losses carry forward. On sale, claimed depreciation is recaptured at up to 25%, and gains may owe capital-gains tax (a 1031 exchange can defer both). Figures are a year-1 estimate at your 24.0% rate — not tax advice; consult a CPA.
Schools (NCES district)
- District
- Hickman Mills C-1
- NCES district ID
- 2914340
- Math proficiency
- 8% ▼ -8.00%
- Reading proficiency
- 18% ▼ -4.00%
- Median HH income
- $40,908
- Composite
- 11.2/100
- National rank
- #9725
- State rank
- #314 of 324 in MO
Livability — Kansas City
- Score
- 78/100
- State rank
- #28
- US rank
- #2671
Category grades
Schools grade is shown separately in the Schools card above.
Census & demographics
- Census place
- Kansas City, MO
- County
- Jackson County · 687,798 people
- City population
- 439,467
- Metro
- Kansas City, MO-KS
- Population (ZIP)
- 22,964
- Household income
- $58,170
- Rent vs Own
- Severe rent burden
- 718.0
Population outlook (Jackson County) Hauer SSP2
- Today (2025)
- 719,589 people
- By 2030
- 731,456 · +1.6%
- By 2040
- 746,689 · +3.8%
- By 2050
- 749,289 · +4.1%
- By 2075
- 736,227 · +2.3%
- By 2100
- 668,210 · -7.1%
Race, ethnicity, and origin ACS 2023
- Neighborhood character
- Diverse neighborhood (Simpson 0.58)
- Race & ethnicity
- Black 58% White 28% Hispanic / Latino 10% Two or more races 6%
- Hispanic origin (detail)
- Mexican 6%
- Common ancestry
- Italian 2% Lithuanian 1% Romanian 1%
- Foreign-born
- 4% · Canada
- Languages at home
- 93% English-only · Spanish 5% Arabic 1%
Political lean MEDSL · Jackson
- 2024 margin
- D (+19.3) · D 58.9% · R 39.5% · Other 1.6%
- 2008→2024 swing
- -6.1pp toward R · 2008: 25.4pp · 2024: 19.3pp
- All cycles
- 2024: D+19.3 2020: D+22.0 2016: D+16.6 2012: D+19.0 2008: D+25.4
Not yet ingested
- Civics
- —
Market trends
- HPI YoY
- ▼ -157.94%
- Current HPI
- 277.895
- Rent YoY
- ▲ 6.73%
- Metro
- Kansas City, MO-KS
- State GDP YoY
- ▲ 1.84%
- F500 in state
- 20
Industry mix (Fortune 500 HQ in MO)
| Industry | F500 HQs | Revenue |
|---|---|---|
| Healthcare | 1 | $163B |
|
||
| Insurance | 1 | $21B |
|
||
| Industrial Technology | 1 | $17B |
|
||
| Retail | 1 | $16B |
|
||
| Industrial Distribution | 1 | $10B |
|
||
| Utilities | 1 | $9B |
|
||
Price history
+154.5% since first listed17 events — show timeline
- 2026-05-14 Price Changed $149,900 Heartland MLS as Distributed by MLS Grid
- 2026-04-24 Relisted — Heartland MLS as Distributed by MLS Grid
- 2026-04-13 Pending — Heartland MLS as Distributed by MLS Grid
- 2026-03-04 Listed $159,900 Heartland MLS as Distributed by MLS Grid
- 2017-05-22 Sold (Public Records) — Public Records
- 2017-05-18 Sold (MLS) — Heartland MLS as Distributed by MLS Grid
- 2017-04-21 Pending — Heartland MLS as Distributed by MLS Grid
- 2017-04-01 Price Changed $74,300 Heartland MLS as Distributed by MLS Grid
- 2017-02-09 Listed $74,800 Heartland MLS as Distributed by MLS Grid
- 2016-10-21 Listing Removed — Heartland MLS as Distributed by MLS Grid
- 2016-07-21 Listed $74,900 Heartland MLS as Distributed by MLS Grid
- 2015-07-01 Sold (Public Records) — Public Records
- 2000-06-29 Sold (Public Records) — Public Records
- 2000-06-28 Sold (MLS) — Heartland MLS as Distributed by MLS Grid
- 2000-04-01 Listed $58,900 Heartland MLS as Distributed by MLS Grid
- 1996-05-22 Sold (Public Records) — Public Records
- 1996-05-22 Sold (Public Records) — Public Records
Property tax history
+4.9%/yrLatest (2025): $1,328 · +18.3% YoY. Source: county tax records.
Cash-flow waterfall
monthlySold comps — $/sqft
last 12 mo · ≤1 miLoading sold comps…