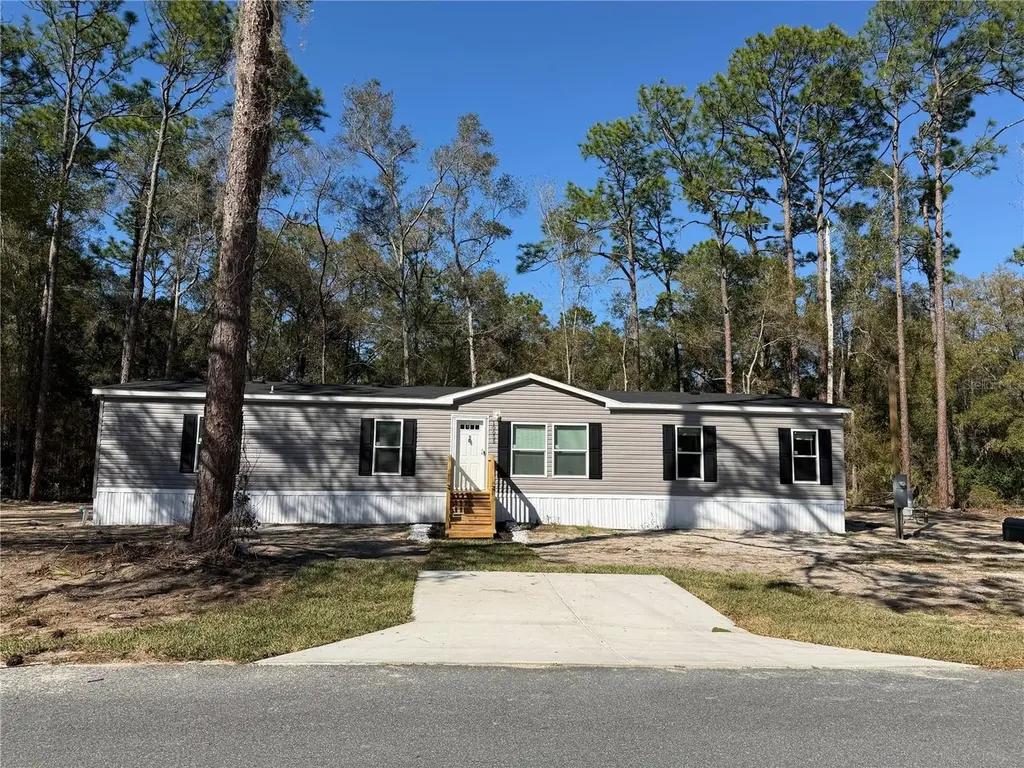
10055 W Ohio Dr · Inglis, FL
Flood risk 1/10 · Minimal
- FEMA flood zone
- X (unshaded)
- Chance of flooding over 30 yrs
- 0.0%
- Est. flood insurance / yr
- $507 – $1,088
Fire risk 5/10 · Moderate
- Est. fire insurance / yr
- $947 – $1,759
Heat risk 9/10 · Severe
- Hot days now (above 109°F)
- 7 days/yr
- Hot days in 30 yrs
- 22 days/yr
Wind risk 9/10 · Severe
- Chance of severe wind over 30 yrs
- 99.0%
Air-quality risk 2/10 · Minimal
- Unhealthy air days now
- 2 days/yr
- Unhealthy air days in 30 yrs
- 2 days/yr
Risk factors via First Street. Map © Google.
Why this score? — see what drove the D+ grade
The composite is a weighted blend of 9 inputs, each scored 0–100. Each bar is that input's sub-score; the figure is the points it added to the 100-point composite (weight × sub-score).
- Cash flow +16.0/30.0
- ARV discount +7.5/15.0
- DSCR +4.9/10.0
- 1% rule +4.4/10.0
- Schools +4.1/10.0
- Livability +3.1/5.0
- Rent growth +2.5/5.0
- Condition / age +2.5/5.0
- Appreciation +0.0/10.0
$249,900
🖨 Deal sheet 📄 Offer letter ✓ Due diligence
Listing remarks MLS
Beautiful, affordable wooded lot ready for your custom home. Multiple lots are available. Call to see today!
Key facts
- New construction
- New hvac
- New septic system
Tags
Property features AI
Finance
- Other: Lot about 0.24 acre (0 to less than 1/4 acre)
- HOA & community: No association
Exterior
- Utilities: Electricity connected; Water connected; Septic tank; No municipal water source listed
- Home design: Manufactured double-wide home; One-story; East-facing; Residential property
- Construction: Metal frame construction; Shingle roof; Crawlspace foundation; Built as a manufactured home
- Exterior features: Other exterior features
Interior
- Kitchen: Range; Refrigerator; Electric water heater
- Bedrooms: 4 bedrooms
- Flooring: Vinyl
- Bathrooms: 2 full bathrooms
- Heating & cooling: Central heating; Central air conditioning
- Interior features: Kitchen/family room combo
- Laundry & utility: Inside laundry
Neighborhood map
What this means for you Summary
Snapshot
- This is a 4-bed/2.0-bath land listed at $250k.
Deal economics
- At list price, monthly cash flow is $124 ($1k/yr) — positive.
- The deal already cash-flows at list — no discount required.
- To meet the 1% rule (rent ≥ 1% of price), the offer needs to be $234k (6.2% below list).
- Recommended offer: $234k (6.2% below list) — sets the bar for 1% rule.
- Cap rate 6.9% vs local median 5.1% in Inglis — top-decile yield for the area; either an underpriced asset or a hidden risk that comps aren't pricing in. Stress-test before assuming the spread holds.
Location & tenants
- Location reads 61/100 on livability (#796 in FL) — a middle-class / working-renter tenant base. Strengths: crime A+, cost of living A+, housing A+; Watch: health & safety C-, schools F, amenities F.
- Citrus (rural): math 49% / reading 50% proficiency, ranked #44 of 73 in FL (top 60%) — families likely to look elsewhere, expect single-tenant / working-renter base with shorter leases.
- Market conditions: 320 active listings in the ZIP; 2,443 units permitted in Citrus County in 2024 (0 in 5+ unit buildings).
- At $2,343/mo this rent would consume 55% of the median local household income ($51k/yr) (locally 264% of renters already pay >50% of income on rent) — very limited rent-growth headroom before tenants either downsize or default.
Forward outlook
- Local home prices are declining (-3.0%/yr); year-one equity from $2k of loan paydown is wiped out by about $7k of value loss. Plan a longer hold.
- Citrus County population projected to shrink 10% by 2050 — rents likely to lag national; underwrite the cash flow, not the appreciation.
Negotiation context
- It's been on market 29 days — a 2% lower offer ($246k) is reasonable based on typical stale-listing flexibility.
- 3 sale attempts since 13y ago with the ask held roughly flat each time — persistent listings suggest the price (not the market) is what's stuck; bring a comps-based counter.
- Current owner paid $6k; list at $250k implies a 4065% gain — meaningful room to come down on a strong offer.
Risks & watch-outs
- Climate carrying-cost: severe wind risk, 99% chance of damaging wind over 30y; moderate wildfire risk; extreme-heat days projected 7→22/yr by 2055 (HVAC capex compounding) — expect insurance premiums to compound above CPI over the hold.
Questions for the listing agent
- Is there a deadline driving the sale (1031 exchange, divorce, estate, relocation)? That informs how much negotiation room exists.
- Schools are F-rated, which usually means shorter tenancies and higher turnover. Who's the typical renter profile here, and what's been the actual vacancy rate?
- The area grade is low — what's the realistic commute time and amenity access for the typical tenant pool here? Any planned neighborhood developments (good or bad) we should know about?
- What's the average days-on-market for RENTAL listings here right now (not sales)? A rising rental-DOM trend means longer vacancies and softer asking-rent achievability than the comps imply.
- What's the recent tenant-quality profile in this submarket — average credit score on applications, eviction rate, late-payment / NSF rate, and stable-employment percentage? A property-management company in the area should have these aggregated.
- How much new for-sale + rental construction is in the pipeline within 1–3 miles? Heavy new supply typically softens prices + rents 12–24 months out; constrained supply supports both.
Investment metrics
- 1% rule
- 0.94% ✗
- Cap rate
- 6.89%
- Cash-on-cash
- 2.13%
- DSCR
- 1.09
- GRM
- 8.9
CMA / ARV
No comps found within radius.
Projected returns pro-forma
-3.0% appreciation · 3.0% rent growth · sell at horizon
- IRR
- -12.9%
- Equity multiple
- 0.53×
- Total profit
- $-32,546
- Equity at exit
- $37,261
- IRR
- -3.9%
- Equity multiple
- 0.74×
- Total profit
- $-18,007
- Equity at exit
- $21,607
Cash invested: $69,972 (down + closing). Projections, not guarantees.
Landlord ↔ Tenant lean methodology
- Overall (STATE)
- 87 Strongly Landlord-Friendly
- State Florida
- 87 Strongly Landlord-Friendly · R+3
- County
- — inherits STATE
- City
- — inherits STATE
ZIP-level market 34428
- Home prices YoY
- -15.3%
- Active inventory
- 320
- Price-to-rent
- 8.9×
Monthly cashflow live
- Estimated rent
- $2,343 medium interval (Pro) →
- Mortgage (P&I)
- −$1,311
- Tax est. 1.5%
- −$312 /mo · $3,748/yr
- Insurance
- −$104
- HOA
- −$0
- Vacancy / Maint / Mgmt
- −$492
- Net cashflow
- $124
Break-even live
UW: 25.0% down · 7.5% · 30yr · 1.5% tax · 5.0% vac · 8.0% maint · 8.0% mgmt
Financing live
Cash to close
- Down payment
- $62,475
- Closing costs
- $7,497
- Reserves months
- —
- Total cash needed
- —
Loan-product check · same deal, 3 products live
Conventional
25% down · 7.5% · 30yr
- Down + closing
- —
- Monthly P&I
- —
- Monthly cashflow
- —
- DSCR
- —
- Eligible?
- —
Personal DTI + credit; lowest rate.
DSCR
20% down · 8.5% · 30yr
- Down + closing
- —
- Monthly P&I
- —
- Monthly cashflow
- —
- DSCR
- —
- Eligible?
- —
No personal income docs; deal must DSCR.
Hard money
10% down · 12.0% · 12mo
- Down + closing
- —
- Monthly P&I
- —
- Monthly cashflow
- —
- DSCR
- —
- Eligible?
- —
Short-term bridge; refi at stabilization.
Listing history 22 events
-
2026-06-19days on market $249,900 Active 29 DOM
-
2026-06-18days on market $249,900 Active 28 DOM
-
2026-06-17days on market $249,900 Active 27 DOM
-
2026-06-16days on market $249,900 Active 26 DOM
-
2026-06-15days on market $249,900 Active 25 DOM
-
2026-06-14days on market $249,900 Active 23 DOM
-
2026-06-13days on market $249,900 Active 22 DOM
-
2026-06-09days on market $249,900 Active 19 DOM
-
2026-06-08days on market $249,900 Active 18 DOM
-
2026-06-07days on market $249,900 Active 17 DOM
-
2026-06-03days on market $249,900 Active 13 DOM
-
2026-06-02days on market $249,900 Active 12 DOM
-
2026-06-01days on market $249,900 Active 11 DOM
-
2026-05-31days on market $249,900 Active 10 DOM
-
2026-05-30days on market $249,900 Active 9 DOM
-
2026-05-21$249,900 Active
-
2026-05-18historical
-
2026-04-21price $259,900
-
2026-02-23$265,000 Active
-
2024-12-06soldstatus $6,000
-
2014-03-13soldstatus $3,625 108-char remark
Show marketing remark (108 chars)
Beautiful, affordable wooded lot ready for your custom home. Multiple lots are available. Call to see today!
-
2013-09-04$4,000 108-char remark
Show marketing remark (108 chars)
Beautiful, affordable wooded lot ready for your custom home. Multiple lots are available. Call to see today!
ⓘ Source: listings_history table (triggers on properties + properties_extension) + one-shot
backfill from property_details.listing_events for pre-trigger history.
Climate risk First Street
- Flood 1/10 Low FEMA zone X (unshaded) · 0% chance over 30 yrs
- Wildfire 5/10 Major
- Heat 9/10 Extreme 7 d/yr ≥109°F today · 22 d/yr by 30 yrs out
- Wind 9/10 Extreme 99% chance of damaging wind over 30 yrs
- Air quality 2/10 Low 2 unhealthy d/yr today · 2 by 30 yrs out
Nearby sold comps map
Loading sold comps map…
Walkable amenities ~0.75 mi
Loading nearby amenities…
Taxation est. · year 1
- Rental income
- $28,120
- − Mortgage interest
- −$13,998
- − Property taxes
- −$3,748
- − Insurance
- −$1,250
- − Repairs & maintenance
- −$2,250
- − Management
- −$2,250
- − Depreciation
- −$7,270
- Taxable loss
- −$2,645
- Est. tax savings @ 24.0%
- +$635
- After-tax cash flow
- $2,126/yr
For passive investors: Depreciation is non-cash, so a rental often shows a tax loss while cash-flowing — sheltering income. Rental losses are passive: they offset passive income freely, and up to $25,000/yr can offset ordinary (W-2) income if you actively participate and your MAGI is under $100k (phasing out to $0 by $150k); unused losses carry forward. On sale, claimed depreciation is recaptured at up to 25%, and gains may owe capital-gains tax (a 1031 exchange can defer both). Figures are a year-1 estimate at your 24.0% rate — not tax advice; consult a CPA.
Schools (NCES district)
- District
- Citrus
- NCES district ID
- 1200270
- Math proficiency
- 49% ▼ -10.00%
- Reading proficiency
- 50% ▼ -6.00%
- Median HH income
- $38,618
- Composite
- 41.28/100
- National rank
- #3519
- State rank
- #44 of 73 in FL
Livability — Inglis
- Score
- 61/100
- State rank
- #796
- US rank
- #18314
Category grades
Schools grade is shown separately in the Schools card above.
Census & demographics
- County
- Citrus County · 111,314 people
- Metro
- Homosassa Springs, FL
- Population (ZIP)
- 10,163
- Household income
- $50,779
- Rent vs Own
- Severe rent burden
- 264.0
Population outlook (Citrus County) Hauer SSP2
- Today (2025)
- 138,622 people
- By 2030
- 136,886 · -1.3%
- By 2040
- 132,009 · -4.8%
- By 2050
- 125,196 · -9.7%
- By 2075
- 108,570 · -21.7%
- By 2100
- 84,454 · -39.1%
Race, ethnicity, and origin ACS 2023
- Neighborhood character
- Predominantly White (88%)
- Race & ethnicity
- White 88% Two or more races 6% Hispanic / Latino 5% Asian 2%
- Common ancestry
- Lithuanian 3% Romanian 3% Slovak 2%
- Foreign-born
- 5% · Canada, Jamaica, South Korea
- Languages at home
- 96% English-only · Spanish 3%
Political lean MEDSL · Citrus
- 2024 margin
- Solid R (+45.9) · D 26.8% · R 72.6%
- 2008→2024 swing
- -29.8pp toward R · 2008: -16.1pp · 2024: -45.9pp
- All cycles
- 2024: R+45.9 2020: R+41.0 2016: R+39.7 2012: R+21.9 2008: R+16.1
Not yet ingested
- Civics
- —
Market trends
- HPI YoY
- ▼ -57.32%
- Current HPI
- 317.7637
- Rent YoY
- —
- Metro
- Homosassa Springs, FL
- State GDP YoY
- ▲ 3.28%
- F500 in state
- 36
Industry mix (Fortune 500 HQ in FL)
| Industry | F500 HQs | Revenue |
|---|---|---|
| Industrial Technology | 2 | $29B |
|
||
| Insurance | 2 | $17B |
|
||
| Retail | 1 | $60B |
|
||
| Technology Distribution | 1 | $58B |
|
||
| Homebuilding | 1 | $35B |
|
||
| Technology Manufacturing | 1 | $35B |
|
||
Price history
+6147.5% since first listed7 events — show timeline
- 2026-05-21 Listed $249,900 Stellar MLS as Distributed by MLS Grid
- 2026-05-18 Listing Removed — Stellar MLS as Distributed by MLS Grid
- 2026-04-21 Price Changed $259,900 Stellar MLS as Distributed by MLS Grid
- 2026-02-23 Listed $265,000 Stellar MLS as Distributed by MLS Grid
- 2024-12-06 Sold (Public Records) $6,000 Public Records
- 2014-03-13 Sold (MLS) $3,625 RACC
- 2013-09-04 Listed $4,000 RACC
Property tax history
+8.4%/yrLatest (2025): $139 · +90.0% YoY. Source: county tax records.
Cash-flow waterfall
monthlySold comps — $/sqft
last 12 mo · ≤1 miLoading sold comps…