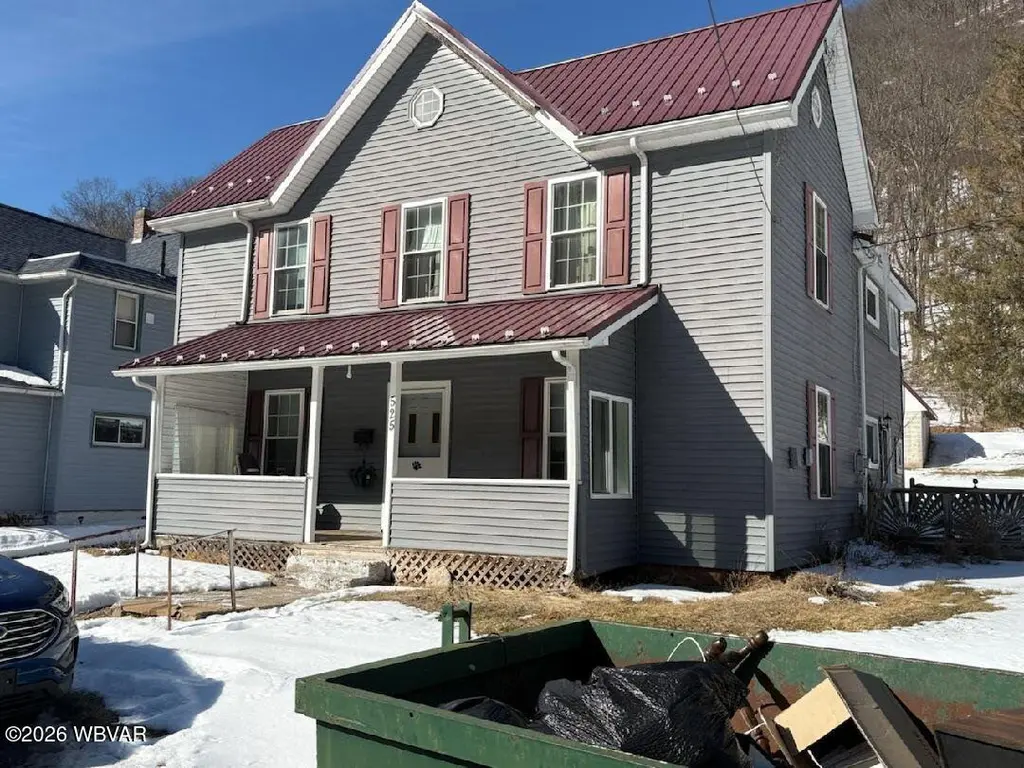
525 Farwell Ave · Farwell, PA
Flood risk 1/10 · Minimal
- FEMA flood zone
- X (unshaded)
- Chance of flooding over 30 yrs
- 0.0%
- Est. flood insurance / yr
- $473 – $860
Fire risk 3/10 · Minor
- Est. fire insurance / yr
- $511 – $949
Heat risk 3/10 · Minor
- Hot days now (above 91°F)
- 8 days/yr
- Hot days in 30 yrs
- 19 days/yr
Wind risk 2/10 · Minimal
- Chance of severe wind over 30 yrs
- —
Air-quality risk 1/10 · Minimal
- Unhealthy air days now
- 0 days/yr
- Unhealthy air days in 30 yrs
- 0 days/yr
Risk factors via First Street. Map © Google.
Why this score? — see what drove the B- grade
The composite is a weighted blend of 9 inputs, each scored 0–100. Each bar is that input's sub-score; the figure is the points it added to the 100-point composite (weight × sub-score).
- Cash flow +30.0/30.0
- 1% rule +10.0/10.0
- DSCR +10.0/10.0
- ARV discount +7.5/15.0
- Schools +3.2/10.0
- Rent growth +2.5/5.0
- Livability +2.5/5.0
- Condition / age +2.5/5.0
- Appreciation +1.4/10.0
$51,500
🖨 Deal sheet 📄 Offer letter ✓ Due diligence
Listing remarks MLS
GREAT LOCATION THE PROPERTY IS IN NEED OF SEVERAL UPGRADES. NEWER WINDOWS, ROOF, AND SIDING HAVE ALREADY BEEN DONE. ATV ENTHUSIATS WHY TOTE YOUR TOYS UP EVERY TIME YOU RIDE? THE LARGE GARAGE CAN ACCOMADATE AT LEAST 6 ATV'S. 1 BLOCK TO YOUR HAPPY RIDES. CALL TODAY.
Key facts
- Newer roof
- Newer siding
- Newer windows
Tags
Neighborhood map
What this means for you Summary
Snapshot
- This is a 4-bed/1.0-bath single-family listed at $52k.
Deal economics
- At list price, monthly cash flow is $719 ($9k/yr) — positive.
- The deal already cash-flows at list — no discount required.
- Meets the 1% rule at list price ($1k rent vs $52k).
- Recommended offer: $45k (12.0% below list) — sets the bar for market timing.
Location & tenants
- Location reads: area grade B — affects rentability + tenant quality, not the cash-flow math above.
- Keystone Central SD (town): math 32% / reading 44% proficiency, ranked #384 of 539 in PA (top 71%) — families likely to look elsewhere, expect single-tenant / working-renter base with shorter leases.
- Market conditions: 18 active listings in the ZIP; 44 units permitted in Clinton County in 2024 (0 in 5+ unit buildings).
Forward outlook
- Local home prices are declining (-3.0%/yr); year-one equity from $356 of loan paydown is wiped out by about $2k of value loss. Plan a longer hold.
- Clinton County population projected to shrink 5% by 2050 — rents likely to lag national; underwrite the cash flow, not the appreciation.
- At projected returns (-3.0% appreciation + 3.0% rent growth), your $14k cash investment doubles in ~2 years — after that, you're playing with house money.
Negotiation context
- It's been on market 121 days — a 12% lower offer ($45k) is reasonable based on typical stale-listing flexibility.
Risks & watch-outs
- Watch-outs: built in 1900 — expect roof / HVAC / electrical / plumbing capex.
Questions for the listing agent
- It's been on market 121 days. Have you received any prior offers? Is the seller open to a 12% concession, seller financing, or rate buy-down credit?
- Built in 1900 — when were the roof, HVAC, electrical panel, plumbing, and water heater last replaced?
- Why hasn't it sold? Are there any deal-killer items the seller is aware of (foundation, flood, title, zoning, code violations)?
- Is there a deadline driving the sale (1031 exchange, divorce, estate, relocation)? That informs how much negotiation room exists.
- What's the average days-on-market for RENTAL listings here right now (not sales)? A rising rental-DOM trend means longer vacancies and softer asking-rent achievability than the comps imply.
- What's the recent tenant-quality profile in this submarket — average credit score on applications, eviction rate, late-payment / NSF rate, and stable-employment percentage? A property-management company in the area should have these aggregated.
- How much new for-sale + rental construction is in the pipeline within 1–3 miles? Heavy new supply typically softens prices + rents 12–24 months out; constrained supply supports both.
Investment metrics
- 1% rule
- 2.61% ✓
- Cap rate
- 23.05%
- Cash-on-cash
- 59.85%
- DSCR
- 3.66
- GRM
- 3.2
CMA / ARV
- ARV (median comp)
- $104,036
- List price
- $51,500
- Delta
- -50.50%
- Verdict
- UNDERPRICED
- Comps
- 4 within 1.0 mi
Projected returns pro-forma
-3.0% appreciation · 3.0% rent growth · sell at horizon
- IRR
- 58.6%
- Equity multiple
- 3.60×
- Total profit
- $37,471
- Equity at exit
- $7,679
- IRR
- 63.4%
- Equity multiple
- 7.36×
- Total profit
- $91,658
- Equity at exit
- $4,453
Cash invested: $14,420 (down + closing). Projections, not guarantees.
Landlord ↔ Tenant lean methodology
- Overall (STATE)
- 62 Landlord-Friendly
- State Pennsylvania
- 62 Landlord-Friendly · EVEN
- County
- — inherits STATE
- City
- — inherits STATE
ZIP-level market 17764
- Home prices YoY
- -6.0%
- Active inventory
- 18
- Price-to-rent
- 3.2×
Monthly cashflow live
- Estimated rent
- $1,344 medium interval (Pro) →
- Mortgage (P&I)
- −$270
- Tax from tax record
- −$51 /mo · $617/yr
- Insurance
- −$21
- HOA
- −$0
- Vacancy / Maint / Mgmt
- −$282
- Net cashflow
- $719
Break-even live
UW: 25.0% down · 7.5% · 30yr · 1.5% tax · 5.0% vac · 8.0% maint · 8.0% mgmt
Financing live
Cash to close
- Down payment
- $12,875
- Closing costs
- $1,545
- Reserves months
- —
- Total cash needed
- —
Loan-product check · same deal, 3 products live
Conventional
25% down · 7.5% · 30yr
- Down + closing
- —
- Monthly P&I
- —
- Monthly cashflow
- —
- DSCR
- —
- Eligible?
- —
Personal DTI + credit; lowest rate.
DSCR
20% down · 8.5% · 30yr
- Down + closing
- —
- Monthly P&I
- —
- Monthly cashflow
- —
- DSCR
- —
- Eligible?
- —
No personal income docs; deal must DSCR.
Hard money
10% down · 12.0% · 12mo
- Down + closing
- —
- Monthly P&I
- —
- Monthly cashflow
- —
- DSCR
- —
- Eligible?
- —
Short-term bridge; refi at stabilization.
Listing history 18 events
-
2026-06-19days on market $51,500 Active 121 DOM
-
2026-06-18days on market $51,500 Active 120 DOM
-
2026-06-17days on market $51,500 Active 119 DOM
-
2026-06-16days on market $51,500 Active 118 DOM
-
2026-06-15days on market $51,500 Active 117 DOM
-
2026-06-14days on market $51,500 Active 115 DOM
-
2026-06-12days on market $51,500 Active 114 DOM
-
2026-06-09days on market $51,500 Active 111 DOM
-
2026-06-08days on market $51,500 Active 110 DOM
-
2026-06-07days on market $51,500 Active 109 DOM
-
2026-06-04days on market $51,500 Active 105 DOM
-
2026-06-02days on market $51,500 Active 104 DOM
-
2026-06-01days on market $51,500 Active 103 DOM
-
2026-05-31days on market $51,500 Active 102 DOM
-
2026-05-31days on market $51,500 Active 101 DOM
-
2026-05-18price $51,500 264-char remark
Show marketing remark (264 chars)
GREAT LOCATION THE PROPERTY IS IN NEED OF SEVERAL UPGRADES. NEWER WINDOWS, ROOF, AND SIDING HAVE ALREADY BEEN DONE. ATV ENTHUSIATS WHY TOTE YOUR TOYS UP EVERY TIME YOU RIDE? THE LARGE GARAGE CAN ACCOMADATE AT LEAST 6 ATV'S. 1 BLOCK TO YOUR HAPPY RIDES. CALL TODAY.
-
2026-03-06price $58,500 264-char remark
Show marketing remark (264 chars)
GREAT LOCATION THE PROPERTY IS IN NEED OF SEVERAL UPGRADES. NEWER WINDOWS, ROOF, AND SIDING HAVE ALREADY BEEN DONE. ATV ENTHUSIATS WHY TOTE YOUR TOYS UP EVERY TIME YOU RIDE? THE LARGE GARAGE CAN ACCOMADATE AT LEAST 6 ATV'S. 1 BLOCK TO YOUR HAPPY RIDES. CALL TODAY.
-
2026-02-16$71,900 Active 264-char remark
Show marketing remark (264 chars)
GREAT LOCATION THE PROPERTY IS IN NEED OF SEVERAL UPGRADES. NEWER WINDOWS, ROOF, AND SIDING HAVE ALREADY BEEN DONE. ATV ENTHUSIATS WHY TOTE YOUR TOYS UP EVERY TIME YOU RIDE? THE LARGE GARAGE CAN ACCOMADATE AT LEAST 6 ATV'S. 1 BLOCK TO YOUR HAPPY RIDES. CALL TODAY.
ⓘ Source: listings_history table (triggers on properties + properties_extension) + one-shot
backfill from property_details.listing_events for pre-trigger history.
Tax reassessment forecast PA · Partial reset (capped growth)
- Current annual tax
- $617 · $51/mo
- Projected year-2 tax
- $715 · $60/mo
- Expected delta
- +$99/yr (+$8/mo · 16.0%)
ⓘ Screening estimate from a state-policy table — verify with the county assessor before closing.
Climate risk First Street
- Flood 1/10 Low FEMA zone X (unshaded) · 0% chance over 30 yrs
- Wildfire 3/10 Moderate
- Heat 3/10 Moderate 8 d/yr ≥91°F today · 19 d/yr by 30 yrs out
- Wind 2/10 Low
- Air quality 1/10 Low 0 unhealthy d/yr today · 0 by 30 yrs out
Nearby sold comps map
Loading sold comps map…
Walkable amenities ~0.75 mi
Loading nearby amenities…
Taxation est. · year 1
- Rental income
- $16,133
- − Mortgage interest
- −$2,885
- − Property taxes
- −$617
- − Insurance
- −$258
- − Repairs & maintenance
- −$1,291
- − Management
- −$1,291
- − Depreciation
- −$1,498
- Taxable income
- $8,294
- Est. tax owed @ 24.0%
- −$1,991
- After-tax cash flow
- $6,639/yr
For passive investors: Depreciation is non-cash, so a rental often shows a tax loss while cash-flowing — sheltering income. Rental losses are passive: they offset passive income freely, and up to $25,000/yr can offset ordinary (W-2) income if you actively participate and your MAGI is under $100k (phasing out to $0 by $150k); unused losses carry forward. On sale, claimed depreciation is recaptured at up to 25%, and gains may owe capital-gains tax (a 1031 exchange can defer both). Figures are a year-1 estimate at your 24.0% rate — not tax advice; consult a CPA.
Schools (NCES district)
- District
- Keystone Central SD
- NCES district ID
- 4212725
- Math proficiency
- 32% ▼ -6.00%
- Reading proficiency
- 44% ▼ -10.00%
- Median HH income
- $42,713
- Composite
- 32.09/100
- National rank
- #5810
- State rank
- #384 of 539 in PA
Livability — Farwell
No livability data for this city. (Only ~50 U.S. cities are tracked.)
Census & demographics
- Census place
- Farwell, PA
- Population (ZIP)
- 2,460
Population outlook (Clinton County) Hauer SSP2
- Today (2025)
- 39,048 people
- By 2030
- 38,812 · -0.6%
- By 2040
- 38,011 · -2.7%
- By 2050
- 36,931 · -5.4%
- By 2075
- 34,077 · -12.7%
- By 2100
- 29,683 · -24.0%
Race, ethnicity, and origin ACS 2023
- Neighborhood character
- Predominantly White (92%)
- Race & ethnicity
- White 92% Two or more races 7% Hispanic / Latino 2%
- Common ancestry
- Romanian 3% Italian 2% Russian 1%
- Foreign-born
- 1% · Canada
- Languages at home
- 99% English-only · Spanish 1%
Political lean MEDSL · Clinton
- 2024 margin
- Solid R (+40.9) · D 29.1% · R 70.0%
- 2008→2024 swing
- -38.1pp toward R · 2008: -2.8pp · 2024: -40.9pp
- All cycles
- 2024: R+40.9 2020: R+36.3 2016: R+34.8 2012: R+11.3 2008: R+2.8
Not yet ingested
- Civics
- —
Market trends
- HPI YoY
- ▼ -7.16%
- Current HPI
- 111.66
- Rent YoY
- —
- Metro
- —
- State GDP YoY
- ▲ 1.68%
- F500 in state
- 34
Industry mix (Fortune 500 HQ in PA)
| Industry | F500 HQs | Revenue |
|---|---|---|
| Healthcare | 2 | $309B |
|
||
| Insurance | 2 | $27B |
|
||
| Telecommunications / Media | 1 | $124B |
|
||
| Industrial Distribution | 1 | $22B |
|
||
| Financial Services | 1 | $20B |
|
||
| Chemicals / Materials | 1 | $18B |
|
||
Price history
-28.4% since first listed3 events — show timeline
- 2026-05-18 Price Changed $51,500 WBVAR
- 2026-03-06 Price Changed $58,500 WBVAR
- 2026-02-16 Listed $71,900 WBVAR
Property tax history
-3.6%/yrLatest (2026): $617 · +1.1% YoY. Source: county tax records.
Cash-flow waterfall
monthlySold comps — $/sqft
last 12 mo · ≤1 miLoading sold comps…