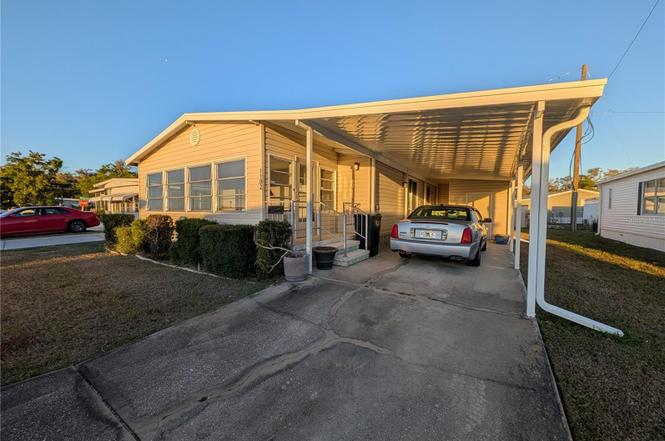
1102 46th Ave E · Ellenton, FL
Flood risk 7/10 · Major
- FEMA flood zone
- X (shaded)
- Chance of flooding over 30 yrs
- 0.92%
- Est. flood insurance / yr
- $507 – $1,088
Fire risk 2/10 · Minimal
- Est. fire insurance / yr
- $947 – $1,759
Heat risk 10/10 · Severe
- Hot days now (above 107°F)
- 6 days/yr
- Hot days in 30 yrs
- 24 days/yr
Wind risk 10/10 · Severe
- Chance of severe wind over 30 yrs
- 99.0%
Air-quality risk 3/10 · Minor
- Unhealthy air days now
- 3 days/yr
- Unhealthy air days in 30 yrs
- 3 days/yr
Risk factors via First Street. Map © Google.
Why this score? — see what drove the B+ grade
The composite is a weighted blend of 9 inputs, each scored 0–100. Each bar is that input's sub-score; the figure is the points it added to the 100-point composite (weight × sub-score).
- Cash flow +30.0/30.0
- ARV discount +15.0/15.0
- 1% rule +10.0/10.0
- DSCR +10.0/10.0
- Schools +4.4/10.0
- Livability +3.8/5.0
- Rent growth +2.5/5.0
- Condition / age +2.5/5.0
- Appreciation +0.0/10.0
$112,599
🖨 Deal sheet 📄 Offer letter ✓ Due diligence
Listing remarks
Discover the potential in this spacious 3-bedroom, 2-bath manufactured home located in the desirable 55+ land-owned community of Tidevue Estates in Ellenton, Florida. With a little TLC, this charming home can easily become your ideal Florida retreat. Step inside to find a generous living room that offers plenty of space for relaxing or entertaining guests. The home also features a bright and inviting sunroom—perfect for enjoying your morning coffee, reading a book, or soaking in the beautiful Florida sunshine year-round. The updated kitchen provides ample cabinet space and storage, making meal prep and organization a breeze. An inside laundry room adds everyday convenience, keeping ev
Key facts
- Manufactured home
- Covered carport
- Sunroom
Tags
Property features AI
Finance
- Other: Lot approximately 0.09 acres (asphalt road)
- Financial info: Lease restrictions apply; Total annual fees $600 (monthly $50)
- HOA & community: Has HOA (Tidevue Estates Civic Organization) with required monthly fee of $50; Association approval required; Senior community; No pets allowed
Exterior
- Parking: Carport with 1 space
- Utilities: Public water; Public sewer; Electricity available; Sewer connected
- Home design: Mobile home (double wide); Single-story; Faces west; Entry level: One
- Construction: Frame construction; Roof over; Other foundation
- Exterior features: Awnings; Exterior storage
Interior
- Kitchen: Range; Microwave; Refrigerator; Electric water heater
- Bedrooms: 3 bedrooms
- Flooring: Carpet; Linoleum
- Bathrooms: 2 full bathrooms
- Heating & cooling: Electric heat; Central air conditioning
- Interior features: Open living room/dining room combo
- Laundry & utility: Inside laundry room with washer and dryer hookups; Electric dryer hookup
Neighborhood map
What this means for you Summary
Snapshot
- This is a 3-bed/1.0-bath manufactured listed at $113k.
Deal economics
- At list price, monthly cash flow is $1k ($16k/yr) — positive.
- The deal already cash-flows at list — no discount required.
- Meets the 1% rule at list price ($3k rent vs $113k).
- Recommended offer: $106k (6.0% below list) — sets the bar for market timing.
- Cap rate 21.0% vs local median 4.5% in Ellenton — top-decile yield for the area; either an underpriced asset or a hidden risk that comps aren't pricing in. Stress-test before assuming the spread holds.
Location & tenants
- Location reads 76/100 on livability (#232 in FL, #3,666 nationally) — a middle-class / working-renter tenant base. Strengths: cost of living A+, housing A+, health & safety A+; Watch: schools D+, amenities F, commute F.
- Manatee (suburban): math 54% / reading 50% proficiency, ranked #26 of 73 in FL (top 36%) — acceptable for families but not a draw, mixed tenant base, ~2y average lease.
- Market conditions: 182 active listings in the ZIP; 10 comparable units currently listed for rent nearby; rentals leasing fast (median 4d on market — plan ~1-2 weeks tenant-placement turnaround); 7,472 units permitted in Manatee County in 2024 (1,782 in 5+ unit buildings).
- At $2,796/mo this rent would consume 52% of the median local household income ($64k/yr) (locally 313% of renters already pay >50% of income on rent) — very limited rent-growth headroom before tenants either downsize or default.
Forward outlook
- Local home prices are declining (-3.0%/yr); year-one equity from $778 of loan paydown is wiped out by about $3k of value loss. Plan a longer hold.
- Manatee County population projected at +43% by 2050 — long-run rental-demand tailwind backs the buy-and-hold thesis.
- At projected returns (-3.0% appreciation + 3.0% rent growth), your $32k cash investment doubles in ~3 years — after that, you're playing with house money.
Negotiation context
- It's been on market 67 days — a 6% lower offer ($106k) is reasonable based on typical stale-listing flexibility.
- 2 sale attempts with the ask held roughly flat each time — persistent listings suggest the price (not the market) is what's stuck; bring a comps-based counter.
- Current owner paid $60k; list at $113k implies a 88% gain — meaningful room to come down on a strong offer.
Risks & watch-outs
- Watch-outs: flood insurance adds $66/mo.
- Climate carrying-cost: major flood risk; severe wind risk, 99% chance of damaging wind over 30y; extreme-heat days projected 6→24/yr by 2055 (HVAC capex compounding) — expect insurance premiums to compound above CPI over the hold.
Questions for the listing agent
- It's been on market 67 days. Have you received any prior offers? Is the seller open to a 6% concession, seller financing, or rate buy-down credit?
- Built in 1976 — when were the roof, HVAC, electrical panel, plumbing, and water heater last replaced?
- What's the actual annual flood-insurance premium (NFIP or private), and is the property in a SFHA with mandatory coverage?
- What does the HOA fee cover, when was the last increase, and are there any pending special assessments or reserve-fund shortfalls?
- Why hasn't it sold? Are there any deal-killer items the seller is aware of (foundation, flood, title, zoning, code violations)?
- Is there a deadline driving the sale (1031 exchange, divorce, estate, relocation)? That informs how much negotiation room exists.
- Schools are D-rated, which usually means shorter tenancies and higher turnover. Who's the typical renter profile here, and what's been the actual vacancy rate?
- What's the average days-on-market for RENTAL listings here right now (not sales)? A rising rental-DOM trend means longer vacancies and softer asking-rent achievability than the comps imply.
- What's the recent tenant-quality profile in this submarket — average credit score on applications, eviction rate, late-payment / NSF rate, and stable-employment percentage? A property-management company in the area should have these aggregated.
- How much new for-sale + rental construction is in the pipeline within 1–3 miles? Heavy new supply typically softens prices + rents 12–24 months out; constrained supply supports both.
Investment metrics
- 1% rule
- 2.48% ✓
- Cap rate
- 21.04%
- Cash-on-cash
- 52.68%
- DSCR
- 3.34
- GRM
- 3.4
CMA / ARV
- ARV (on-the-fly)
- $152,400
- Comps found
- 12
Show comp detail 12 sales within ~0.75 mi
| Address | Dist | Beds/Ba | Sqft | Sold | Price | $/sf | Match |
|---|---|---|---|---|---|---|---|
| 4314 12th Street Ct E | 0.18mi | 3/2.0 | 1,190 (-1%) | 2mo | $105,000 | $88 | 84 |
| 4547 12th Street Ct E | 0.19mi | 2/2.0 (-1) | 1,176 (-2%) | 6mo | $61,000 | $52 | 74 |
| 1508 45th Ave E | 0.30mi | 3/2.0 | 1,188 (-1%) | 10mo | $150,000 | $126 | 72 |
| 4214 15th St E | 0.31mi | 2/2.0 (-1) | 1,152 (-4%) | 1mo | $220,000 | $191 | 69 |
| 1206 45th Avenue Dr E | 0.07mi | 2/2.0 (-1) | 1,056 (-12%) | 2mo | $135,000 | $128 | 66 |
| 4404 13th St E | 0.21mi | 2/2.0 (-1) | 1,144 (-5%) | 13mo | $145,000 | $127 | 63 |
| 1216 41st Avenue Dr E | 0.33mi | 2/2.0 (-1) | 1,170 (-2%) | 13mo | $153,000 | $131 | 60 |
| 4111 E 13th St E | 0.32mi | 2/2.0 (-1) | 1,300 (+8%) | 2mo | $260,000 | $200 | 60 |
| 4711 15th Street Ct E | 0.33mi | 2/2.0 (-1) | 1,232 (+3%) | 14mo | $245,000 | $199 | 60 |
| 4508 14th St E | 0.23mi | 2/2.0 (-1) | 1,056 (-12%) | 3mo | $110,000 | $104 | 58 |
| 4207 13th St E | 0.27mi | 2/2.0 (-1) | 1,056 (-12%) | 3mo | $123,000 | $116 | 56 |
| 4119 13th St E | 0.29mi | 2/2.0 (-1) | 1,056 (-12%) | 7mo | $109,000 | $103 | 52 |
Match score weights: distance 35% · size 25% · config 20% · recency 20%. Top-matched comps best support the ARV.
Projected returns pro-forma
-3.0% appreciation · 3.0% rent growth · sell at horizon
- IRR
- 47.9%
- Equity multiple
- 3.09×
- Total profit
- $65,786
- Equity at exit
- $16,789
- IRR
- 53.6%
- Equity multiple
- 6.26×
- Total profit
- $165,799
- Equity at exit
- $9,736
Cash invested: $31,528 (down + closing). Projections, not guarantees.
Landlord ↔ Tenant lean methodology
- Overall (STATE)
- 87 Strongly Landlord-Friendly
- State Florida
- 87 Strongly Landlord-Friendly · R+3
- County
- — inherits STATE
- City
- — inherits STATE
ZIP-level market 34222
- Home prices YoY
- -26.9%
- Active inventory
- 182
- Price-to-rent
- 3.4×
Monthly cashflow live
- Estimated rent
- $2,796 high interval (Pro) →
- Mortgage (P&I)
- −$590
- Tax from tax record
- −$137 /mo · $1,644/yr
- Insurance
- −$47
- Flood insurance flood zone
- −$66 /mo · $798/yr
- HOA
- −$50
- Vacancy / Maint / Mgmt
- −$587
- Net cashflow
- $1,318
Break-even live
UW: 25.0% down · 7.5% · 30yr · 1.5% tax · 5.0% vac · 8.0% maint · 8.0% mgmt
Financing live
Cash to close
- Down payment
- $28,150
- Closing costs
- $3,378
- Reserves months
- —
- Total cash needed
- —
Loan-product check · same deal, 3 products live
Conventional
25% down · 7.5% · 30yr
- Down + closing
- —
- Monthly P&I
- —
- Monthly cashflow
- —
- DSCR
- —
- Eligible?
- —
Personal DTI + credit; lowest rate.
DSCR
20% down · 8.5% · 30yr
- Down + closing
- —
- Monthly P&I
- —
- Monthly cashflow
- —
- DSCR
- —
- Eligible?
- —
No personal income docs; deal must DSCR.
Hard money
10% down · 12.0% · 12mo
- Down + closing
- —
- Monthly P&I
- —
- Monthly cashflow
- —
- DSCR
- —
- Eligible?
- —
Short-term bridge; refi at stabilization.
Rent comps 10 comps
| Address | Beds | Baths | Sqft | Rent | $/sqft | DOM | Units | Dist |
|---|---|---|---|---|---|---|---|---|
| 4612 8th Street Ct E Ellenton, FL | 2.0 | 2.0 | 1210 | $3,000 | $2.48 | 23d | 1 | 0.20mi |
| 4711 8th Street Ct E Ellenton, FL | 2.0 | 1.0 | 1350 | $2,100 | $1.56 | 23d | 1 | 0.23mi |
| 5021 US Highway 301 N Ellenton, FL | 3.0 | 2.5 | 861 | $3,900 | $4.53 | 3d | 1 | 0.31mi |
| 4403 7th St E #4 Ellenton, FL | 2.0 | 2.0 | 1079 | $2,700 | $2.50 | 23d | 1 | 0.38mi |
| 4180 Yardly Dr Palmetto, FL | 1.0–3.0 | 1.0–2.0 | 1021 | $3,139 | $3.07 | 3d | 15 | 0.48mi |
| 1651 36th Ave E Ellenton, FL | 1.0–3.0 | 1.0–2.0 | 804 | $1,619 | $2.01 | 3d | 13 | 0.86mi |
| 850 Tidewater Shores Loop #402 Bradenton, FL | 2.0 | 2.0 | 1151 | $2,650 | $2.30 | 23d | 1 | 1.03mi |
| 5942 Factory Shops Blvd Ellenton, FL | 1.0–3.0 | 1.0–2.0 | 953 | $3,300 | $3.46 | 1d | 67 | 1.14mi |
| 2710 59th Dr E Ellenton, FL | 1.0–3.0 | 1.0–2.0 | 1149 | $2,829 | $2.46 | 3d | 37 | 1.35mi |
| 4915 1st Ave E Bradenton, FL | 3.0–4.0 | 2.5 | 1469 | $1,999 | $1.36 | 2d | 15 | 1.50mi |
HOA detail
- Monthly dues
- $50 · $600/yr
Listing history 19 events
-
2026-06-18days on market $112,599 Active 67 DOM
-
2026-06-17days on market $112,599 Active 66 DOM
-
2026-06-16days on market $112,599 Active 65 DOM
-
2026-06-15days on market $112,599 Active 64 DOM
-
2026-06-13days on market $112,599 Active 62 DOM
-
2026-06-13days on market $112,599 Active 61 DOM
-
2026-06-10days on market $112,599 Active 59 DOM
-
2026-06-09days on market $112,599 Active 58 DOM
-
2026-06-08days on market $112,599 Active 57 DOM
-
2026-06-08days on market $112,599 Active 56 DOM
-
2026-06-03days on market $112,599 Active 52 DOM
-
2026-06-02days on market $112,599 Active 51 DOM
-
2026-06-01days on market $112,599 Active 50 DOM
-
2026-05-31days on market $112,599 Active 49 DOM
-
2026-05-11status Active
-
2026-04-08status Pending
-
2026-03-10$112,599 Active
-
2001-08-13soldstatus $59,900
-
1997-11-06soldstatus $56,900
ⓘ Source: listings_history table (triggers on properties + properties_extension) + one-shot
backfill from property_details.listing_events for pre-trigger history.
Tax reassessment forecast FL · Resets to sale price
- Current annual tax
- $1,644 · $137/mo
- Projected year-2 tax
- $1,644 · $137/mo
- Expected delta
- $0/yr ($0/mo · 0.0%)
ⓘ Screening estimate from a state-policy table — verify with the county assessor before closing.
Climate risk First Street
- Flood 7/10 Severe FEMA zone X (shaded) · 92% chance over 30 yrs
- Wildfire 2/10 Low
- Heat 10/10 Extreme 6 d/yr ≥107°F today · 24 d/yr by 30 yrs out
- Wind 10/10 Extreme 99% chance of damaging wind over 30 yrs
- Air quality 3/10 Moderate 3 unhealthy d/yr today · 3 by 30 yrs out
Nearby sold comps map
Loading sold comps map…
Walkable amenities ~0.75 mi
Loading nearby amenities…
Taxation est. · year 1
- Rental income
- $33,546
- − Mortgage interest
- −$6,307
- − Property taxes
- −$1,644
- − Insurance
- −$1,360
- − Repairs & maintenance
- −$2,684
- − Management
- −$2,684
- − HOA
- −$600
- − Depreciation
- −$3,276
- Taxable income
- $14,992
- Est. tax owed @ 24.0%
- −$3,598
- After-tax cash flow
- $12,214/yr
For passive investors: Depreciation is non-cash, so a rental often shows a tax loss while cash-flowing — sheltering income. Rental losses are passive: they offset passive income freely, and up to $25,000/yr can offset ordinary (W-2) income if you actively participate and your MAGI is under $100k (phasing out to $0 by $150k); unused losses carry forward. On sale, claimed depreciation is recaptured at up to 25%, and gains may owe capital-gains tax (a 1031 exchange can defer both). Figures are a year-1 estimate at your 24.0% rate — not tax advice; consult a CPA.
Schools (NCES district)
- District
- Manatee
- NCES district ID
- 1201230
- Math proficiency
- 54% ▼ -6.00%
- Reading proficiency
- 50% ▼ -2.00%
- Median HH income
- $49,607
- Composite
- 44.43/100
- National rank
- #2806
- State rank
- #26 of 73 in FL
Livability — Ellenton
- Score
- 76/100
- State rank
- #232
- US rank
- #3666
Category grades
Schools grade is shown separately in the Schools card above.
Census & demographics
- Census place
- Ellenton, FL
- County
- Manatee County · 416,364 people
- City population
- 227,091
- Metro
- North Port-Sarasota-Bradenton, FL
- Population (ZIP)
- 14,819
- Household income
- $64,355
- Rent vs Own
- Severe rent burden
- 313.0
Population outlook (Manatee County) Hauer SSP2
- Today (2025)
- 447,342 people
- By 2030
- 488,911 · +9.3%
- By 2040
- 567,934 · +27.0%
- By 2050
- 637,995 · +42.6%
- By 2075
- 781,970 · +74.8%
- By 2100
- 848,272 · +89.6%
Race, ethnicity, and origin ACS 2023
- Neighborhood character
- Predominantly White (70%)
- Race & ethnicity
- White 70% Hispanic / Latino 17% Two or more races 13% Black 7% Native American 2% Asian 1%
- Hispanic origin (detail)
- Mexican 8% Puerto Rican 2%
- Common ancestry
- Romanian 3% Slovak 2% Lithuanian 2%
- Foreign-born
- 8% · Canada, Jamaica, Vietnam
- Languages at home
- 88% English-only · Spanish 10% Other Indo-European 1% Vietnamese 1%
Political lean MEDSL · Manatee
- 2024 margin
- Strong R (+23.5) · D 37.9% · R 61.4%
- 2008→2024 swing
- -16.5pp toward R · 2008: -7.0pp · 2024: -23.5pp
- All cycles
- 2024: R+23.5 2020: R+16.1 2016: R+17.1 2012: R+12.5 2008: R+7.0
Not yet ingested
- Civics
- —
Market trends
- HPI YoY
- ▼ -107.75%
- Current HPI
- 293.2597
- Rent YoY
- —
- Metro
- North Port-Sarasota-Bradenton, FL
- State GDP YoY
- ▲ 3.28%
- F500 in state
- 36
Industry mix (Fortune 500 HQ in FL)
| Industry | F500 HQs | Revenue |
|---|---|---|
| Industrial Technology | 2 | $29B |
|
||
| Insurance | 2 | $17B |
|
||
| Retail | 1 | $60B |
|
||
| Technology Distribution | 1 | $58B |
|
||
| Homebuilding | 1 | $35B |
|
||
| Technology Manufacturing | 1 | $35B |
|
||
Price history
+97.9% since first listed5 events — show timeline
- 2026-05-11 Relisted — Stellar MLS as Distributed by MLS Grid
- 2026-04-08 Pending — Stellar MLS as Distributed by MLS Grid
- 2026-03-10 Listed $112,599 Stellar MLS as Distributed by MLS Grid
- 2001-08-13 Sold (Public Records) $59,900 Public Records
- 1997-11-06 Sold (Public Records) $56,900 Public Records
Property tax history
+9.1%/yrLatest (2025): $1,644 · +0.1% YoY. Source: county tax records.
Cash-flow waterfall
monthlySold comps — $/sqft
last 12 mo · ≤1 miLoading sold comps…