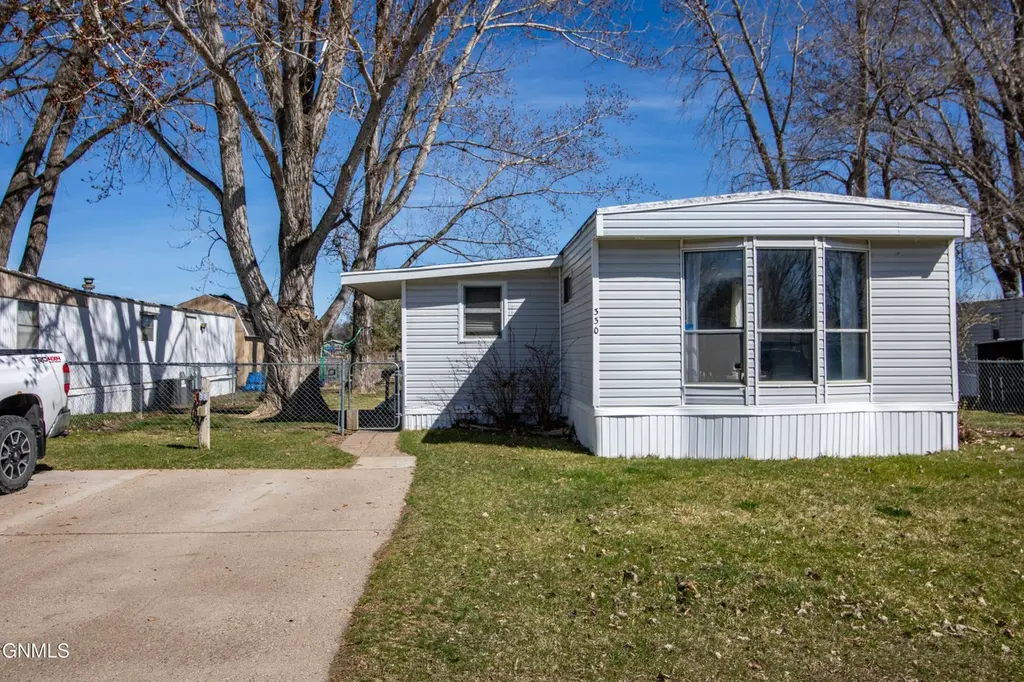
330 Bedford Blvd · Bismarck, ND
Flood risk 1/10 · Minimal
- FEMA flood zone
- X (shaded)
- Chance of flooding over 30 yrs
- 0.0%
- Est. flood insurance / yr
- $473 – $860
Fire risk 3/10 · Minor
- Est. fire insurance / yr
- $1,289 – $2,393
Heat risk 2/10 · Minimal
- Hot days now (above 97°F)
- 7 days/yr
- Hot days in 30 yrs
- 12 days/yr
Wind risk 2/10 · Minimal
- Chance of severe wind over 30 yrs
- —
Air-quality risk 4/10 · Minor
- Unhealthy air days now
- 5 days/yr
- Unhealthy air days in 30 yrs
- 5 days/yr
Risk factors via First Street. Map © Google.
Why this score? — see what drove the C- grade
The composite is a weighted blend of 9 inputs, each scored 0–100. Each bar is that input's sub-score; the figure is the points it added to the 100-point composite (weight × sub-score).
- Cash flow +15.0/30.0
- ARV discount +15.0/15.0
- 1% rule +5.0/10.0
- DSCR +5.0/10.0
- Livability +4.0/5.0
- Schools +3.7/10.0
- Rent growth +3.2/5.0
- Condition / age +2.5/5.0
- Appreciation +0.0/10.0
$35,000
🖨 Deal sheet (PDF) 📄 Offer letter ✓ Due diligence
Listing remarks MLS
Nice and Spacious - Nice Kitchen - 2 Full Baths- - Lot Rent $205
Key facts
- Custom double shower
- Copper fixtures
- Built in desk
Tags
Property features AI
Exterior
- Parking: Carport; No garage
- Utilities: Public water; Public sewer
- Home design: Mobile home (single wide); One level; Residential property
- Construction: Vinyl siding
- Exterior features: Private yard; Storage
Interior
- Kitchen: Microwave; Range; Refrigerator
- Bedrooms: Total rooms: 11 (includes bedrooms and other rooms)
- Flooring: Hardwood
- Bathrooms: 2 full bathrooms
- Heating & cooling: Forced air heating; Ceiling fans; Central air
- Interior features: Ceiling fans; Walk-in closets; Exhaust fan
- Laundry & utility: Washer; Dryer
Neighborhood map
What this means for you Summary
Snapshot
- This is a 2-bed/2.0-bath manufactured listed at $35k.
Deal economics
- At list price, monthly cash flow is $1k ($12k/yr) — positive.
- The deal already cash-flows at list — no discount required.
- Meets the 1% rule at list price ($2k rent vs $35k).
- Cap rate 41.9% vs local median 3.1% in Bismarck — top-decile yield for the area; either an underpriced asset or a hidden risk that comps aren't pricing in. Stress-test before assuming the spread holds.
Location & tenants
- Location reads 79/100 on livability (#5 in ND, #2,213 nationally) — a middle-class / working-renter tenant base. Strengths: housing A+, health & safety A+, cost of living A; Watch: crime C-, amenities D+, commute F.
- Bismarck 1 (urban): math 41% / reading 42% proficiency, ranked #25 of 53 in ND (top 47%) — families likely to look elsewhere, expect single-tenant / working-renter base with shorter leases; only 19% free/reduced lunch — higher-income household profile.
- Market conditions: Rents rising (+2.8%/yr); 258 active listings in the ZIP; 19 comparable units currently listed for rent nearby; rentals at typical pace (median 22d on market — plan ~3-4 weeks tenant-placement turnaround); solid renter incomes; 259 units permitted in Burleigh County in 2024 (0 in 5+ unit buildings).
Forward outlook
- Local home prices are declining (-3.0%/yr); year-one equity from $242 of loan paydown is wiped out by about $1k of value loss. Plan a longer hold.
- Burleigh County population projected at +61% by 2050 — long-run rental-demand tailwind backs the buy-and-hold thesis.
- At projected returns (-3.0% appreciation + 2.8% rent growth), your $10k cash investment doubles in ~1 year — after that, you're playing with house money.
Negotiation context
- Only 11 days on market — expect competitive offers; lowballing is unlikely to land.
- 3 sale attempts since 29y ago with the ask held roughly flat each time — persistent listings suggest the price (not the market) is what's stuck; bring a comps-based counter.
Questions for the listing agent
- Is there a deadline driving the sale (1031 exchange, divorce, estate, relocation)? That informs how much negotiation room exists.
- Schools are B-rated — typically a magnet for longer-tenancy family renters. What's the average tenant stay here, and is there a school-zone premium baked into asking?
- What's the average days-on-market for RENTAL listings here right now (not sales)? A rising rental-DOM trend means longer vacancies and softer asking-rent achievability than the comps imply.
- What's the recent tenant-quality profile in this submarket — average credit score on applications, eviction rate, late-payment / NSF rate, and stable-employment percentage? A property-management company in the area should have these aggregated.
- How much new for-sale + rental construction is in the pipeline within 1–3 miles? Heavy new supply typically softens prices + rents 12–24 months out; constrained supply supports both.
Investment metrics
- 1% rule
- 4.55% ✓
- Cap rate
- 41.95%
- Cash-on-cash
- 127.34%
- DSCR
- 6.67
- GRM
- 1.8
CMA / ARV
- ARV (on-the-fly)
- $44,800
- Comps found
- 12
Show comp detail 12 sales within ~0.75 mi
| Address | Dist | Beds/Ba | Sqft | Sold | Price | $/sf | Match |
|---|---|---|---|---|---|---|---|
| 330 Bedford Blvd | 0.00mi | 2/2.0 | 1,280 (0%) | 1mo | $35,000 | $27 | 99 |
| 414 Bedford Blvd | 0.08mi | 2/2.0 | 1,216 (-5%) | 1mo | $30,000 | $25 | 87 |
| 314 Sussex St | 0.27mi | 2/1.5 | 1,224 (-4%) | 2mo | $69,900 | $57 | 76 |
| 610 Yorkshire Ln | 0.25mi | 3/2.0 (+1) | 1,216 (-5%) | 2mo | $32,720 | $27 | 74 |
| 305 Oxford Dr | 0.35mi | 3/2.0 (+1) | 1,280 (0%) | 10mo | $44,900 | $35 | 70 |
| 418 Yorkshire Ln | 0.17mi | 3/2.0 (+1) | 1,216 (-5%) | 11mo | $52,500 | $43 | 70 |
| 508 Stratford Dr | 0.20mi | 3/2.0 (+1) | 1,344 (+5%) | 12mo | $55,000 | $41 | 67 |
| 454 Piccadilly Cir | 0.44mi | 3/1.5 (+1) | 1,344 (+5%) | 2mo | $30,000 | $22 | 63 |
| 444 Piccadilly Cir | 0.42mi | 3/2.0 (+1) | 1,248 (-2%) | 14mo | $55,000 | $44 | 60 |
| 504 Sherwood Ln | 0.33mi | 3/2.0 (+1) | 1,152 (-10%) | 14mo | $25,500 | $22 | 51 |
| 301 Oxford Dr | 0.35mi | 3/2.0 (+1) | 1,456 (+14%) | 8mo | $44,900 | $31 | 49 |
| 303 Sussex St | 0.28mi | 3/2.0 (+1) | 1,456 (+14%) | 17mo | $54,900 | $38 | 45 |
Match score weights: distance 35% · size 25% · config 20% · recency 20%. Top-matched comps best support the ARV.
Projected returns pro-forma
-3.0% appreciation · 2.81% rent growth · sell at horizon
- IRR
- —
- Equity multiple
- 7.15×
- Total profit
- $60,269
- Equity at exit
- $5,219
- IRR
- —
- Equity multiple
- 14.94×
- Total profit
- $136,566
- Equity at exit
- $3,026
Cash invested: $9,800 (down + closing). Projections, not guarantees.
Landlord ↔ Tenant lean methodology
- Overall (STATE)
- 82 Strongly Landlord-Friendly
- State North Dakota
- 82 Strongly Landlord-Friendly · R+20
- County
- — inherits STATE
- City
- — inherits STATE
ZIP-level market 58504
- Rents YoY
- 2.8%
- Active inventory
- 258
- Price-to-rent
- 1.8×
Monthly cashflow live
- Estimated rent
- $1,593 high interval (Pro) →
- Mortgage (P&I)
- −$184
- Tax from tax record
- −$20 /mo · $246/yr
- Insurance
- −$15
- HOA
- −$0
- Vacancy / Maint / Mgmt
- −$335
- Net cashflow
- $1,040
Break-even live
Sensitivity live
| Price | -10% $1,060 | -5% $1,050 | +0% $1,040 | +5% $1,030 | +10% $1,020 |
|---|---|---|---|---|---|
| Rent | -10% $914 | -5% $977 | +0% $1,040 | +5% $1,103 | +10% $1,166 |
| Rate | -1.0pp $1,058 | -0.5pp $1,049 | base $1,040 | +0.5pp $1,031 | +1.0pp $1,022 |
UW: 25.0% down · 7.5% · 30yr · 1.5% tax · 5.0% vac · 8.0% maint · 8.0% mgmt
Financing live
Cash to close
- Down payment
- $8,750
- Closing costs
- $1,050
- Reserves months
- —
- Total cash needed
- —
Loan-product check · same deal, 3 products live
Conventional
25% down · 7.5% · 30yr
- Down + closing
- —
- Monthly P&I
- —
- Monthly cashflow
- —
- DSCR
- —
- Eligible?
- —
Personal DTI + credit; lowest rate.
DSCR
20% down · 8.5% · 30yr
- Down + closing
- —
- Monthly P&I
- —
- Monthly cashflow
- —
- DSCR
- —
- Eligible?
- —
No personal income docs; deal must DSCR.
Hard money
10% down · 12.0% · 12mo
- Down + closing
- —
- Monthly P&I
- —
- Monthly cashflow
- —
- DSCR
- —
- Eligible?
- —
Short-term bridge; refi at stabilization.
Rent comps 19 comps
| Address | Beds | Baths | Sqft | Rent | $/sqft | DOM | Units | Dist |
|---|---|---|---|---|---|---|---|---|
| 127 Stuttgart Dr Unit 1 Bismarck, ND | 2.0 | 2.0 | 1600 | $1,400 | $0.88 | 21d | 1 | 0.19mi |
| 119 Irvine Loop Bismarck, ND | 3.0 | 1.0–2.0 | 974 | $2,058 | $2.11 | 21d | 1 | 0.31mi |
| 100 Santa Fe Ave Unit 1204 Bismarck, ND | 2.0 | 2.0 | 976 | $1,525 | $1.56 | 21d | 1 | 0.44mi |
| 100 Santa Fe Ave Unit 5214 Bismarck, ND | 2.0 | 2.0 | 1206 | $1,860 | $1.54 | 21d | 1 | 0.44mi |
| 100 Santa Fe Ave Unit 2210 Bismarck, ND | 2.0 | 2.0 | 1039 | $1,595 | $1.54 | 21d | 1 | 0.44mi |
| 100 Santa Fe Ave Unit 5322 Bismarck, ND | 2.0 | 2.0 | 1250 | $1,890 | $1.51 | 21d | 1 | 0.47mi |
| 100 Santa Fe Ave Unit 3111 Bismarck, ND | 2.0 | 2.0 | 1206 | $1,670 | $1.38 | 21d | 1 | 0.47mi |
| 1543 S Washington St Bismarck, ND | 3.0 | 2.0 | 1500 | $2,050 | $1.37 | 21d | 1 | 0.49mi |
| 2900 Kamrose Dr Bismarck, ND | 3.0 | 1.0–2.0 | 1040 | $2,172 | $2.09 | 21d | 33 | 0.60mi |
| 121 Sleeper Way Lincoln, ND | 3.0 | 2.5 | 1619 | $2,395 | $1.48 | 21d | 1 | 0.92mi |
| 109 W Burleigh Ave Bismarck, ND | 1.0–3.0 | 1.0–2.0 | 1050 | $1,208 | $1.15 | 21d | 1 | 1.01mi |
| 2130 S 12th St Bismarck, ND | 1.0–3.0 | 1.0–2.0 | 1152 | $1,620 | $1.41 | 21d | 12 | 1.02mi |
| 172 Boise Ave Bismarck, ND | 2.0 | 1.0 | 1200 | $1,050 | $0.88 | 21d | 1 | 1.02mi |
| 2020 S 12th St Bismarck, ND | 3.0 | 1.0–2.0 | 1185 | $1,748 | $1.48 | 21d | 19 | 1.04mi |
| 205 E Arbor Ave Bismarck, ND | 2.0 | 2.0 | 1031 | $995 | $0.97 | 21d | 1 | 1.16mi |
| 215 E Arbor Ave Unit 201-302E Bismarck, ND | 2.0 | 1.0 | 1100 | $995 | $0.90 | 21d | 1 | 1.18mi |
| 215 E Arbor Ave Unit 205-305G Bismarck, ND | 2.0 | 2.0 | 1031 | $995 | $0.97 | 21d | 1 | 1.18mi |
| 215 E Arbor Ave Unit 201-203E Bismarck, ND | 1.0 | 1.0 | 900 | $950 | $1.06 | 21d | 1 | 1.18mi |
| 201 E Arbor Ave Bismarck, ND | 2.0 | 1.0 | 1100 | $995 | $0.90 | 21d | 1 | 1.19mi |
Listing history 6 events
-
2026-05-04status Pending
-
2026-04-23$35,000 Active
-
2002-05-16soldstatus 64-char remark
Show marketing remark (64 chars)
Nice and Spacious - Nice Kitchen - 2 Full Baths- - Lot Rent $205
-
2002-02-12$13,500 64-char remark
Show marketing remark (64 chars)
Nice and Spacious - Nice Kitchen - 2 Full Baths- - Lot Rent $205
-
1997-06-09soldstatus 101-char remark
Show marketing remark (101 chars)
8X12 YARD SHED-15X7 ENTRY-ALL APPLIANCES INCLUDED-SEVERAL NEW WINDOWS-TATLEY MEADOWS Basement - NONE.
-
1997-04-21$11,800 101-char remark
Show marketing remark (101 chars)
8X12 YARD SHED-15X7 ENTRY-ALL APPLIANCES INCLUDED-SEVERAL NEW WINDOWS-TATLEY MEADOWS Basement - NONE.
ⓘ Source: listings_history table (triggers on properties + properties_extension) + one-shot
backfill from property_details.listing_events for pre-trigger history.
Tax reassessment forecast ND · Resets to sale price
- Current annual tax
- $246 · $20/mo
- Projected year-2 tax
- $343 · $29/mo
- Expected delta
- +$97/yr (+$8/mo · 39.4%)
ⓘ Screening estimate from a state-policy table — verify with the county assessor before closing.
Climate risk First Street
- Flood 1/10 Low FEMA zone X (shaded) · 0% chance over 30 yrs
- Wildfire 3/10 Moderate
- Heat 2/10 Low 7 d/yr ≥97°F today · 12 d/yr by 30 yrs out
- Wind 2/10 Low
- Air quality 4/10 Moderate 5 unhealthy d/yr today · 5 by 30 yrs out
Nearby sold comps map
Loading sold comps map…
Walkable amenities ~0.75 mi
Loading nearby amenities…
Taxation est. · year 1
- Rental income
- $19,118
- − Mortgage interest
- −$1,961
- − Property taxes
- −$246
- − Insurance
- −$175
- − Repairs & maintenance
- −$1,529
- − Management
- −$1,529
- − Depreciation
- −$1,018
- Taxable income
- $12,659
- Est. tax owed @ 24.0%
- −$3,038
- After-tax cash flow
- $9,441/yr
For passive investors: Depreciation is non-cash, so a rental often shows a tax loss while cash-flowing — sheltering income. Rental losses are passive: they offset passive income freely, and up to $25,000/yr can offset ordinary (W-2) income if you actively participate and your MAGI is under $100k (phasing out to $0 by $150k); unused losses carry forward. On sale, claimed depreciation is recaptured at up to 25%, and gains may owe capital-gains tax (a 1031 exchange can defer both). Figures are a year-1 estimate at your 24.0% rate — not tax advice; consult a CPA.
Schools (NCES district)
- District
- Bismarck 1
- NCES district ID
- 3800014
- Math proficiency
- 41% ▼ -5.00%
- Reading proficiency
- 42% ▼ -6.00%
- Median HH income
- $60,649
- Composite
- 36.76/100
- National rank
- #4577
- State rank
- #25 of 53 in ND
Livability — Bismarck
- Score
- 79/100
- State rank
- #5
- US rank
- #2213
Category grades
Schools grade is shown separately in the Schools card above.
Census & demographics
- Census place
- Bismarck, ND
- County
- Burleigh County · 97,300 people
- City population
- 97,300
- Metro
- Bismarck, ND
- Population (ZIP)
- 30,212
- Household income
- $85,637
- Rent vs Own
- Severe rent burden
- 400.0
Population outlook (Burleigh County) Hauer SSP2
- Today (2025)
- 119,359 people
- By 2030
- 133,047 · +11.5%
- By 2040
- 161,545 · +35.3%
- By 2050
- 191,960 · +60.8%
- By 2075
- 274,569 · +130.0%
- By 2100
- 350,910 · +194.0%
Race, ethnicity, and origin ACS 2023
- Neighborhood character
- Predominantly White (84%)
- Race & ethnicity
- White 84% Native American 8% Two or more races 5% Hispanic / Latino 4%
- Common ancestry
- Portuguese 13% Scotch-Irish 5% Romanian 2%
- Foreign-born
- 2% · Canada
- Languages at home
- 97% English-only · Spanish 2%
Political lean MEDSL · Burleigh
- 2024 margin
- Solid R (+43.2) · D 27.5% · R 70.7% · Other 1.8%
- 2008→2024 swing
- -19.7pp toward R · 2008: -23.6pp · 2024: -43.2pp
- All cycles
- 2024: R+43.2 2020: R+40.2 2016: R+46.1 2012: R+32.1 2008: R+23.6
Not yet ingested
- Civics
- —
Market trends
- HPI YoY
- ▼ -158.70%
- Current HPI
- 210.0651
- Rent YoY
- ▲ 2.81%
- Metro
- Bismarck, ND
- State GDP YoY
- ▲ 2.09%
- F500 in state
- 2
Industry mix (Fortune 500 HQ in ND)
| Industry | F500 HQs | Revenue |
|---|---|---|
| Utilities / Construction | 1 | $6B |
|
||
Price history
+196.6% since first listed6 events — show timeline
- 2026-05-04 Pending — GNMLS
- 2026-04-23 Listed $35,000 GNMLS
- 2002-05-16 Sold (MLS) — GNMLS
- 2002-02-12 Listed $13,500 GNMLS
- 1997-06-09 Sold (MLS) — GNMLS
- 1997-04-21 Listed $11,800 GNMLS
Cash-flow waterfall
monthlySold comps — $/sqft
last 12 mo · ≤1 miLoading sold comps…