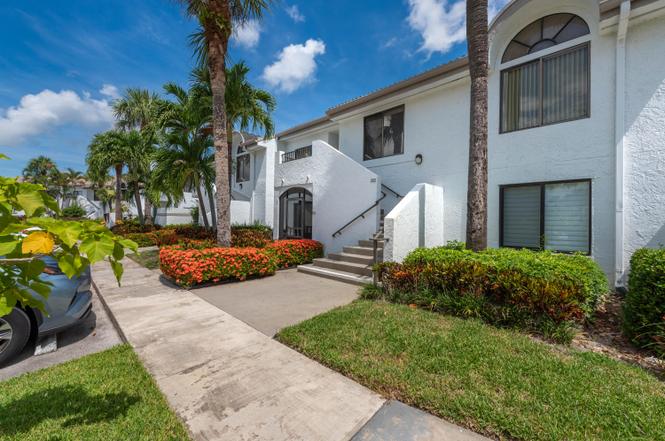
7689 Glendevon Ln #1807 · Boca Raton, FL
Flood risk 1/10 · Minimal
- FEMA flood zone
- X (unshaded)
- Chance of flooding over 30 yrs
- 0.0%
- Est. flood insurance / yr
- $507 – $1,088
Fire risk 4/10 · Minor
- Est. fire insurance / yr
- $947 – $1,759
Heat risk 9/10 · Severe
- Hot days now (above 107°F)
- 7 days/yr
- Hot days in 30 yrs
- 26 days/yr
Wind risk 10/10 · Severe
- Chance of severe wind over 30 yrs
- 99.0%
Air-quality risk 2/10 · Minimal
- Unhealthy air days now
- 2 days/yr
- Unhealthy air days in 30 yrs
- 2 days/yr
Risk factors via First Street. Map © Google.
Why this score? — see what drove the C grade
The composite is a weighted blend of 9 inputs, each scored 0–100. Each bar is that input's sub-score; the figure is the points it added to the 100-point composite (weight × sub-score).
- Cash flow +16.3/30.0
- 1% rule +7.6/10.0
- ARV discount +7.5/15.0
- Appreciation +5.3/10.0
- DSCR +5.1/10.0
- Schools +4.3/10.0
- Livability +3.9/5.0
- Rent growth +2.6/5.0
- Condition / age +2.5/5.0
$199,000
🖨 Deal sheet 📄 Offer letter ✓ Due diligence
Listing remarks
Wake up every day to shimmering waterfront and sweeping golf views of Legends Hole 12. This stunning 2-bedroom, 2-bath residence offers soaring vaulted ceilings that flood the home with natural light and create an airy, open ambiance. Widely regarded as one of the best views in Gleneagles, this home is perfectly positioned to capture serene water and fairway vistas that instantly relax and inspire. Nestled in the heart of Delray Beach, Gleneagles Country Club is a prestigious, all-ages mandatory membership community offering an unmatched lifestyle: two 18-hole championship golf courses, 19 tennis courts, 8 pickleball courts, 8 community pools, three dining rooms, two lounges, card rooms, an
Key facts
- Golf views
- Waterfront views
- Fitness center
Tags
Property features AI
Finance
- Other: Pets allowed with breed restrictions; Community has 1,082 units
- HOA & community: Community association with monthly fee; Monthly HOA fee approximately $603; Amenities include clubhouse, fitness center, golf course, spa/hot tub, tennis courts, cafe/restaurant, community room, internet included, pickleball courts, putting green, sidewalks
Exterior
- Utilities: Public water; Public sewer
- Home design: Condominium; 2 stories; Resale condition; Build model: Walten Hagen
- Construction: Frame and stucco construction; Other construction materials
- Exterior features: Waterfront property; Sewer available; Water available
Interior
- Kitchen: Dishwasher; Electric range; Microwave; Refrigerator
- Bedrooms: No main-level bedrooms
- Bathrooms: 2 full bathrooms
- Heating & cooling: Central heating; Central air conditioning
- Interior features: Cathedral ceilings; Vaulted ceilings; Split bedroom layout; Unfurnished
- Laundry & utility: Electric water heater
Neighborhood map
What this means for you Summary
Snapshot
- This is a 2-bed/2.0-bath condo listed at $199k.
Deal economics
- At list price, monthly cash flow is $110 ($1k/yr) — positive.
- The deal already cash-flows at list — no discount required.
- Meets the 1% rule at list price ($3k rent vs $199k).
- Recommended offer: $175k (12.0% below list) — sets the bar for market timing.
- Cap rate 7.0% vs local median 2.8% in Boca Raton — top-decile yield for the area; either an underpriced asset or a hidden risk that comps aren't pricing in. Stress-test before assuming the spread holds.
Location & tenants
- Location reads 77/100 on livability (#192 in FL, #3,070 nationally) — a middle-class / working-renter tenant base. Strengths: employment A+, health & safety A+, crime B+; Watch: amenities D, cost of living F.
- Palm Beach (suburban): math 46% / reading 53% proficiency, ranked #34 of 73 in FL (top 47%) — families likely to look elsewhere, expect single-tenant / working-renter base with shorter leases.
- Zoned schools: Orchard View Elementary School (math 48% / reading 47%, grade D, #1,182 of 2,144 statewide, top 55%, 596 students, 76% FRL); Spanish River Community High School (math 64% / reading 74%, grade B, #63 of 667 statewide, top 10%, 2,578 students, 25% FRL) — zoned schools at 50% FRL track the district average.
- Market conditions: Rents flat; 577 active listings in the ZIP; 40 comparable units currently listed for rent nearby; rentals at typical pace (median 22d on market — plan ~3-4 weeks tenant-placement turnaround); solid renter incomes; 3,974 units permitted in Palm Beach County in 2024 (1,012 in 5+ unit buildings).
Forward outlook
- In year one you build about $3k of equity ($1k loan paydown + $1k appreciation (0.7% local appreciation)).
- Palm Beach County population projected at +30% by 2050 — long-run rental-demand tailwind backs the buy-and-hold thesis.
- By year 10, paydown + projected appreciation supports a ~$30k cash-out refi (75% LTV) — recoverable capital for the next deal without selling this one.
Negotiation context
- It's been on market 135 days — a 12% lower offer ($175k) is reasonable based on typical stale-listing flexibility.
- 12 sale attempts since 25y ago; this cycle's ask has dropped $50k (20%) from the opening price — seller is motivated, your offer sets the floor, not the list.
- Current owner paid $39k; list at $199k implies a 410% gain — meaningful room to come down on a strong offer.
Risks & watch-outs
- Watch-outs: HOA is 24% of rent.
- Climate carrying-cost: severe wind risk, 99% chance of damaging wind over 30y; extreme-heat days projected 7→26/yr by 2055 (HVAC capex compounding) — expect insurance premiums to compound above CPI over the hold.
Questions for the listing agent
- It's been on market 135 days. Have you received any prior offers? Is the seller open to a 12% concession, seller financing, or rate buy-down credit?
- What does the HOA fee cover, when was the last increase, and are there any pending special assessments or reserve-fund shortfalls?
- Any open or pending special assessments — roof, HVAC, plumbing, elevator, façade? What's the per-unit balance and payoff schedule, and is the seller paying it off at close or rolling it to the buyer?
- Why hasn't it sold? Are there any deal-killer items the seller is aware of (foundation, flood, title, zoning, code violations)?
- Is there a deadline driving the sale (1031 exchange, divorce, estate, relocation)? That informs how much negotiation room exists.
- Schools are A-rated — typically a magnet for longer-tenancy family renters. What's the average tenant stay here, and is there a school-zone premium baked into asking?
- What's the average days-on-market for RENTAL listings here right now (not sales)? A rising rental-DOM trend means longer vacancies and softer asking-rent achievability than the comps imply.
- What's the recent tenant-quality profile in this submarket — average credit score on applications, eviction rate, late-payment / NSF rate, and stable-employment percentage? A property-management company in the area should have these aggregated.
- How much new apartment / multifamily construction is in the pipeline within 1–3 miles? Heavy new supply (>2% of stock underway) typically softens rents 12–24 months out; light construction supports rent growth.
Investment metrics
- 1% rule
- 1.26% ✓
- Cap rate
- 6.95%
- Cash-on-cash
- 2.36%
- DSCR
- 1.11
- GRM
- 6.6
CMA / ARV
No comps found within radius.
Projected returns pro-forma
0.69% appreciation · 0.51% rent growth · sell at horizon
- IRR
- 0.7%
- Equity multiple
- 1.03×
- Total profit
- $1,881
- Equity at exit
- $64,712
- IRR
- 3.6%
- Equity multiple
- 1.39×
- Total profit
- $21,755
- Equity at exit
- $83,556
Cash invested: $55,720 (down + closing). Projections, not guarantees.
Landlord ↔ Tenant lean methodology
- Overall (STATE)
- 87 Strongly Landlord-Friendly
- State Florida
- 87 Strongly Landlord-Friendly · R+3
- County
- — inherits STATE
- City
- — inherits STATE
ZIP-level market 33446
- Home prices YoY
- 0.3%
- Rents YoY
- 0.5%
- Active inventory
- 577
- Price-to-rent
- 6.6×
Monthly cashflow live
- Estimated rent
- $2,511 high interval (Pro) →
- Mortgage (P&I)
- −$1,044
- Tax from tax record
- −$144 /mo · $1,734/yr
- Insurance
- −$83
- HOA
- −$603
- Vacancy / Maint / Mgmt
- −$527
- Net cashflow
- $110
Break-even live
UW: 25.0% down · 7.5% · 30yr · 1.5% tax · 5.0% vac · 8.0% maint · 8.0% mgmt
Financing live
Cash to close
- Down payment
- $49,750
- Closing costs
- $5,970
- Reserves months
- —
- Total cash needed
- —
Loan-product check · same deal, 3 products live
Conventional
25% down · 7.5% · 30yr
- Down + closing
- —
- Monthly P&I
- —
- Monthly cashflow
- —
- DSCR
- —
- Eligible?
- —
Personal DTI + credit; lowest rate.
DSCR
20% down · 8.5% · 30yr
- Down + closing
- —
- Monthly P&I
- —
- Monthly cashflow
- —
- DSCR
- —
- Eligible?
- —
No personal income docs; deal must DSCR.
Hard money
10% down · 12.0% · 12mo
- Down + closing
- —
- Monthly P&I
- —
- Monthly cashflow
- —
- DSCR
- —
- Eligible?
- —
Short-term bridge; refi at stabilization.
Rent comps 40 comps
| Address | Beds | Baths | Sqft | Rent | $/sqft | DOM | Units | Dist |
|---|---|---|---|---|---|---|---|---|
| 7509 Glendevon Ln #1002 Delray Beach, FL | 2.0 | 2.0 | 1399 | $9,500 | $6.79 | 17d | 1 | 0.01mi |
| 7455 Glendevon Ln #206 Delray Beach, FL | 2.0 | 2.0 | 1260 | $9,500 | $7.54 | 24d | 1 | 0.01mi |
| 7533 Glendevon Ln #907 Delray Beach, FL | 2.0 | 2.0 | 1311 | $8,000 | $6.10 | 15d | 1 | 0.01mi |
| 15694 Loch Maree Ln #5903 Delray Beach, FL | 2.0 | 2.0 | 1705 | $9,000 | $5.28 | 15d | 1 | 0.22mi |
| 7254 Clunie Pl #15002 Delray Beach, FL | 2.0 | 2.0 | 1311 | $9,000 | $6.86 | 24d | 1 | 0.23mi |
| 15711 Loch Maree Ln #4702 Delray Beach, FL | 2.0 | 2.0 | 1688 | $10,000 | $5.92 | 24d | 1 | 0.27mi |
| 15831 Loch Maree Ln #5502 Delray Beach, FL | 2.0 | 2.0 | 1340 | $9,500 | $7.09 | 13d | 1 | 0.32mi |
| 7657 Lexington Club Blvd Delray Beach, FL | 3.0 | 2.0 | 1645 | $4,500 | $2.74 | 24d | 1 | 0.49mi |
| 7512 Eagle Point Dr Delray Beach, FL | 3.0 | 2.0 | 1463 | $4,000 | $2.73 | 4d | 1 | 0.50mi |
| 7512 Eagle Point Dr Unit 7512 Delray Beach, FL | 3.0 | 2.0 | 1463 | $4,000 | $2.73 | 19d | 1 | 0.50mi |
| 16021 Loch Katrine Trl #7405 Delray Beach, FL | 2.0 | 2.0 | 1311 | $9,500 | $7.25 | 24d | 1 | 0.51mi |
| 16032 Lomond Hills Trl #152 Delray Beach, FL | 2.0 | 2.0 | 1415 | $10,000 | $7.07 | 21d | 1 | 0.52mi |
| 15085 Michelangelo Blvd #202 Delray Beach, FL | 3.0 | 2.0 | 1238 | $2,700 | $2.18 | 22d | 1 | 0.53mi |
| 15145 Michelangelo Blvd #102 Delray Beach, FL | 3.0 | 2.0 | 1238 | $2,600 | $2.10 | 3d | 1 | 0.54mi |
| 15145 Michelangelo Blvd #102 Delray Beach, FL | 3.0 | 2.0 | 1238 | $2,600 | $2.10 | 24d | 1 | 0.54mi |
| 15306 W Tranquility Lake Dr Delray Beach, FL | 2.0 | 2.0 | 1175 | $2,850 | $2.43 | 11d | 1 | 0.54mi |
| 15055 Michelangelo Blvd Delray Beach, FL | 2.0–3.0 | 2.0 | 1158 | $2,125 | $1.83 | 22d | 2 | 0.57mi |
| 15065 Michelangelo Blvd #105 Delray Beach, FL | 2.0 | 2.0 | 1079 | $2,400 | $2.22 | 2d | 1 | 0.59mi |
| 15065 Michelangelo Blvd #105 Delray Beach, FL | 2.0 | 2.0 | 1079 | $2,400 | $2.22 | 22d | 1 | 0.59mi |
| 15155 Michelangelo Blvd #106 Delray Beach, FL | 2.0 | 2.0 | 1079 | $2,400 | $2.22 | 24d | 1 | 0.59mi |
| 15155 Michelangelo Blvd #106 Delray Beach, FL | 2.0 | 2.0 | 1079 | $2,400 | $2.22 | 20d | 1 | 0.59mi |
| 15212 W Tranquility Lake Dr Unit 15212 Delray Beach, FL | 2.0 | 2.0 | 1175 | $3,250 | $2.77 | 22d | 1 | 0.60mi |
| 15155 Michelangelo Blvd Delray Beach, FL | 2.0 | 2.0 | 1079 | $2,288 | $2.12 | 8d | 2 | 0.60mi |
| 15005 Michelangelo Blvd Delray Beach, FL | 2.0–3.0 | 2.0 | 1234 | $2,050 | $1.66 | 2d | 22 | 0.60mi |
| 15035 Michelangelo Blvd #103 Delray Beach, FL | 2.0 | 2.0 | 1079 | $2,000 | $1.85 | 24d | 1 | 0.61mi |
| 15015 Michelangelo Blvd #102 Delray Beach, FL | 3.0 | 2.0 | 1238 | $2,499 | $2.02 | 24d | 1 | 0.65mi |
| 15015 Michelangelo Blvd #102 Delray Beach, FL | 3.0 | 2.0 | 1238 | $2,499 | $2.02 | 3d | 1 | 0.65mi |
| 7607 Atlantic Ave Delray Beach, FL | 1.0–2.0 | 1.0–2.0 | 1086 | $3,494 | $3.22 | 2d | 6 | 0.65mi |
| 417 Brittany Dr #417 Delray Beach, FL | 2.0 | 2.0 | 880 | $1,750 | $1.99 | 21d | 1 | 0.70mi |
| 233 Brittany Dr Unit 233 Delray Beach, FL | 2.0 | 2.0 | 988 | $1,700 | $1.72 | 24d | 1 | 0.73mi |
| 564 Brittany L Delray Beach, FL | 2.0 | 2.5 | 880 | $1,800 | $2.05 | 24d | 1 | 0.73mi |
| 233 Brittany F Unit F Delray Beach, FL | 2.0 | 2.0 | 988 | $1,600 | $1.62 | 24d | 1 | 0.73mi |
| 292 Brittany Ave #292 Delray Beach, FL | 2.0 | 2.0 | 880 | $1,700 | $1.93 | 4d | 1 | 0.73mi |
| 233 Brittany F Unit F Delray Beach, FL | 2.0 | 2.0 | 988 | $1,600 | $1.62 | 8d | 1 | 0.73mi |
| 537 Brittany K Unit 537 Delray Beach, FL | 2.0 | 2.0 | 880 | $1,700 | $1.93 | 24d | 1 | 0.73mi |
| 568 Brittany L Delray Beach, FL | 2.0 | 2.0 | 883 | $1,950 | $2.21 | 24d | 1 | 0.73mi |
| 260 Brittany F Unit F Delray Beach, FL | 2.0 | 2.0 | 880 | $1,600 | $1.82 | 2d | 1 | 0.73mi |
| 14898 Wedgefield Dr #202 Delray Beach, FL | 2.0 | 2.0 | 1103 | $2,000 | $1.81 | 17d | 1 | 0.77mi |
| 14895 Builtmore Way Delray Beach, FL | 2.0 | 2.0 | 1103 | $1,800 | $1.63 | 24d | 1 | 0.77mi |
| 213 Waterford I Delray Beach, FL | 2.0 | 2.0 | 880 | $1,600 | $1.82 | 24d | 1 | 0.77mi |
HOA detail condo
- Monthly dues
- $603 · $7,236/yr
- Likely covers
- waterpool
- Assessments
- None detected in remarks — confirm with the listing agent.
Listing history 39 events
-
2026-06-18days on market $199,000 Active 135 DOM
-
2026-06-17days on market $199,000 Active 134 DOM
-
2026-06-16days on market $199,000 Active 133 DOM
-
2026-06-15days on market $199,000 Active 132 DOM
-
2026-06-13days on market $199,000 Active 130 DOM
-
2026-06-09days on market $199,000 Active 126 DOM
-
2026-06-07days on market $199,000 Active 124 DOM
-
2026-06-04days on market $199,000 Active 121 DOM
-
2026-06-03days on market $199,000 Active 120 DOM
-
2026-06-01days on market $199,000 Active 118 DOM
-
2026-05-31days on market $199,000 Active 117 DOM
-
2026-05-20status Active
-
2026-05-08historical
-
2026-02-20price $199,000
-
2026-01-22$249,000 Active
-
2025-04-06historical $8,400
-
2025-03-27price $8,400
-
2025-02-26$9,000
-
2025-02-26historical $9,000
-
2025-02-25$9,000
-
2025-02-25historical
-
2024-11-30status Active
-
2024-10-31historical
-
2024-09-07$239,999 Active
-
2024-08-04historical
-
2024-01-23$275,000 Active
-
2023-12-16historical
-
2023-04-21$399,000 Active
-
2014-10-30historical
-
2014-06-24soldstatus $39,000
-
2014-06-20soldstatus $39,000 Closed
-
2014-05-26status Pending
-
2014-05-22$52,000 Active
-
2014-05-21historical
-
2013-07-23$48,000 Active
-
2011-07-28historical
-
2011-06-27$79,000
-
2001-11-12$110,000
-
1988-04-01soldstatus $97,500
ⓘ Source: listings_history table (triggers on properties + properties_extension) + one-shot
backfill from property_details.listing_events for pre-trigger history.
Tax reassessment forecast FL · Resets to sale price
- Current annual tax
- $1,734 · $144/mo
- Projected year-2 tax
- $1,734 · $144/mo
- Expected delta
- $0/yr ($0/mo · 0.0%)
ⓘ Screening estimate from a state-policy table — verify with the county assessor before closing.
Climate risk First Street
- Flood 1/10 Low FEMA zone X (unshaded) · 0% chance over 30 yrs
- Wildfire 4/10 Moderate
- Heat 9/10 Extreme 7 d/yr ≥107°F today · 26 d/yr by 30 yrs out
- Wind 10/10 Extreme 99% chance of damaging wind over 30 yrs
- Air quality 2/10 Low 2 unhealthy d/yr today · 2 by 30 yrs out
Nearby sold comps map
Loading sold comps map…
Walkable amenities ~0.75 mi
Loading nearby amenities…
Taxation est. · year 1
- Rental income
- $30,131
- − Mortgage interest
- −$11,147
- − Property taxes
- −$1,734
- − Insurance
- −$995
- − Repairs & maintenance
- −$2,410
- − Management
- −$2,410
- − HOA
- −$7,236
- − Depreciation
- −$5,789
- Taxable loss
- −$1,591
- Est. tax savings @ 24.0%
- +$382
- After-tax cash flow
- $1,698/yr
For passive investors: Depreciation is non-cash, so a rental often shows a tax loss while cash-flowing — sheltering income. Rental losses are passive: they offset passive income freely, and up to $25,000/yr can offset ordinary (W-2) income if you actively participate and your MAGI is under $100k (phasing out to $0 by $150k); unused losses carry forward. On sale, claimed depreciation is recaptured at up to 25%, and gains may owe capital-gains tax (a 1031 exchange can defer both). Figures are a year-1 estimate at your 24.0% rate — not tax advice; consult a CPA.
Schools (NCES district)
- District
- Palm Beach
- NCES district ID
- 1201500
- Math proficiency
- 46% ▼ -16.00%
- Reading proficiency
- 53% ▼ -4.00%
- Median HH income
- $53,943
- Composite
- 42.72/100
- National rank
- #3160
- State rank
- #34 of 73 in FL
Livability — Boca Raton
- Score
- 77/100
- State rank
- #192
- US rank
- #3070
Category grades
Schools grade is shown separately in the Schools card above.
Census & demographics
- County
- Palm Beach County · 1,438,312 people
- City population
- 250,102
- Metro
- Miami-Fort Lauderdale-Pompano Beach, FL
- Population (ZIP)
- 28,431
- Household income
- $80,187
- Rent vs Own
- Severe rent burden
- 494.0
Population outlook (Palm Beach County) Hauer SSP2
- Today (2025)
- 1,637,487 people
- By 2030
- 1,743,255 · +6.5%
- By 2040
- 1,948,712 · +19.0%
- By 2050
- 2,132,979 · +30.3%
- By 2075
- 2,530,027 · +54.5%
- By 2100
- 2,706,979 · +65.3%
Race, ethnicity, and origin ACS 2023
- Neighborhood character
- Predominantly White (79%)
- Race & ethnicity
- White 79% Hispanic / Latino 13% Two or more races 9% Black 4%
- Hispanic origin (detail)
- Puerto Rican 3% Dominican 1%
- Common ancestry
- Romanian 9% Scotch-Irish 9% Italian 2%
- Foreign-born
- 20% · Canada, Jamaica, Guatemala
- Languages at home
- 80% English-only · Spanish 12% Other Indo-European 2% French/Haitian/Cajun 2%
Political lean MEDSL · Palm Beach
- 2024 margin
- Toss-up / Even · D 50.0% · R 49.2%
- 2008→2024 swing
- -22.1pp toward R · 2008: 22.9pp · 2024: 0.8pp
- All cycles
- 2024: D+0.8 2020: D+12.8 2016: D+15.3 2012: D+17.0 2008: D+22.9
Not yet ingested
- Civics
- —
Market trends
- HPI YoY
- ▲ 0.69%
- Current HPI
- 242.5138
- Rent YoY
- ▲ 0.51%
- Metro
- Miami-Fort Lauderdale-Pompano Beach, FL
- State GDP YoY
- ▲ 3.28%
- F500 in state
- 36
Industry mix (Fortune 500 HQ in FL)
| Industry | F500 HQs | Revenue |
|---|---|---|
| Industrial Technology | 2 | $29B |
|
||
| Insurance | 2 | $17B |
|
||
| Retail | 1 | $60B |
|
||
| Technology Distribution | 1 | $58B |
|
||
| Homebuilding | 1 | $35B |
|
||
| Technology Manufacturing | 1 | $35B |
|
||
Price history
+104.1% since first listed28 events — show timeline
- 2026-05-20 Relisted — Beaches MLS
- 2026-05-08 Listing Removed — Beaches MLS
- 2026-02-20 Price Changed $199,000 Beaches MLS
- 2026-01-22 Listed $249,000 Beaches MLS
- 2025-04-06 Rental Removed $8,400 GFLMLS
- 2025-03-27 Price Changed $8,400 GFLMLS
- 2025-02-26 Listed for Rent $9,000 GFLMLS
- 2025-02-26 Rental Removed $9,000 RMLSFL
- 2025-02-25 Listed for Rent $9,000 RMLSFL
- 2025-02-25 Listing Removed — Beaches MLS
- 2024-11-30 Relisted — Beaches MLS
- 2024-10-31 Listing Removed — Beaches MLS
- 2024-09-07 Listed $239,999 Beaches MLS
- 2024-08-04 Listing Removed — Beaches MLS
- 2024-01-23 Listed $275,000 Beaches MLS
- 2023-12-16 Listing Removed — Beaches MLS
- 2023-04-21 Listed $399,000 Beaches MLS
- 2014-10-30 Listing Removed — Beaches MLS
- 2014-06-24 Sold (Public Records) $39,000 Public Records
- 2014-06-20 Sold (MLS) $39,000 Beaches MLS
- 2014-05-26 Pending — Beaches MLS
- 2014-05-22 Listed $52,000 Beaches MLS
- 2014-05-21 Listing Removed — Beaches MLS
- 2013-07-23 Listed $48,000 Beaches MLS
- 2011-07-28 Listing Removed — Beaches MLS
- 2011-06-27 Listed $79,000 Beaches MLS
- 2001-11-12 Listed $110,000 Beaches MLS
- 1988-04-01 Sold (Public Records) $97,500 Public Records
Property tax history
+5.8%/yrLatest (2025): $1,734 · -10.3% YoY. Source: county tax records.
Cash-flow waterfall
monthlySold comps — $/sqft
last 12 mo · ≤1 miLoading sold comps…