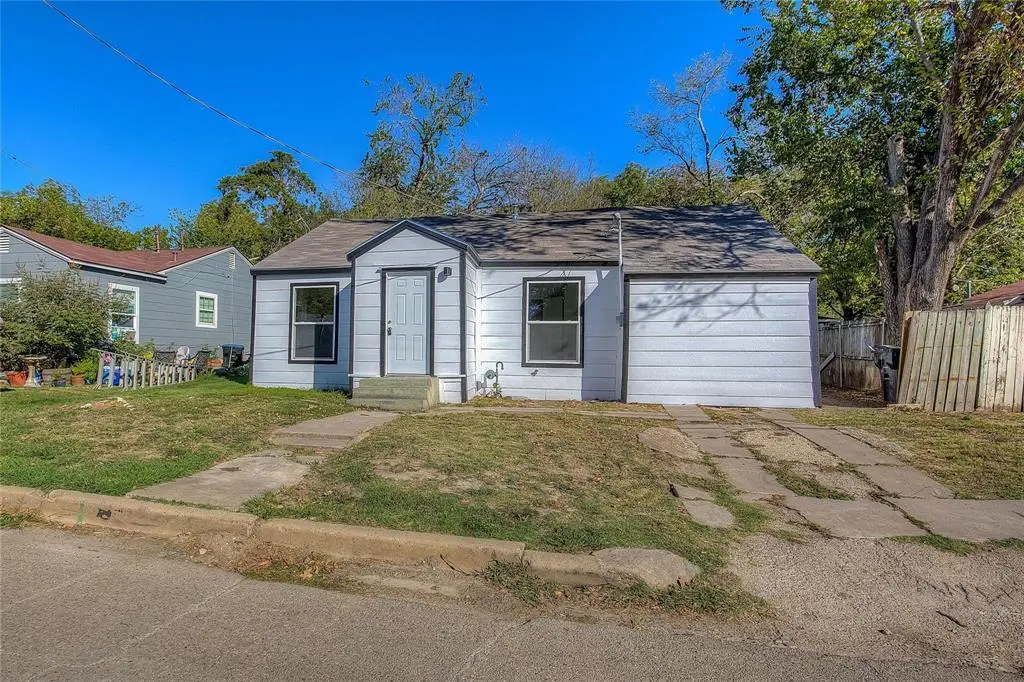
1908 Division St · Greenville, TX
Flood risk 1/10 · Minimal
- FEMA flood zone
- X (unshaded)
- Chance of flooding over 30 yrs
- 0.0%
- Est. flood insurance / yr
- $507 – $1,088
Fire risk 5/10 · Moderate
- Est. fire insurance / yr
- $1,222 – $2,270
Heat risk 7/10 · Major
- Hot days now (above 110°F)
- 7 days/yr
- Hot days in 30 yrs
- 23 days/yr
Wind risk 6/10 · Moderate
- Chance of severe wind over 30 yrs
- 27.0%
Air-quality risk 2/10 · Minimal
- Unhealthy air days now
- 1 days/yr
- Unhealthy air days in 30 yrs
- 1 days/yr
Risk factors via First Street. Map © Google.
Why this score? — see what drove the C- grade
The composite is a weighted blend of 9 inputs, each scored 0–100. Each bar is that input's sub-score; the figure is the points it added to the 100-point composite (weight × sub-score).
- Cash flow +19.5/30.0
- ARV discount +12.8/15.0
- DSCR +6.1/10.0
- 1% rule +4.9/10.0
- Livability +3.9/5.0
- Rent growth +2.7/5.0
- Condition / age +2.5/5.0
- Schools +2.0/10.0
- Appreciation +0.0/10.0
$151,900
🖨 Deal sheet 📄 Offer letter ✓ Due diligence
Listing remarks MLS
Experience the charm of this NEWLY REMODELED 3-bedroom, 2-bath home, where cozy comfort meets stylish updates. Beautiful, easy-to-maintain luxury vinyl plank (LVP) flooring flows throughout, adding warmth and durability. The living room provides a welcoming space for relaxation, while the kitchen is designed for functionality with modern finishes. Each bedroom offers a personal retreat, and both bathrooms are updated to provide a refreshing experience. Step outside to a large, fenced backyard—perfect for outdoor gatherings or enjoying a quiet moment. This home is move-in ready and waiting for you! OWNER FINANCING AVAILABLE!
Key facts
- Move-in ready
- 4,269 sq ft lot
- Garage
Tags
Neighborhood map
What this means for you Summary
Snapshot
- This is a 3-bed/2.0-bath single-family listed at $152k.
Deal economics
- At list price, monthly cash flow is $171 ($2k/yr) — positive.
- The deal already cash-flows at list — no discount required.
- To meet the 1% rule (rent ≥ 1% of price), the offer needs to be $150k (1.4% below list).
- Recommended offer: $134k (12.0% below list) — sets the bar for market timing.
- Cap rate 7.6% vs local median 4.1% in Greenville — top-decile yield for the area; either an underpriced asset or a hidden risk that comps aren't pricing in. Stress-test before assuming the spread holds.
Location & tenants
- Location reads 77/100 on livability (#78 in TX, #2,719 nationally) — a middle-class / working-renter tenant base. Strengths: cost of living A+, housing A+, health & safety A; Watch: employment D, schools D-, commute F.
- Greenville ISD (town): math 20% / reading 26% proficiency, ranked #743 of 826 in TX (top 90%) — low school quality limits family demand, transient renter base, plan for 1-2y turnover.
- Market conditions: Rents flat; 396 active listings in the ZIP; 40 comparable units currently listed for rent nearby; rentals at typical pace (median 24d on market — plan ~3-4 weeks tenant-placement turnaround); 1,289 units permitted in Hunt County in 2024 (527 in 5+ unit buildings).
Forward outlook
- Local home prices are declining (-3.0%/yr); year-one equity from $1k of loan paydown is wiped out by about $5k of value loss. Plan a longer hold.
- Hunt County population projected at +15% by 2050 — modest demand growth; plan on rents tracking national, not racing it.
Negotiation context
- It's been on market 161 days — a 12% lower offer ($134k) is reasonable based on typical stale-listing flexibility.
- 4 sale attempts since 4y ago with the ask held roughly flat each time — persistent listings suggest the price (not the market) is what's stuck; bring a comps-based counter.
Risks & watch-outs
- Watch-outs: built in 1950 — expect roof / HVAC / electrical / plumbing capex.
- Climate carrying-cost: major wind risk, 27% chance of damaging wind over 30y; moderate wildfire risk; extreme-heat days projected 7→23/yr by 2055 (HVAC capex compounding) — expect insurance premiums to compound above CPI over the hold.
Questions for the listing agent
- It's been on market 161 days. Have you received any prior offers? Is the seller open to a 12% concession, seller financing, or rate buy-down credit?
- Built in 1950 — when were the roof, HVAC, electrical panel, plumbing, and water heater last replaced?
- Why hasn't it sold? Are there any deal-killer items the seller is aware of (foundation, flood, title, zoning, code violations)?
- Is there a deadline driving the sale (1031 exchange, divorce, estate, relocation)? That informs how much negotiation room exists.
- Schools are D-rated, which usually means shorter tenancies and higher turnover. Who's the typical renter profile here, and what's been the actual vacancy rate?
- What's the average days-on-market for RENTAL listings here right now (not sales)? A rising rental-DOM trend means longer vacancies and softer asking-rent achievability than the comps imply.
- What's the recent tenant-quality profile in this submarket — average credit score on applications, eviction rate, late-payment / NSF rate, and stable-employment percentage? A property-management company in the area should have these aggregated.
- How much new for-sale + rental construction is in the pipeline within 1–3 miles? Heavy new supply typically softens prices + rents 12–24 months out; constrained supply supports both.
Investment metrics
- 1% rule
- 0.99% ✗
- Cap rate
- 7.65%
- Cash-on-cash
- 4.83%
- DSCR
- 1.21
- GRM
- 8.5
CMA / ARV
- ARV (median comp)
- $172,277
- List price
- $151,900
- Delta
- -11.83%
- Verdict
- UNDERPRICED
- Comps
- 20 within 1.0 mi
Show comp detail 12 sales within ~0.75 mi
| Address | Dist | Beds/Ba | Sqft | Sold | Price | $/sf | Match |
|---|---|---|---|---|---|---|---|
| 1800 Walworth St | 0.12mi | 3/1.5 | 1,084 (+2%) | 13mo | $135,000 | $125 | 78 |
| 4314 Johnson St | 0.29mi | 3/2.0 | 1,050 (-1%) | 10mo | $180,000 | $171 | 76 |
| 2104 Division St | 0.06mi | 3/2.0 | 1,160 (+9%) | 14mo | $174,000 | $150 | 71 |
| 1423 Morse St | 0.52mi | 3/2.0 | 1,028 (-3%) | 3mo | $175,000 | $170 | 68 |
| 3812 King St | 0.56mi | 3/1.0 | 1,065 (+0%) | 13mo | $59,000 | $55 | 59 |
| 1217 1/2 Morse St | 0.63mi | 3/2.0 | 1,064 (0%) | 15mo | $209,900 | $197 | 58 |
| 3006 Division St | 0.55mi | 2/1.0 (-1) | 1,092 (+3%) | 7mo | $130,000 | $119 | 55 |
| 2804 Horsley St | 0.45mi | 3/1.0 | 1,114 (+5%) | 15mo | $170,000 | $153 | 54 |
| 4022 Roberts St | 0.48mi | 2/1.0 (-1) | 1,165 (+10%) | 7mo | $109,000 | $94 | 47 |
| 1226 Coleman St | 0.48mi | 3/2.0 | 1,200 (+13%) | 13mo | $184,997 | $154 | 45 |
| 2615 Oneal St | 0.41mi | 2/1.0 (-1) | 936 (-12%) | 10mo | $129,900 | $139 | 44 |
| 832 Oneal St | 0.70mi | 3/2.0 | 1,194 (+12%) | 14mo | $219,900 | $184 | 35 |
Match score weights: distance 35% · size 25% · config 20% · recency 20%. Top-matched comps best support the ARV.
Projected returns pro-forma
-3.0% appreciation · 0.62% rent growth · sell at horizon
- IRR
- -11.4%
- Equity multiple
- 0.60×
- Total profit
- $-17,211
- Equity at exit
- $22,649
- IRR
- -6.0%
- Equity multiple
- 0.66×
- Total profit
- $-14,650
- Equity at exit
- $13,134
Cash invested: $42,532 (down + closing). Projections, not guarantees.
Landlord ↔ Tenant lean methodology
- Overall (STATE)
- 87 Strongly Landlord-Friendly
- State Texas
- 87 Strongly Landlord-Friendly · R+5
- County
- — inherits STATE
- City
- — inherits STATE
ZIP-level market 75401
- Home prices YoY
- -20.7%
- Rents YoY
- 0.6%
- Active inventory
- 396
- Price-to-rent
- 8.5×
Monthly cashflow live
- Estimated rent
- $1,497 high interval (Pro) →
- Mortgage (P&I)
- −$797
- Tax from tax record
- −$152 /mo · $1,822/yr
- Insurance
- −$63
- HOA
- −$0
- Vacancy / Maint / Mgmt
- −$314
- Net cashflow
- $171
Break-even live
UW: 25.0% down · 7.5% · 30yr · 1.5% tax · 5.0% vac · 8.0% maint · 8.0% mgmt
Financing live
Cash to close
- Down payment
- $37,975
- Closing costs
- $4,557
- Reserves months
- —
- Total cash needed
- —
Loan-product check · same deal, 3 products live
Conventional
25% down · 7.5% · 30yr
- Down + closing
- —
- Monthly P&I
- —
- Monthly cashflow
- —
- DSCR
- —
- Eligible?
- —
Personal DTI + credit; lowest rate.
DSCR
20% down · 8.5% · 30yr
- Down + closing
- —
- Monthly P&I
- —
- Monthly cashflow
- —
- DSCR
- —
- Eligible?
- —
No personal income docs; deal must DSCR.
Hard money
10% down · 12.0% · 12mo
- Down + closing
- —
- Monthly P&I
- —
- Monthly cashflow
- —
- DSCR
- —
- Eligible?
- —
Short-term bridge; refi at stabilization.
Rent comps 40 comps
| Address | Beds | Baths | Sqft | Rent | $/sqft | DOM | Units | Dist |
|---|---|---|---|---|---|---|---|---|
| 3907 Bois D Arc St Greenville, TX | 2.0 | 1.0 | 868 | $1,100 | $1.27 | 12d | 1 | 0.16mi |
| 4102 Gordon St Greenville, TX | 3.0 | 2.0 | 1296 | $1,675 | $1.29 | 7d | 1 | 0.18mi |
| 4102 Gordon St Greenville, TX | 3.0 | 2.0 | 1296 | $1,675 | $1.29 | 11d | 1 | 0.18mi |
| 4102 Gordon St Greenville, TX | 3.0 | 2.0 | 1296 | $1,675 | $1.29 | 24d | 1 | 0.18mi |
| 4205 Stuart St Greenville, TX | 3.0 | 2.0 | 1228 | $1,790 | $1.46 | 7d | 1 | 0.21mi |
| 1808 Oneal St Unit B Greenville, TX | 2.0 | 1.0 | 950 | $1,295 | $1.36 | 43d | 1 | 0.28mi |
| 4214 Johnson St Greenville, TX | 3.0 | 1.0 | 1096 | $1,250 | $1.14 | 24d | 1 | 0.28mi |
| 3415 Henderson St Greenville, TX | 3.0 | 2.0 | 1299 | $1,650 | $1.27 | 12d | 1 | 0.32mi |
| 1412 Hemphill St Greenville, TX | 3.0 | 2.0 | 1200 | $500 | $0.42 | 24d | 1 | 0.46mi |
| 4320 Wesley St Unit 13 Greenville, TX | 2.0 | 1.0 | 900 | $975 | $1.08 | 43d | 1 | 0.47mi |
| 3112 Travis St Greenville, TX | 3.0 | 2.0 | 1200 | $1,400 | $1.17 | 43d | 1 | 0.47mi |
| 2010 Morse St Greenville, TX | 3.0 | 2.0 | 1248 | $1,400 | $1.12 | 22d | 1 | 0.47mi |
| 1228 Jones St Greenville, TX | 3.0 | 2.0 | 1234 | $1,700 | $1.38 | 22d | 1 | 0.50mi |
| 2704 Jones St Greenville, TX | 3.0 | 2.0 | 1273 | $1,550 | $1.22 | 2d | 1 | 0.50mi |
| 1214 Interstate Highway 30 Greenville, TX | 1.0–3.0 | 1.0–2.0 | 900 | $1,500 | $1.67 | 1d | 1 | 0.58mi |
| 1110 Jones St Greenville, TX | 3.0 | 2.0 | 1090 | $1,440 | $1.32 | 2d | 1 | 0.58mi |
| 1107 Hemphill St Greenville, TX | 3.0 | 2.0 | 1090 | $1,190 | $1.09 | 43d | 1 | 0.61mi |
| 3110 Saint John St Unit B Greenville, TX | 3.0 | 2.0 | 1273 | $1,450 | $1.14 | 44d | 1 | 0.62mi |
| 3110 Saint John St Unit A Greenville, TX | 3.0 | 2.0 | 1273 | $1,425 | $1.12 | 43d | 1 | 0.62mi |
| 3110 Saint John St Unit B Greenville, TX | 3.0 | 2.0 | 1273 | $1,400 | $1.10 | 24d | 1 | 0.62mi |
| 3110 Saint John St Greenville, TX | 3.0 | 2.0 | 1273 | $1,500 | $1.18 | 43d | 1 | 0.62mi |
| 3110 Saint John St Unit A Greenville, TX | 3.0 | 2.0 | 1273 | $1,500 | $1.18 | 44d | 1 | 0.62mi |
| 1910 Joe Ramsey Blvd E Greenville, TX | 1.0–2.0 | 1.0–2.0 | 694 | $1,203 | $1.73 | 1d | 8 | 0.63mi |
| 3108 Stanford St Apt A Greenville, TX | 2.0 | 1.5 | 1020 | $1,185 | $1.16 | 43d | 1 | 0.68mi |
| 3214 King St Greenville, TX | 3.0 | 2.0 | 1068 | $1,250 | $1.17 | 11d | 1 | 0.70mi |
| 3305 Mineola St Unit A Greenville, TX | 3.0 | 2.0 | 1017 | $1,300 | $1.28 | 43d | 1 | 0.71mi |
| 3305 Mineola St Unit B Greenville, TX | 3.0 | 2.0 | 1017 | $1,350 | $1.33 | 43d | 1 | 0.71mi |
| 3118 Hemphill St Greenville, TX | 3.0 | 2.0 | 1125 | $1,600 | $1.42 | 43d | 1 | 0.76mi |
| 4701 Sayle St Greenville, TX | 2.0 | 2.0 | 988 | $1,450 | $1.47 | 1d | 1 | 0.81mi |
| 3412 Marshall St Unit A Greenville, TX | 3.0 | 2.0 | 1068 | $1,250 | $1.17 | 24d | 1 | 0.86mi |
| 3412 Marshall St Greenville, TX | 3.0 | 2.0 | 1068 | $1,250 | $1.17 | 2d | 1 | 0.86mi |
| 3420 Marshall St Unit B Greenville, TX | 3.0 | 1.0 | 838 | $1,380 | $1.65 | 2d | 1 | 0.88mi |
| 3507 Marshall St Unit C Greenville, TX | 2.0 | 1.0 | 784 | $1,100 | $1.40 | 24d | 1 | 0.91mi |
| 3507 Marshall St Unit C Greenville, TX | 2.0 | 1.0 | 784 | $1,075 | $1.37 | 22d | 1 | 0.91mi |
| 2901 Lee St Apt 1 Greenville, TX | 2.0 | 2.0 | 1250 | $1,575 | $1.26 | 43d | 1 | 0.93mi |
| 2203 Henry St Unit B Greenville, TX | 3.0 | 2.0 | 980 | $1,250 | $1.28 | 43d | 1 | 0.94mi |
| 2113 Henry St Unit B Greenville, TX | 3.0 | 2.0 | 1068 | $1,400 | $1.31 | 24d | 1 | 0.94mi |
| 2113 Henry St Greenville, TX | 3.0 | 2.0 | 1068 | $1,400 | $1.31 | 17d | 1 | 0.94mi |
| 2018 Henry St Unit A Greenville, TX | 3.0 | 1.0 | 838 | $1,030 | $1.23 | 15d | 1 | 0.96mi |
| 2203 Henry St Unit A Greenville, TX | 3.0 | 2.0 | 980 | $1,250 | $1.28 | 20d | 1 | 0.97mi |
Listing history 27 events
-
2026-06-18days on market $151,900 Active 161 DOM
-
2026-06-17days on market $151,900 Active 160 DOM
-
2026-06-16days on market $151,900 Active 159 DOM
-
2026-06-15days on market $151,900 Active 158 DOM
-
2026-06-13days on market $151,900 Active 156 DOM
-
2026-06-09days on market $151,900 Active 152 DOM
-
2026-06-08days on market $151,900 Active 151 DOM
-
2026-06-07days on market $151,900 Active 150 DOM
-
2026-06-04days on market $151,900 Active 147 DOM
-
2026-06-03days on market $151,900 Active 146 DOM
-
2026-06-02days on market $151,900 Active 145 DOM
-
2026-06-01days on market $151,900 Active 144 DOM
-
2026-05-31days on market $151,900 Active 143 DOM
-
2026-03-12price $151,900 637-char remark
Show marketing remark (637 chars)
Experience the charm of this NEWLY REMODELED 3-bedroom, 2-bath home, where cozy comfort meets stylish updates. Beautiful, easy-to-maintain luxury vinyl plank (LVP) flooring flows throughout, adding warmth and durability. The living room provides a welcoming space for relaxation, while the kitchen is designed for functionality with modern finishes. Each bedroom offers a personal retreat, and both bathrooms are updated to provide a refreshing experience. Step outside to a large, fenced backyard—perfect for outdoor gatherings or enjoying a quiet moment. This home is move-in ready and waiting for you! OWNER FINANCING AVAILABLE!
-
2026-01-08$152,000 Active 637-char remark
Show marketing remark (637 chars)
Experience the charm of this NEWLY REMODELED 3-bedroom, 2-bath home, where cozy comfort meets stylish updates. Beautiful, easy-to-maintain luxury vinyl plank (LVP) flooring flows throughout, adding warmth and durability. The living room provides a welcoming space for relaxation, while the kitchen is designed for functionality with modern finishes. Each bedroom offers a personal retreat, and both bathrooms are updated to provide a refreshing experience. Step outside to a large, fenced backyard—perfect for outdoor gatherings or enjoying a quiet moment. This home is move-in ready and waiting for you! OWNER FINANCING AVAILABLE!
-
2025-09-05historical
-
2025-08-07price $163,500
-
2025-06-03price $168,500
-
2025-04-29price $169,900
-
2025-04-01price $175,000
-
2025-03-05$179,900 Active
-
2025-02-10historical
-
2024-12-18price $174,990
-
2024-11-13price $175,000
-
2024-10-25$185,000 Active
-
2022-09-27price $101,000
-
2022-09-13$108,000 Active
ⓘ Source: listings_history table (triggers on properties + properties_extension) + one-shot
backfill from property_details.listing_events for pre-trigger history.
Tax reassessment forecast TX · Resets to sale price
- Current annual tax
- $1,822 · $152/mo
- Projected year-2 tax
- $2,780 · $232/mo
- Expected delta
- +$958/yr (+$80/mo · 52.6%)
ⓘ Screening estimate from a state-policy table — verify with the county assessor before closing.
Climate risk First Street
- Flood 1/10 Low FEMA zone X (unshaded) · 0% chance over 30 yrs
- Wildfire 5/10 Major
- Heat 7/10 Severe 7 d/yr ≥110°F today · 23 d/yr by 30 yrs out
- Wind 6/10 Major 27% chance of damaging wind over 30 yrs
- Air quality 2/10 Low 1 unhealthy d/yr today · 1 by 30 yrs out
Nearby sold comps map
Loading sold comps map…
Walkable amenities ~0.75 mi
Loading nearby amenities…
Taxation est. · year 1
- Rental income
- $17,969
- − Mortgage interest
- −$8,509
- − Property taxes
- −$1,822
- − Insurance
- −$760
- − Repairs & maintenance
- −$1,438
- − Management
- −$1,438
- − Depreciation
- −$4,419
- Taxable loss
- −$415
- Est. tax savings @ 24.0%
- +$100
- After-tax cash flow
- $2,155/yr
For passive investors: Depreciation is non-cash, so a rental often shows a tax loss while cash-flowing — sheltering income. Rental losses are passive: they offset passive income freely, and up to $25,000/yr can offset ordinary (W-2) income if you actively participate and your MAGI is under $100k (phasing out to $0 by $150k); unused losses carry forward. On sale, claimed depreciation is recaptured at up to 25%, and gains may owe capital-gains tax (a 1031 exchange can defer both). Figures are a year-1 estimate at your 24.0% rate — not tax advice; consult a CPA.
Schools (NCES district)
- District
- Greenville ISD
- NCES district ID
- 4821720
- Math proficiency
- 20% ▼ -12.00%
- Reading proficiency
- 26% ▼ -7.00%
- Median HH income
- $41,374
- Composite
- 19.56/100
- National rank
- #8759
- State rank
- #743 of 826 in TX
Livability — Greenville
- Score
- 77/100
- State rank
- #78
- US rank
- #2719
Category grades
Schools grade is shown separately in the Schools card above.
Census & demographics
- Census place
- Greenville, TX
- County
- Hunt County · 71,969 people
- City population
- 42,767
- Metro
- Dallas-Fort Worth-Arlington, TX
- Population (ZIP)
- 22,669
- Household income
- $59,908
- Rent vs Own
- Severe rent burden
- 638.0
Population outlook (Hunt County) Hauer SSP2
- Today (2025)
- 97,090 people
- By 2030
- 100,452 · +3.5%
- By 2040
- 106,544 · +9.7%
- By 2050
- 111,218 · +14.6%
- By 2075
- 121,695 · +25.3%
- By 2100
- 123,683 · +27.4%
Race, ethnicity, and origin ACS 2023
- Neighborhood character
- Diverse neighborhood (Simpson 0.62)
- Race & ethnicity
- White 51% Hispanic / Latino 32% Black 13% Two or more races 11%
- Hispanic origin (detail)
- Mexican 30%
- Common ancestry
- Slovak 2% Lithuanian 1% Iranian 1%
- Foreign-born
- 13% · Canada
- Languages at home
- 75% English-only · Spanish 24%
Political lean MEDSL · Hunt
- 2024 margin
- Solid R (+55.5) · D 21.9% · R 77.4%
- 2008→2024 swing
- -14.9pp toward R · 2008: -40.6pp · 2024: -55.5pp
- All cycles
- 2024: R+55.5 2020: R+52.5 2016: R+56.3 2012: R+51.2 2008: R+40.6
Not yet ingested
- Civics
- —
Market trends
- HPI YoY
- ▼ -88.45%
- Current HPI
- 339.0287
- Rent YoY
- ▲ 0.62%
- Metro
- Dallas-Fort Worth-Arlington, TX
- State GDP YoY
- ▲ 3.95%
- F500 in state
- 110
Industry mix (Fortune 500 HQ in TX)
| Industry | F500 HQs | Revenue |
|---|---|---|
| Energy | 16 | $1,198B |
|
||
| Technology | 5 | $198B |
|
||
| Engineering / Construction | 4 | $72B |
|
||
| Energy Services | 3 | $60B |
|
||
| Utilities | 3 | $41B |
|
||
| Healthcare | 2 | $330B |
|
||
Price history
+40.6% since first listed14 events — show timeline
- 2026-03-12 Price Changed $151,900 NTREIS
- 2026-01-08 Listed $152,000 NTREIS
- 2025-09-05 Listing Removed — NTREIS
- 2025-08-07 Price Changed $163,500 NTREIS
- 2025-06-03 Price Changed $168,500 NTREIS
- 2025-04-29 Price Changed $169,900 NTREIS
- 2025-04-01 Price Changed $175,000 NTREIS
- 2025-03-05 Listed $179,900 NTREIS
- 2025-02-10 Listing Removed — NTREIS
- 2024-12-18 Price Changed $174,990 NTREIS
- 2024-11-13 Price Changed $175,000 NTREIS
- 2024-10-25 Listed $185,000 NTREIS
- 2022-09-27 Price Changed $101,000 NTREIS
- 2022-09-13 Listed $108,000 NTREIS
Property tax history
+10.8%/yrLatest (2025): $1,822 · +21.6% YoY. Source: county tax records.
Cash-flow waterfall
monthlySold comps — $/sqft
last 12 mo · ≤1 miLoading sold comps…