405 W 1st St · Hedley, TX
Flood risk 1/10 · Minimal
- FEMA flood zone
- —
- Chance of flooding over 30 yrs
- 0.0%
- Est. flood insurance / yr
- —
Fire risk 10/10 · Severe
- Est. fire insurance / yr
- $1,222 – $2,270
Heat risk 5/10 · Moderate
- Hot days now (above 102°F)
- 7 days/yr
- Hot days in 30 yrs
- 20 days/yr
Wind risk 2/10 · Minimal
- Chance of severe wind over 30 yrs
- 1.0%
Air-quality risk 1/10 · Minimal
- Unhealthy air days now
- 0 days/yr
- Unhealthy air days in 30 yrs
- 0 days/yr
Risk factors via First Street. Map © Google.
Why this score? — see what drove the D+ grade
The composite is a weighted blend of 9 inputs, each scored 0–100. Each bar is that input's sub-score; the figure is the points it added to the 100-point composite (weight × sub-score).
- Cash flow +15.0/30.0
- ARV discount +7.5/15.0
- 1% rule +5.0/10.0
- DSCR +5.0/10.0
- Appreciation +5.0/10.0
- Schools +4.8/10.0
- Livability +2.8/5.0
- Rent growth +2.5/5.0
- Condition / age +1.0/5.0
$20,000
🖨 Deal sheet (PDF) 📄 Offer letter ✓ Due diligence
Listing remarks MLS
Take a look at this opportunity to own a home and invest.
Key facts
- Built 2021
- Listed 144 days
Neighborhood map
What this means for you Summary
Snapshot
- This is a 3-bed/1.0-bath single-family listed at $20k. Condition is rated poor.
Deal economics
- At list price, monthly cash flow is $604 ($7k/yr) — positive.
- The deal already cash-flows at list — no discount required.
- Meets the 1% rule at list price ($940 rent vs $20k).
- Recommended offer: $18k (12.0% below list) — sets the bar for market timing.
Location & tenants
- Location reads 55/100 on livability (#1,348 in TX) — a working-class tenant base; expect higher turnover. Strengths: cost of living A+; Watch: crime F, amenities F, commute F.
- Hedley ISD (rural): math 60% / reading 50% proficiency, ranked #236 of 1,141 in TX (top 21%) — acceptable for families but not a draw, mixed tenant base, ~2y average lease.
- Market conditions: 1 active listings in the ZIP; 1 units permitted in Donley County in 2024 (0 in 5+ unit buildings).
Forward outlook
- In year one you build about $738 of equity ($138 loan paydown + $600 appreciation (3.0% local appreciation)).
- Donley County population projected at -26% by 2050 — secular population decline; favor cash flow + early exit over multi-decade hold.
- At projected returns (3.0% appreciation + 3.0% rent growth), your $6k cash investment doubles in ~1 year — after that, you're playing with house money.
Negotiation context
- It's been on market 144 days — a 12% lower offer ($18k) is reasonable based on typical stale-listing flexibility.
Risks & watch-outs
- Climate carrying-cost: severe wildfire risk; extreme-heat days projected 7→20/yr by 2055 (HVAC capex compounding) — expect insurance premiums to compound above CPI over the hold.
Questions for the listing agent
- It's been on market 144 days. Have you received any prior offers? Is the seller open to a 12% concession, seller financing, or rate buy-down credit?
- Have any recent inspections been done? Can we get a copy of the seller's disclosures and any deferred-maintenance estimates?
- Why hasn't it sold? Are there any deal-killer items the seller is aware of (foundation, flood, title, zoning, code violations)?
- Is there a deadline driving the sale (1031 exchange, divorce, estate, relocation)? That informs how much negotiation room exists.
- Crime grade is F in this area — have there been break-ins, vandalism, or insurance claims at this property in the last 3 years? What carrier currently insures it and at what premium?
- The area grade is low — what's the realistic commute time and amenity access for the typical tenant pool here? Any planned neighborhood developments (good or bad) we should know about?
- What's the average days-on-market for RENTAL listings here right now (not sales)? A rising rental-DOM trend means longer vacancies and softer asking-rent achievability than the comps imply.
- What's the recent tenant-quality profile in this submarket — average credit score on applications, eviction rate, late-payment / NSF rate, and stable-employment percentage? A property-management company in the area should have these aggregated.
- How much new for-sale + rental construction is in the pipeline within 1–3 miles? Heavy new supply typically softens prices + rents 12–24 months out; constrained supply supports both.
Investment metrics
- 1% rule
- 4.70% ✓
- Cap rate
- 42.54%
- Cash-on-cash
- 129.47%
- DSCR
- 6.76
- GRM
- 1.8
CMA / ARV
No comps found within radius.
Projected returns pro-forma
3.0% appreciation · 3.0% rent growth · sell at horizon
- IRR
- —
- Equity multiple
- 8.30×
- Total profit
- $40,904
- Equity at exit
- $8,993
- IRR
- —
- Equity multiple
- 17.38×
- Total profit
- $91,709
- Equity at exit
- $13,859
Cash invested: $5,600 (down + closing). Projections, not guarantees.
Landlord ↔ Tenant lean methodology
- Overall (STATE)
- 87 Strongly Landlord-Friendly
- State Texas
- 87 Strongly Landlord-Friendly · R+5
- County
- — inherits STATE
- City
- — inherits STATE
ZIP-level market 79237
- Active inventory
- 1
- Price-to-rent
- 1.8×
Monthly cashflow live
- Estimated rent
- $940 medium interval (Pro) →
- Mortgage (P&I)
- −$105
- Tax est. 1.5%
- −$25 /mo · $300/yr
- Insurance
- −$8
- HOA
- −$0
- Vacancy / Maint / Mgmt
- −$197
- Net cashflow
- $604
Break-even live
Sensitivity live
| Price | -10% $618 | -5% $611 | +0% $604 | +5% $597 | +10% $590 |
|---|---|---|---|---|---|
| Rent | -10% $530 | -5% $567 | +0% $604 | +5% $641 | +10% $678 |
| Rate | -1.0pp $614 | -0.5pp $609 | base $604 | +0.5pp $599 | +1.0pp $594 |
UW: 25.0% down · 7.5% · 30yr · 1.5% tax · 5.0% vac · 8.0% maint · 8.0% mgmt
Financing live
Cash to close
- Down payment
- $5,000
- Closing costs
- $600
- Reserves months
- —
- Total cash needed
- —
Loan-product check · same deal, 3 products live
Conventional
25% down · 7.5% · 30yr
- Down + closing
- —
- Monthly P&I
- —
- Monthly cashflow
- —
- DSCR
- —
- Eligible?
- —
Personal DTI + credit; lowest rate.
DSCR
20% down · 8.5% · 30yr
- Down + closing
- —
- Monthly P&I
- —
- Monthly cashflow
- —
- DSCR
- —
- Eligible?
- —
No personal income docs; deal must DSCR.
Hard money
10% down · 12.0% · 12mo
- Down + closing
- —
- Monthly P&I
- —
- Monthly cashflow
- —
- DSCR
- —
- Eligible?
- —
Short-term bridge; refi at stabilization.
Listing history 16 events
-
2026-06-21days on market $20,000 Active 144 DOM
-
2026-06-18days on market $20,000 Active 142 DOM
-
2026-06-17days on market $20,000 Active 141 DOM
-
2026-06-16days on market $20,000 Active 140 DOM
-
2026-06-15days on market $20,000 Active 139 DOM
-
2026-06-13days on market $20,000 Active 137 DOM
-
2026-06-12days on market $20,000 Active 136 DOM
-
2026-06-10days on market $20,000 Active 133 DOM
-
2026-06-08days on market $20,000 Active 132 DOM
-
2026-06-08days on market $20,000 Active 131 DOM
-
2026-06-05days on market $20,000 Active 129 DOM
-
2026-06-03days on market $20,000 Active 127 DOM
-
2026-06-02days on market $20,000 Active 126 DOM
-
2026-06-01days on market $20,000 Active 125 DOM
-
2026-05-31days on market $20,000 Active 124 DOM
-
2026-01-27$20,000 Active 57-char remark
Show marketing remark (57 chars)
Take a look at this opportunity to own a home and invest.
ⓘ Source: listings_history table (triggers on properties + properties_extension) + one-shot
backfill from property_details.listing_events for pre-trigger history.
Climate risk First Street
- Flood 1/10 Low 0% chance over 30 yrs
- Wildfire 10/10 Extreme
- Heat 5/10 Major 7 d/yr ≥102°F today · 20 d/yr by 30 yrs out
- Wind 2/10 Low 100% chance of damaging wind over 30 yrs
- Air quality 1/10 Low 0 unhealthy d/yr today · 0 by 30 yrs out
Nearby sold comps map
Loading sold comps map…
Walkable amenities ~0.75 mi
Loading nearby amenities…
Taxation est. · year 1
- Rental income
- $11,277
- − Mortgage interest
- −$1,120
- − Property taxes
- −$300
- − Insurance
- −$100
- − Repairs & maintenance
- −$902
- − Management
- −$902
- − Depreciation
- −$582
- Taxable income
- $7,371
- Est. tax owed @ 24.0%
- −$1,769
- After-tax cash flow
- $5,481/yr
For passive investors: Depreciation is non-cash, so a rental often shows a tax loss while cash-flowing — sheltering income. Rental losses are passive: they offset passive income freely, and up to $25,000/yr can offset ordinary (W-2) income if you actively participate and your MAGI is under $100k (phasing out to $0 by $150k); unused losses carry forward. On sale, claimed depreciation is recaptured at up to 25%, and gains may owe capital-gains tax (a 1031 exchange can defer both). Figures are a year-1 estimate at your 24.0% rate — not tax advice; consult a CPA.
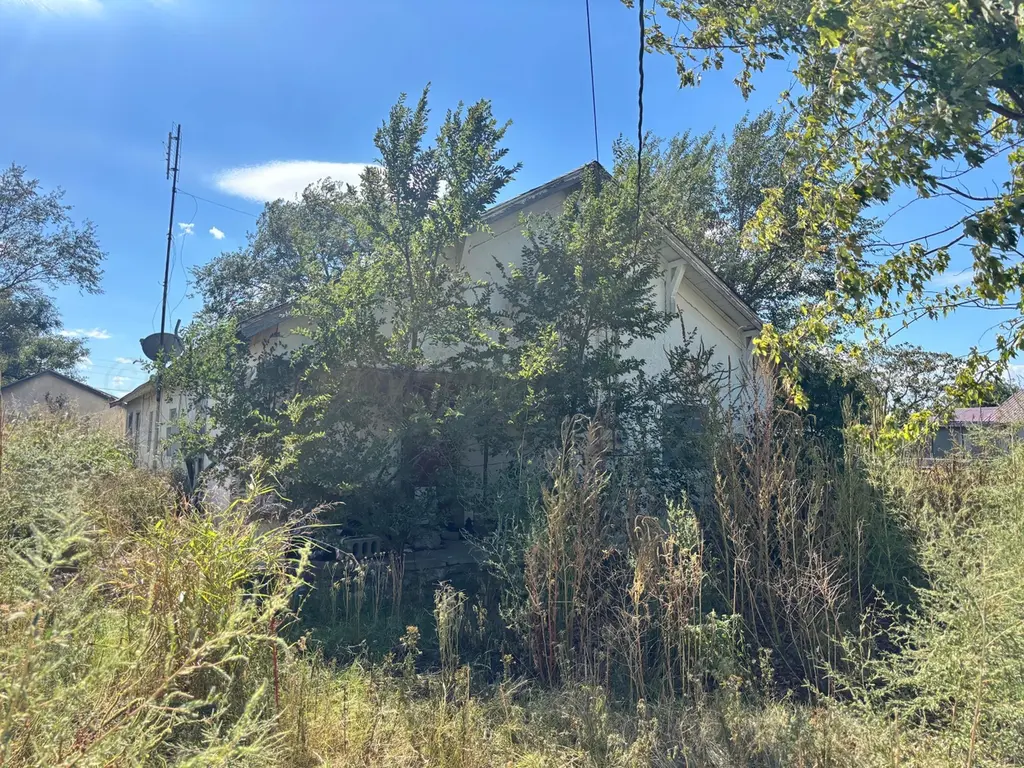
Condition & rehab AI · 1 photo
This property requires extensive renovation, including clearing overgrowth, repairing and painting the exterior and interior, and updating the kitchen and bathrooms. Significant value can be added through these improvements.
Repairs flagged
- Major exterior overgrowth — Vegetation obscures the entire exterior
- Major exterior siding — Cannot determine condition due to overgrowth
Value-add opportunities
- Both clear vegetation and exterior — Clearing vegetation would reveal the home's condition and improve curb appeal
- Both paint exterior — Painting the exterior would improve its appearance and value
- Both repair and paint interior walls — Painting interior walls would improve the home's appearance and value
- Both repair and update kitchen — A modern kitchen would significantly increase the home's value
- Both repair and update bathrooms — Modern bathrooms would significantly increase the home's value
- Both repair and update HVAC systems — Upgrading HVAC systems would improve comfort and energy efficiency
- Both landscaping and curb appeal — Landscaping would improve curb appeal and attract potential buyers
Renovation cost estimate screening
| Repair item | Severity | Est. cost |
|---|---|---|
| exterior overgrowth · Vegetation obscures the entire exterior | Major | $15,000–50,000 |
| exterior siding · Cannot determine condition due to overgrowth | Major | $15,000–50,000 |
| Total estimated repair cost · 2 items | $30,000–100,000 |
Value-add ROI direction
- Both clear vegetation and exterior — Clearing vegetation would reveal the home's condition and improve curb appeal ↑
- Both paint exterior — Painting the exterior would improve its appearance and value ↑
- Both repair and paint interior walls — Painting interior walls would improve the home's appearance and value ↑
- Both repair and update kitchen — A modern kitchen would significantly increase the home's value ↑
- Both repair and update bathrooms — Modern bathrooms would significantly increase the home's value ↑
- Both repair and update HVAC systems — Upgrading HVAC systems would improve comfort and energy efficiency ↑
- Both landscaping and curb appeal — Landscaping would improve curb appeal and attract potential buyers ↑
ⓘ Cost ranges are severity-bucket heuristics (US national rule-of-thumb). Get contractor quotes + a written scope before underwriting a rehab budget.
Schools (NCES district)
- District
- Hedley ISD
- NCES district ID
- 4822850
- Math proficiency
- 60% ▼ -10.00%
- Reading proficiency
- 50% ▼ -10.00%
- Median HH income
- $43,641
- Composite
- 48.16/100
- National rank
- #4735
- State rank
- #236 of 1141 in TX
Livability — Hedley
- Score
- 55/100
- State rank
- #1348
- US rank
- #23250
Category grades
Schools grade is shown separately in the Schools card above.
Census & demographics
- Census place
- Hedley, TX
- Population (ZIP)
- 470
Population outlook (Donley County) Hauer SSP2
- Today (2025)
- 3,008 people
- By 2030
- 2,777 · -7.7%
- By 2040
- 2,419 · -19.6%
- By 2050
- 2,224 · -26.1%
- By 2075
- 2,018 · -32.9%
- By 2100
- 1,949 · -35.2%
Race, ethnicity, and origin ACS 2023
- Neighborhood character
- Predominantly White (90%)
- Race & ethnicity
- White 90% Hispanic / Latino 9% Two or more races 4%
- Hispanic origin (detail)
- Mexican 4%
- Common ancestry
- Slovak 11% Serbian 2% Lithuanian 2%
- Foreign-born
- 3% · Canada
- Languages at home
- 96% English-only · Spanish 4%
Political lean MEDSL · Donley
- 2024 margin
- Solid R (+78.2) · D 10.2% · R 88.3% · Other 1.5%
- 2008→2024 swing
- -14.1pp toward R · 2008: -64.1pp · 2024: -78.2pp
- All cycles
- 2024: R+78.2 2020: R+75.2 2016: R+70.9 2012: R+69.2 2008: R+64.1
Not yet ingested
- Civics
- —
Market trends
- HPI YoY
- —
- Current HPI
- —
- Rent YoY
- —
- Metro
- —
- State GDP YoY
- ▲ 3.95%
- F500 in state
- 110
Industry mix (Fortune 500 HQ in TX)
| Industry | F500 HQs | Revenue |
|---|---|---|
| Energy | 16 | $1,198B |
|
||
| Technology | 5 | $198B |
|
||
| Engineering / Construction | 4 | $72B |
|
||
| Energy Services | 3 | $60B |
|
||
| Utilities | 3 | $41B |
|
||
| Healthcare | 2 | $330B |
|
||
Price history
1 event — show timeline
- 2026-01-27 Listed $20,000 AARMLS
Cash-flow waterfall
monthlySold comps — $/sqft
last 12 mo · ≤1 miLoading sold comps…