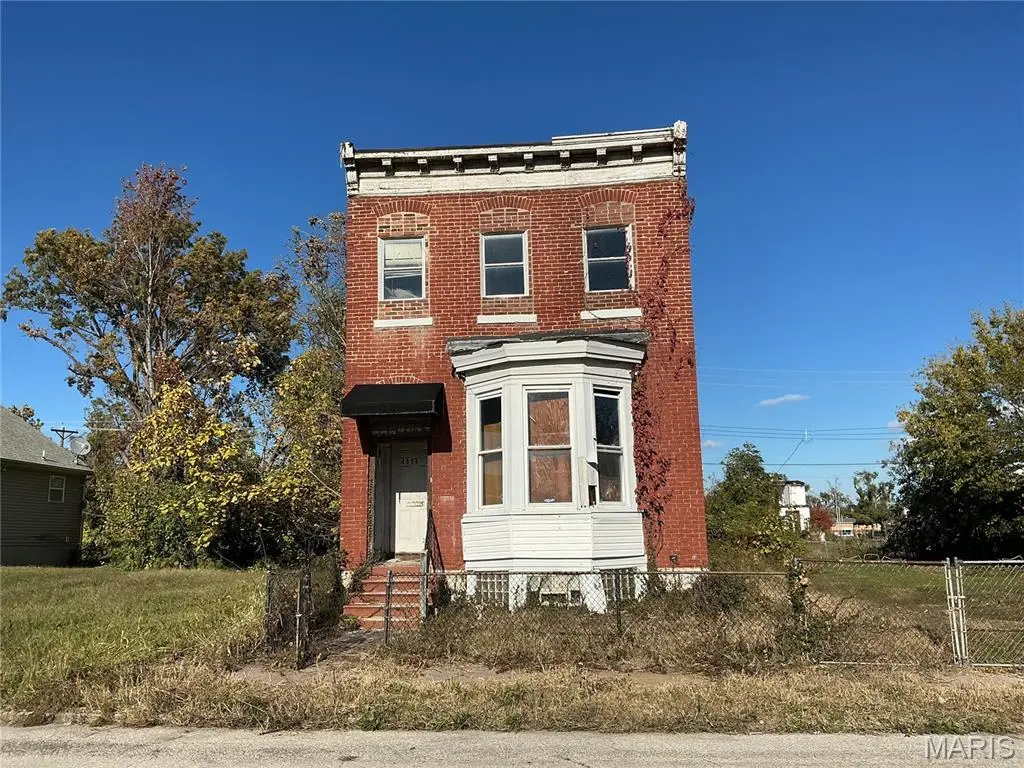
4411 Saint Ferdinand Ave · St. Louis, MO
Flood risk 1/10 · Minimal
- FEMA flood zone
- X (unshaded)
- Chance of flooding over 30 yrs
- 0.0%
- Est. flood insurance / yr
- $473 – $860
Fire risk 1/10 · Minimal
- Est. fire insurance / yr
- $1,054 – $1,958
Heat risk 5/10 · Moderate
- Hot days now (above 107°F)
- 7 days/yr
- Hot days in 30 yrs
- 21 days/yr
Wind risk 2/10 · Minimal
- Chance of severe wind over 30 yrs
- 1.0%
Air-quality risk 4/10 · Minor
- Unhealthy air days now
- 5 days/yr
- Unhealthy air days in 30 yrs
- 6 days/yr
Risk factors via First Street. Map © Google.
Why this score? — see what drove the D+ grade
The composite is a weighted blend of 9 inputs, each scored 0–100. Each bar is that input's sub-score; the figure is the points it added to the 100-point composite (weight × sub-score).
- Cash flow +15.0/30.0
- ARV discount +7.5/15.0
- 1% rule +5.0/10.0
- DSCR +5.0/10.0
- Appreciation +3.9/10.0
- Rent growth +2.5/5.0
- Livability +2.5/5.0
- Condition / age +2.5/5.0
- Schools +1.2/10.0
$19,900
🖨 Deal sheet (PDF) 📄 Offer letter ✓ Due diligence
Listing remarks MLS
INVESTOR OR REHABBER SPECIAL!!!!! Located at 4411 Saint Ferdinand AVE, ST LOUIS MO 63113, this single-family residence in THE Ville AREA of St. Louis presents a unique opportunity to own a piece of history. This is a Full Rehab Project. Built in 1893, featuring a Huge Lot... This residence, situated in the vibrant heart of the Ville offers a chance to craft an ideal living space to occupy or re-sell. Let your imagination run wild as you consider the possibilities this property holds. This residence is a canvas awaiting your vision. Agent is related to the seller.
Key facts
- Huge lot
- Ville area
- 4,020 sq ft lot
Tags
Neighborhood map
What this means for you Summary
Snapshot
- This is a 3-bed/1.0-bath single-family listed at $20k.
Deal economics
- At list price, monthly cash flow is $1k ($15k/yr) — positive.
- The deal already cash-flows at list — no discount required.
- Meets the 1% rule at list price ($2k rent vs $20k).
- Recommended offer: $18k (9.0% below list) — sets the bar for market timing.
- Cap rate 80.2% vs local median 5.0% in St. Louis — top-decile yield for the area; either an underpriced asset or a hidden risk that comps aren't pricing in. Stress-test before assuming the spread holds.
Location & tenants
- Location reads: area grade D — affects rentability + tenant quality, not the cash-flow math above.
- St. Louis City (urban): math 10% / reading 18% proficiency, ranked #312 of 324 in MO (top 96%) — low school quality limits family demand, transient renter base, plan for 1-2y turnover; 80% free/reduced lunch — lower-income household profile, screen leases tightly.
- Zoned schools: Nahed Chapman New American Aca (math 2% / reading 2%, grade F, #1,099 of 1,115 statewide, top 100%, 335 students, 99% FRL); Gateway Middle (math 0% / reading 8%, grade F, #389 of 391 statewide, top 100%, 506 students, 99% FRL); Sumner High (math 2% / reading 2%, grade F, #520 of 521 statewide, top 100%, 264 students, 99% FRL) — zoned schools average 99% FRL vs 80% district-wide (19 pts higher); higher-poverty schools than district average — tighter screening recommended.
- Market conditions: 58 active listings in the ZIP; 32 comparable units currently listed for rent nearby; rentals at typical pace (median 25d on market — plan ~3-4 weeks tenant-placement turnaround); 47% of comp listings sitting > 30 days — soft ceiling on asking rent; 294 units permitted in St. Louis city in 2024 (227 in 5+ unit buildings).
Forward outlook
- Local home prices are declining (-2.1%/yr); year-one equity from $138 of loan paydown is wiped out by about $427 of value loss. Plan a longer hold.
- St. Louis County population projected to shrink 6% by 2050 — rents likely to lag national; underwrite the cash flow, not the appreciation.
- At projected returns (-2.1% appreciation + 3.0% rent growth), your $6k cash investment doubles in ~1 year — after that, you're playing with house money.
Negotiation context
- It's been on market 116 days — a 9% lower offer ($18k) is reasonable based on typical stale-listing flexibility.
- 2 sale attempts with the ask held roughly flat each time — persistent listings suggest the price (not the market) is what's stuck; bring a comps-based counter.
Risks & watch-outs
- Watch-outs: built in 1893 — expect roof / HVAC / electrical / plumbing capex.
- Climate carrying-cost: extreme-heat days projected 7→21/yr by 2055 (HVAC capex compounding) — expect insurance premiums to compound above CPI over the hold.
Questions for the listing agent
- It's been on market 116 days. Have you received any prior offers? Is the seller open to a 9% concession, seller financing, or rate buy-down credit?
- Built in 1893 — when were the roof, HVAC, electrical panel, plumbing, and water heater last replaced?
- Why hasn't it sold? Are there any deal-killer items the seller is aware of (foundation, flood, title, zoning, code violations)?
- Is there a deadline driving the sale (1031 exchange, divorce, estate, relocation)? That informs how much negotiation room exists.
- The area grade is low — what's the realistic commute time and amenity access for the typical tenant pool here? Any planned neighborhood developments (good or bad) we should know about?
- What's the average days-on-market for RENTAL listings here right now (not sales)? A rising rental-DOM trend means longer vacancies and softer asking-rent achievability than the comps imply.
- What's the recent tenant-quality profile in this submarket — average credit score on applications, eviction rate, late-payment / NSF rate, and stable-employment percentage? A property-management company in the area should have these aggregated.
- How much new for-sale + rental construction is in the pipeline within 1–3 miles? Heavy new supply typically softens prices + rents 12–24 months out; constrained supply supports both.
Investment metrics
- 1% rule
- 8.60% ✓
- Cap rate
- 80.18%
- Cash-on-cash
- 263.88%
- DSCR
- 12.74
- GRM
- 1.0
CMA / ARV
- ARV (median comp)
- $45,103
- List price
- $19,900
- Delta
- -55.88%
- Verdict
- UNDERPRICED
- Comps
- 20 within 1.0 mi
Show comp detail 12 sales within ~0.75 mi
| Address | Dist | Beds/Ba | Sqft | Sold | Price | $/sf | Match |
|---|---|---|---|---|---|---|---|
| 1524 Deer St | 0.33mi | 3/2.0 | 1,646 (+2%) | 14mo | $105,900 | $64 | 65 |
| 4319 Aldine Ave | 0.28mi | 3/1.0 | 1,496 (-7%) | 16mo | $15,000 | $10 | 62 |
| 3526 Paris Ave | 0.59mi | 3/2.0 | 1,624 (+1%) | 6mo | $25,000 | $15 | 61 |
| 1723 Marcus Ave | 0.50mi | 3/1.5 | 1,564 (-3%) | 15mo | $25,000 | $16 | 58 |
| 4051 Maffitt Ave | 0.67mi | 3/1.0 | 1,584 (-1%) | 10mo | $23,000 | $15 | 58 |
| 4743 Maffitt Ave | 0.58mi | 4/1.5 (+1) | 1,550 (-4%) | 5mo | $154,900 | $100 | 56 |
| 3208 N Taylor Ave | 0.51mi | 3/1.5 | 1,500 (-7%) | 10mo | $24,900 | $17 | 55 |
| 4725 Maffitt Ave | 0.55mi | 3/1.5 | 1,508 (-6%) | 9mo | $45,000 | $30 | 55 |
| 4369 Evans Ave | 0.41mi | 3/2.0 | 1,788 (+11%) | 4mo | $54,900 | $31 | 54 |
| 4227 W Labadie Ave | 0.42mi | 3/1.5 | 1,505 (-6%) | 17mo | $55,000 | $37 | 54 |
| 4741 Greer Ave | 0.68mi | 3/2.0 | 1,766 (+10%) | 0mo | $10,000 | $6 | 47 |
| 2504 N Euclid Ave N | 0.74mi | 3/1.0 | 1,728 (+8%) | 8mo | $19,900 | $12 | 46 |
Match score weights: distance 35% · size 25% · config 20% · recency 20%. Top-matched comps best support the ARV.
Projected returns pro-forma
-2.14% appreciation · 3.0% rent growth · sell at horizon
- IRR
- —
- Equity multiple
- 14.56×
- Total profit
- $75,554
- Equity at exit
- $3,734
- IRR
- —
- Equity multiple
- 30.97×
- Total profit
- $166,993
- Equity at exit
- $3,067
Cash invested: $5,572 (down + closing). Projections, not guarantees.
Landlord ↔ Tenant lean methodology
- Overall (STATE)
- 81 Strongly Landlord-Friendly
- State Missouri
- 81 Strongly Landlord-Friendly · R+10
- County
- — inherits STATE
- City
- — inherits STATE
ZIP-level market 63113
- Home prices YoY
- -2.0%
- Active inventory
- 58
- Price-to-rent
- 1.0×
Monthly cashflow live
- Estimated rent
- $1,711 high interval (Pro) →
- Mortgage (P&I)
- −$104
- Tax from tax record
- −$14 /mo · $163/yr
- Insurance
- −$8
- HOA
- −$0
- Vacancy / Maint / Mgmt
- −$359
- Net cashflow
- $1,225
Break-even live
Sensitivity live
| Price | -10% $1,237 | -5% $1,231 | +0% $1,225 | +5% $1,220 | +10% $1,214 |
|---|---|---|---|---|---|
| Rent | -10% $1,090 | -5% $1,158 | +0% $1,225 | +5% $1,293 | +10% $1,360 |
| Rate | -1.0pp $1,235 | -0.5pp $1,230 | base $1,225 | +0.5pp $1,220 | +1.0pp $1,215 |
UW: 25.0% down · 7.5% · 30yr · 1.5% tax · 5.0% vac · 8.0% maint · 8.0% mgmt
Financing live
Cash to close
- Down payment
- $4,975
- Closing costs
- $597
- Reserves months
- —
- Total cash needed
- —
Loan-product check · same deal, 3 products live
Conventional
25% down · 7.5% · 30yr
- Down + closing
- —
- Monthly P&I
- —
- Monthly cashflow
- —
- DSCR
- —
- Eligible?
- —
Personal DTI + credit; lowest rate.
DSCR
20% down · 8.5% · 30yr
- Down + closing
- —
- Monthly P&I
- —
- Monthly cashflow
- —
- DSCR
- —
- Eligible?
- —
No personal income docs; deal must DSCR.
Hard money
10% down · 12.0% · 12mo
- Down + closing
- —
- Monthly P&I
- —
- Monthly cashflow
- —
- DSCR
- —
- Eligible?
- —
Short-term bridge; refi at stabilization.
Rent comps 32 comps
| Address | Beds | Baths | Sqft | Rent | $/sqft | DOM | Units | Dist |
|---|---|---|---|---|---|---|---|---|
| 4247 Maffitt Ave St. Louis, MO | 3.0 | 1.5 | 1700 | $1,000 | $0.59 | 6d | 1 | 0.41mi |
| 4400 Delmar Blvd St. Louis, MO | 3.0 | 1.0 | 1450 | $1,600 | $1.10 | 45d | 1 | 0.95mi |
| 763 Walton Ave Unit 763 St. Louis, MO | 2.0 | 1.0 | 1100 | $1,100 | $1.00 | 45d | 1 | 0.96mi |
| 4642 Farlin Ave Unit 1F St. Louis, MO | 2.0 | 1.0 | 1056 | $800 | $0.76 | 45d | 1 | 1.00mi |
| 4466 Olive St Saint Louis, MO | 1.0–2.0 | 1.0–2.5 | 1222 | $2,495 | $2.04 | 0d | 7 | 1.11mi |
| 4500 Olive St Unit D St. Louis, MO | 2.0 | 2.0 | 1200 | $1,725 | $1.44 | 45d | 1 | 1.11mi |
| 4040 Shreve Ave Saint Louis, MO | 3.0 | 1.0 | 1201 | $1,250 | $1.04 | 45d | 1 | 1.11mi |
| 4140 Washington Blvd Saint Louis, MO | 1.0–2.0 | 1.0–2.5 | 907 | $2,035 | $2.24 | 0d | 1 | 1.13mi |
| 4738 Olive St Saint Louis, MO | 2.0 | 2.0 | 1413 | $1,925 | $1.36 | 25d | 1 | 1.17mi |
| 625 N Euclid Ave St. Louis, MO | 2.0 | 1.0–2.0 | 984 | $3,120 | $3.17 | 0d | 16 | 1.19mi |
| 4901 Washington Blvd Saint Louis, MO | 2.0 | 2.0 | 1620 | $2,500 | $1.54 | 13d | 1 | 1.20mi |
| 4223 Red Bud Ave Unit 1F St. Louis, MO | 2.0 | 1.0 | 1167 | $895 | $0.77 | 45d | 1 | 1.22mi |
| 5096 Minerva Ave Unit C St. Louis, MO | 3.0 | 1.0 | 1800 | $1,395 | $0.78 | 45d | 1 | 1.24mi |
| 1320 Academy Ave Unit A St. Louis, MO | 2.0 | 1.0 | 1600 | $1,090 | $0.68 | 45d | 1 | 1.24mi |
| 4127 Westminster Pl St. Louis, MO | 2.0 | 2.5 | 1216 | $2,095 | $1.72 | 9d | 1 | 1.25mi |
| 4127 Westminster Pl St. Louis, MO | 2.0 | 2.5 | 1216 | $2,095 | $1.72 | 0d | 1 | 1.25mi |
| 4446 McPherson Ave Saint Louis, MO | 2.0 | 1.5 | 1440 | $2,100 | $1.46 | 25d | 1 | 1.25mi |
| 4390 McPherson Ave Saint Louis, MO | 3.0 | 2.5 | 1500 | $1,800 | $1.20 | 0d | 1 | 1.25mi |
| 4362 McPherson Ave Saint Louis, MO | 2.0 | 1.5 | 1200 | $1,500 | $1.25 | 0d | 1 | 1.26mi |
| 377 N Taylor Ave St. Louis, MO | 2.0 | 2.0 | 1209 | $1,595 | $1.32 | 16d | 1 | 1.27mi |
| 401 N Euclid Ave St. Louis, MO | 3.0 | 1.0 | 1025 | $1,875 | $1.83 | 0d | 4 | 1.30mi |
| 404 N Sarah St Saint Louis, MO | 3.0 | 2.5 | 1772 | $2,600 | $1.47 | 45d | 1 | 1.34mi |
| 5223 Ashland Ave Unit 2 St. Louis, MO | 3.0 | 1.0 | 2200 | $1,450 | $0.66 | 45d | 1 | 1.35mi |
| 5223 Ashland Ave Saint Louis, MO | 2.0 | 1.0 | 2200 | $1,250 | $0.57 | 45d | 1 | 1.35mi |
| 4322 Maryland Ave St. Louis, MO | 2.0 | 1.5 | 1200 | $1,799 | $1.50 | 25d | 1 | 1.37mi |
| 4256 Maryland Ave Saint Louis, MO | 3.0 | 2.0 | 1400 | $1,900 | $1.36 | 45d | 1 | 1.38mi |
| 4256 Maryland Ave Saint Louis, MO | 3.0 | 2.0 | 1400 | $1,800 | $1.29 | 12d | 1 | 1.38mi |
| 322 N Boyle Ave Unit 3N St. Louis, MO | 2.0 | 2.0 | 1115 | $1,550 | $1.39 | 45d | 1 | 1.39mi |
| 5333 Patton Ave St. Louis, MO | 3.0 | 1.5 | 1262 | $1,250 | $0.99 | 45d | 1 | 1.41mi |
| 1420 Union Blvd Unit 2F St. Louis, MO | 2.0 | 1.0 | 1096 | $995 | $0.91 | 45d | 1 | 1.42mi |
| 5130 Kensington Ave Unit 1 St. Louis, MO | 3.0 | 2.0 | 1200 | $1,245 | $1.04 | 25d | 1 | 1.44mi |
| 4400 Lindell Blvd Saint Louis, MO | 3.0 | 1.0–3.0 | 1100 | $2,879 | $2.62 | 0d | 16 | 1.49mi |
Listing history 18 events
-
2026-06-21days on market $19,900 Active 116 DOM
-
2026-06-18days on market $19,900 Active 113 DOM
-
2026-06-17days on market $19,900 Active 112 DOM
-
2026-06-16days on market $19,900 Active 111 DOM
-
2026-06-15days on market $19,900 Active 110 DOM
-
2026-06-13days on market $19,900 Active 108 DOM
-
2026-06-09days on market $19,900 Active 104 DOM
-
2026-06-08days on market $19,900 Active 103 DOM
-
2026-06-08days on market $19,900 Active 102 DOM
-
2026-06-05days on market $19,900 Active 99 DOM
-
2026-06-03days on market $19,900 Active 98 DOM
-
2026-06-02days on market $19,900 Active 97 DOM
-
2026-06-01days on market $19,900 Active 96 DOM
-
2026-05-31days on market $19,900 Active 95 DOM
-
2026-05-06status Active 572-char remark
Show marketing remark (572 chars)
INVESTOR OR REHABBER SPECIAL!!!!! Located at 4411 Saint Ferdinand AVE, ST LOUIS MO 63113, this single-family residence in THE Ville AREA of St. Louis presents a unique opportunity to own a piece of history. This is a Full Rehab Project. Built in 1893, featuring a Huge Lot... This residence, situated in the vibrant heart of the Ville offers a chance to craft an ideal living space to occupy or re-sell. Let your imagination run wild as you consider the possibilities this property holds. This residence is a canvas awaiting your vision. Agent is related to the seller.
-
2026-04-08status Pending 572-char remark
Show marketing remark (572 chars)
INVESTOR OR REHABBER SPECIAL!!!!! Located at 4411 Saint Ferdinand AVE, ST LOUIS MO 63113, this single-family residence in THE Ville AREA of St. Louis presents a unique opportunity to own a piece of history. This is a Full Rehab Project. Built in 1893, featuring a Huge Lot... This residence, situated in the vibrant heart of the Ville offers a chance to craft an ideal living space to occupy or re-sell. Let your imagination run wild as you consider the possibilities this property holds. This residence is a canvas awaiting your vision. Agent is related to the seller.
-
2026-01-29$19,900 Active 572-char remark
Show marketing remark (572 chars)
INVESTOR OR REHABBER SPECIAL!!!!! Located at 4411 Saint Ferdinand AVE, ST LOUIS MO 63113, this single-family residence in THE Ville AREA of St. Louis presents a unique opportunity to own a piece of history. This is a Full Rehab Project. Built in 1893, featuring a Huge Lot... This residence, situated in the vibrant heart of the Ville offers a chance to craft an ideal living space to occupy or re-sell. Let your imagination run wild as you consider the possibilities this property holds. This residence is a canvas awaiting your vision. Agent is related to the seller.
-
2005-11-18soldstatus $70,000
ⓘ Source: listings_history table (triggers on properties + properties_extension) + one-shot
backfill from property_details.listing_events for pre-trigger history.
Tax reassessment forecast MO · Resets to sale price
- Current annual tax
- $163 · $14/mo
- Projected year-2 tax
- $193 · $16/mo
- Expected delta
- +$30/yr (+$3/mo · 18.6%)
ⓘ Screening estimate from a state-policy table — verify with the county assessor before closing.
Climate risk First Street
- Flood 1/10 Low FEMA zone X (unshaded) · 0% chance over 30 yrs
- Wildfire 1/10 Low
- Heat 5/10 Major 7 d/yr ≥107°F today · 21 d/yr by 30 yrs out
- Wind 2/10 Low 100% chance of damaging wind over 30 yrs
- Air quality 4/10 Moderate 5 unhealthy d/yr today · 6 by 30 yrs out
Nearby sold comps map
Loading sold comps map…
Walkable amenities ~0.75 mi
Loading nearby amenities…
Taxation est. · year 1
- Rental income
- $20,529
- − Mortgage interest
- −$1,115
- − Property taxes
- −$163
- − Insurance
- −$100
- − Repairs & maintenance
- −$1,642
- − Management
- −$1,642
- − Depreciation
- −$579
- Taxable income
- $15,288
- Est. tax owed @ 24.0%
- −$3,669
- After-tax cash flow
- $11,034/yr
For passive investors: Depreciation is non-cash, so a rental often shows a tax loss while cash-flowing — sheltering income. Rental losses are passive: they offset passive income freely, and up to $25,000/yr can offset ordinary (W-2) income if you actively participate and your MAGI is under $100k (phasing out to $0 by $150k); unused losses carry forward. On sale, claimed depreciation is recaptured at up to 25%, and gains may owe capital-gains tax (a 1031 exchange can defer both). Figures are a year-1 estimate at your 24.0% rate — not tax advice; consult a CPA.
Schools (NCES district)
- District
- St. Louis City
- NCES district ID
- 2929280
- Math proficiency
- 10% ▼ -6.00%
- Reading proficiency
- 18% ▼ -3.00%
- Median HH income
- $35,685
- Composite
- 11.54/100
- National rank
- #9699
- State rank
- #312 of 324 in MO
Livability — St. Louis
No livability data for this city. (Only ~50 U.S. cities are tracked.)
Census & demographics
- Census place
- St. Louis, MO
- City population
- 283,259
- Population (ZIP)
- 11,610
Population outlook (St. Louis County) Hauer SSP2
- Today (2025)
- 315,737 people
- By 2030
- 313,865 · -0.6%
- By 2040
- 305,439 · -3.3%
- By 2050
- 296,529 · -6.1%
- By 2075
- 271,028 · -14.2%
- By 2100
- 255,359 · -19.1%
Race, ethnicity, and origin ACS 2023
- Neighborhood character
- Predominantly Black (91%)
- Race & ethnicity
- Black 91% White 6% Two or more races 2% Hispanic / Latino 1%
- Foreign-born
- 2% · Canada
Political lean MEDSL · St. Louis
- 2024 margin
- Solid D (+64.7) · D 81.4% · R 16.7% · Other 2.0%
- 2008→2024 swing
- -3.5pp toward R · 2008: 68.2pp · 2024: 64.7pp
- All cycles
- 2024: D+64.7 2020: D+66.2 2016: D+63.7 2012: D+66.6 2008: D+68.2
Not yet ingested
- Civics
- —
Market trends
- HPI YoY
- ▼ -2.14%
- Current HPI
- 107.1335
- Rent YoY
- —
- Metro
- —
- State GDP YoY
- ▲ 1.84%
- F500 in state
- 20
Industry mix (Fortune 500 HQ in MO)
| Industry | F500 HQs | Revenue |
|---|---|---|
| Healthcare | 1 | $163B |
|
||
| Insurance | 1 | $21B |
|
||
| Industrial Technology | 1 | $17B |
|
||
| Retail | 1 | $16B |
|
||
| Industrial Distribution | 1 | $10B |
|
||
| Utilities | 1 | $9B |
|
||
Price history
-71.6% since first listed4 events — show timeline
- 2026-05-06 Relisted — MARIS as Distributed by MLS Grid
- 2026-04-08 Pending — MARIS as Distributed by MLS Grid
- 2026-01-29 Listed $19,900 MARIS as Distributed by MLS Grid
- 2005-11-18 Sold (Public Records) $70,000 Public Records
Property tax history
-6.7%/yrLatest (2024): $163 · +4.2% YoY. Source: county tax records.
Cash-flow waterfall
monthlySold comps — $/sqft
last 12 mo · ≤1 miLoading sold comps…