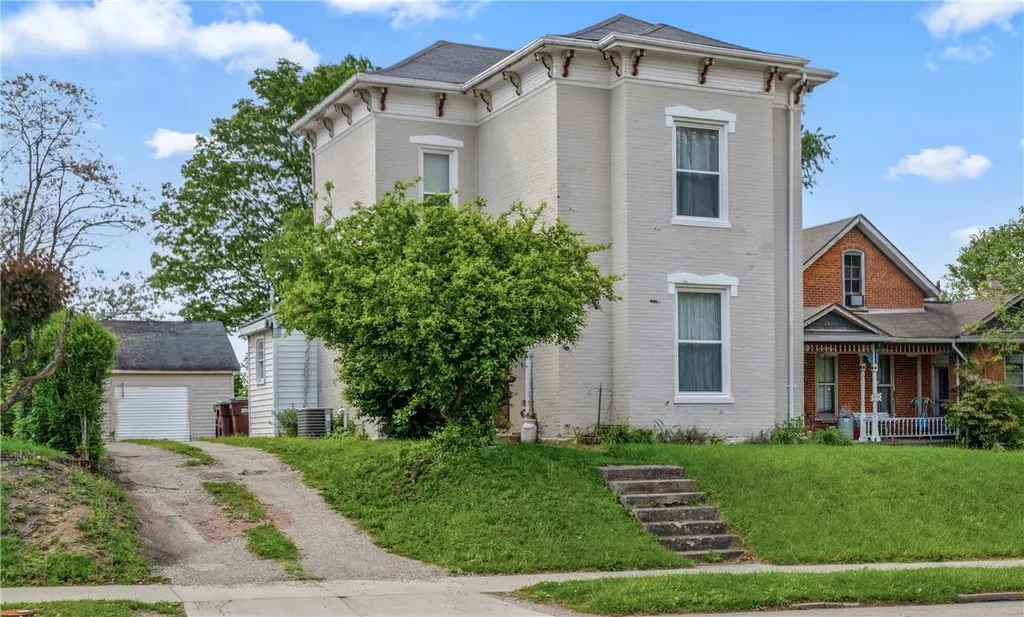
680 S Detroit St · Xenia, OH
Flood risk 1/10 · Minimal
- FEMA flood zone
- X (unshaded)
- Chance of flooding over 30 yrs
- 0.0%
- Est. flood insurance / yr
- $473 – $860
Fire risk 1/10 · Minimal
- Est. fire insurance / yr
- $713 – $1,323
Heat risk 3/10 · Minor
- Hot days now (above 99°F)
- 7 days/yr
- Hot days in 30 yrs
- 18 days/yr
Wind risk 2/10 · Minimal
- Chance of severe wind over 30 yrs
- 1.0%
Air-quality risk 3/10 · Minor
- Unhealthy air days now
- 3 days/yr
- Unhealthy air days in 30 yrs
- 3 days/yr
Risk factors via First Street. Map © Google.
Why this score? — see what drove the B- grade
The composite is a weighted blend of 9 inputs, each scored 0–100. Each bar is that input's sub-score; the figure is the points it added to the 100-point composite (weight × sub-score).
- Cash flow +25.4/30.0
- ARV discount +11.8/15.0
- DSCR +8.4/10.0
- 1% rule +6.3/10.0
- Schools +4.0/10.0
- Rent growth +3.9/5.0
- Livability +3.8/5.0
- Condition / age +2.5/5.0
- Appreciation +0.0/10.0
$159,900
🖨 Deal sheet 📄 Offer letter ✓ Due diligence
Listing remarks
Imagine living just a short walk away from the upcoming Xenia Market District. If you have been searching for a move-in ready home that keeps its historic charm but already has the modern updates you need, 680 S Detroit Street is exactly what you are looking for. With nearly 1,700 square feet of space, the layout gives you plenty of room to relax and entertain without feeling cramped. The main floor has a great, natural flow, and the home features three dedicated bedrooms along with a very convenient one-and-a-half-bath setup. You get the character of an older home without having to take on a massive fixer-upper project. The best part of this home is the location. Buyers are constantly look
Key facts
- Modern updates
- Historic charm
- 9,583 sq ft lot
Tags
Property features AI
Finance
- Financial info: Offered for sale
Exterior
- Parking: Detached two-car garage
- Utilities: Central air; Forced air heating
- Home design: Two stories; Brick construction
- Construction: Brick exterior; Cellar foundation
- Exterior features: Residential zoning
Interior
- Kitchen: Eat-in kitchen (approx. 20 x 13)
- Bedrooms: Second-floor bedrooms (three): approx. 15 x 14, 13 x 13, 10 x 15; Main-level bedroom: approx. 14 x 15
- Bathrooms: One full bathroom; One half bathroom; One main-level bathroom
- Heating & cooling: Central air conditioning; Forced air heating
- Interior features: Eat-in kitchen
Neighborhood map
What this means for you Summary
Snapshot
- This is a 3-bed/2.0-bath single-family listed at $160k.
Deal economics
- At list price, monthly cash flow is $368 ($4k/yr) — positive.
- The deal already cash-flows at list — no discount required.
- Meets the 1% rule at list price ($2k rent vs $160k).
- Cap rate 9.1% vs local median 3.6% in Xenia — top-decile yield for the area; either an underpriced asset or a hidden risk that comps aren't pricing in. Stress-test before assuming the spread holds.
Location & tenants
- Location reads 75/100 on livability (#244 in OH, #3,892 nationally) — a middle-class / working-renter tenant base. Strengths: cost of living A+, housing A+, health & safety B+; Watch: amenities D+, commute F, employment F.
- Xenia Community City (suburban): math 42% / reading 53% proficiency, ranked #478 of 656 in OH (top 73%) — families likely to look elsewhere, expect single-tenant / working-renter base with shorter leases.
- Market conditions: Rents rising fast (+5.5%/yr); 234 active listings in the ZIP; 4 comparable units currently listed for rent nearby; rentals at typical pace (median 24d on market — plan ~3-4 weeks tenant-placement turnaround); solid renter incomes; 797 units permitted in Greene County in 2024 (148 in 5+ unit buildings).
Forward outlook
- Local home prices are declining (-3.0%/yr); year-one equity from $1k of loan paydown is wiped out by about $5k of value loss. Plan a longer hold.
- At projected returns (-3.0% appreciation + 5.5% rent growth), your $45k cash investment doubles in ~9 years — after that, you're playing with house money.
Negotiation context
- Only 3 days on market — expect competitive offers; lowballing is unlikely to land.
- 5 sale attempts since 17y ago with the ask held roughly flat each time — persistent listings suggest the price (not the market) is what's stuck; bring a comps-based counter.
- Current owner paid $18k; list at $160k implies a 764% gain — meaningful room to come down on a strong offer.
Risks & watch-outs
- Watch-outs: built in 1892 — expect roof / HVAC / electrical / plumbing capex.
Questions for the listing agent
- Built in 1892 — when were the roof, HVAC, electrical panel, plumbing, and water heater last replaced?
- Is there a deadline driving the sale (1031 exchange, divorce, estate, relocation)? That informs how much negotiation room exists.
- What's the average days-on-market for RENTAL listings here right now (not sales)? A rising rental-DOM trend means longer vacancies and softer asking-rent achievability than the comps imply.
- What's the recent tenant-quality profile in this submarket — average credit score on applications, eviction rate, late-payment / NSF rate, and stable-employment percentage? A property-management company in the area should have these aggregated.
- How much new for-sale + rental construction is in the pipeline within 1–3 miles? Heavy new supply typically softens prices + rents 12–24 months out; constrained supply supports both.
Investment metrics
- 1% rule
- 1.13% ✓
- Cap rate
- 9.06%
- Cash-on-cash
- 9.87%
- DSCR
- 1.44
- GRM
- 7.4
CMA / ARV
- ARV (on-the-fly)
- $176,592
- Comps found
- 12
Show comp detail 12 sales within ~0.75 mi
| Address | Dist | Beds/Ba | Sqft | Sold | Price | $/sf | Match |
|---|---|---|---|---|---|---|---|
| 680 S Detroit St | 0.00mi | 4/1.5 (+1) | 1,698 (0%) | 0mo | $165,000 | $97 | 93 |
| 901 S Detroit St | 0.21mi | 3/2.0 | 1,778 (+5%) | 0mo | $175,000 | $98 | 82 |
| 400 S Detroit St | 0.26mi | 4/2.0 (+1) | 1,792 (+6%) | 0mo | $120,000 | $67 | 73 |
| 55 Lake St | 0.32mi | 3/1.0 | 1,729 (+2%) | 6mo | $232,000 | $134 | 73 |
| 940 Chestnut St | 0.29mi | 3/2.0 | 1,828 (+8%) | 2mo | $130,000 | $71 | 72 |
| 448 S Detroit St | 0.22mi | 3/2.5 | 1,776 (+5%) | 11mo | $229,900 | $129 | 71 |
| 327 Home Ave | 0.26mi | 3/2.0 | 1,891 (+11%) | 3mo | $198,000 | $105 | 66 |
| 373 Hill St | 0.51mi | 4/1.5 (+1) | 1,729 (+2%) | 7mo | $200,000 | $116 | 60 |
| 148 Home Ave | 0.21mi | 4/2.0 (+1) | 1,922 (+13%) | 6mo | $200,000 | $104 | 58 |
| 530 Cincinnati Ave | 0.43mi | 4/2.0 (+1) | 1,587 (-6%) | 7mo | $160,000 | $101 | 58 |
| 346 Hill St | 0.50mi | 3/1.0 | 1,536 (-10%) | 12mo | $190,000 | $124 | 47 |
| 133 Hivling St | 0.48mi | 4/2.0 (+1) | 1,932 (+14%) | 3mo | $187,000 | $97 | 47 |
Match score weights: distance 35% · size 25% · config 20% · recency 20%. Top-matched comps best support the ARV.
Projected returns pro-forma
-3.0% appreciation · 5.48% rent growth · sell at horizon
- IRR
- 1.2%
- Equity multiple
- 1.05×
- Total profit
- $2,136
- Equity at exit
- $23,842
- IRR
- 13.1%
- Equity multiple
- 2.16×
- Total profit
- $51,918
- Equity at exit
- $13,825
Cash invested: $44,772 (down + closing). Projections, not guarantees.
Landlord ↔ Tenant lean methodology
- Overall (STATE)
- 73 Landlord-Friendly
- State Ohio
- 73 Landlord-Friendly · R+6
- County
- — inherits STATE
- City
- — inherits STATE
ZIP-level market 45385
- Rents YoY
- 5.5%
- Active inventory
- 234
- Price-to-rent
- 7.4×
Monthly cashflow live
- Estimated rent
- $1,801 medium interval (Pro) →
- Mortgage (P&I)
- −$839
- Tax from tax record
- −$150 /mo · $1,796/yr
- Insurance
- −$67
- HOA
- −$0
- Vacancy / Maint / Mgmt
- −$378
- Net cashflow
- $368
Break-even live
UW: 25.0% down · 7.5% · 30yr · 1.5% tax · 5.0% vac · 8.0% maint · 8.0% mgmt
Financing live
Cash to close
- Down payment
- $39,975
- Closing costs
- $4,797
- Reserves months
- —
- Total cash needed
- —
Loan-product check · same deal, 3 products live
Conventional
25% down · 7.5% · 30yr
- Down + closing
- —
- Monthly P&I
- —
- Monthly cashflow
- —
- DSCR
- —
- Eligible?
- —
Personal DTI + credit; lowest rate.
DSCR
20% down · 8.5% · 30yr
- Down + closing
- —
- Monthly P&I
- —
- Monthly cashflow
- —
- DSCR
- —
- Eligible?
- —
No personal income docs; deal must DSCR.
Hard money
10% down · 12.0% · 12mo
- Down + closing
- —
- Monthly P&I
- —
- Monthly cashflow
- —
- DSCR
- —
- Eligible?
- —
Short-term bridge; refi at stabilization.
Rent comps 4 comps
| Address | Beds | Baths | Sqft | Rent | $/sqft | DOM | Units | Dist |
|---|---|---|---|---|---|---|---|---|
| 329 Cincinnati Ave Xenia, OH | 3.0 | 1.5 | 1866 | $2,300 | $1.23 | 23d | 1 | 0.40mi |
| 153 W 3rd St Xenia, OH | 3.0 | 1.5 | 2006 | $1,450 | $0.72 | 3d | 1 | 0.44mi |
| 475 Stelton Rd Unit 479 Xenia, OH | 2.0 | 1.0 | 1984 | $675 | $0.34 | 23d | 1 | 0.47mi |
| 50 N Collier St Xenia, OH | 4.0 | 1.0 | 1100 | $1,350 | $1.23 | 11d | 1 | 0.73mi |
Listing history 11 events
-
2026-05-13status Pending
-
2026-05-08$159,900 Active
-
2013-07-17historical
-
2013-04-17$34,900
-
2013-04-15historical
-
2013-01-15$34,900
-
2010-10-28historical
-
2010-09-30historical
-
2010-07-28$68,900
-
2009-12-13$68,900
-
1978-10-25soldstatus $18,500
ⓘ Source: listings_history table (triggers on properties + properties_extension) + one-shot
backfill from property_details.listing_events for pre-trigger history.
Tax reassessment forecast OH · Partial reset (capped growth)
- Current annual tax
- $1,796 · $150/mo
- Projected year-2 tax
- $2,145 · $179/mo
- Expected delta
- +$349/yr (+$29/mo · 19.5%)
ⓘ Screening estimate from a state-policy table — verify with the county assessor before closing.
Climate risk First Street
- Flood 1/10 Low FEMA zone X (unshaded) · 0% chance over 30 yrs
- Wildfire 1/10 Low
- Heat 3/10 Moderate 7 d/yr ≥99°F today · 18 d/yr by 30 yrs out
- Wind 2/10 Low 100% chance of damaging wind over 30 yrs
- Air quality 3/10 Moderate 3 unhealthy d/yr today · 3 by 30 yrs out
Nearby sold comps map
Loading sold comps map…
Walkable amenities ~0.75 mi
Loading nearby amenities…
Taxation est. · year 1
- Rental income
- $21,614
- − Mortgage interest
- −$8,957
- − Property taxes
- −$1,796
- − Insurance
- −$800
- − Repairs & maintenance
- −$1,729
- − Management
- −$1,729
- − Depreciation
- −$4,652
- Taxable income
- $1,952
- Est. tax owed @ 24.0%
- −$468
- After-tax cash flow
- $3,949/yr
For passive investors: Depreciation is non-cash, so a rental often shows a tax loss while cash-flowing — sheltering income. Rental losses are passive: they offset passive income freely, and up to $25,000/yr can offset ordinary (W-2) income if you actively participate and your MAGI is under $100k (phasing out to $0 by $150k); unused losses carry forward. On sale, claimed depreciation is recaptured at up to 25%, and gains may owe capital-gains tax (a 1031 exchange can defer both). Figures are a year-1 estimate at your 24.0% rate — not tax advice; consult a CPA.
Schools (NCES district)
- District
- Xenia Community City
- NCES district ID
- 3904515
- Math proficiency
- 42% ▼ -16.00%
- Reading proficiency
- 53% ▼ -5.00%
- Median HH income
- $46,206
- Composite
- 40.31/100
- National rank
- #3752
- State rank
- #478 of 656 in OH
Livability — Xenia
- Score
- 75/100
- State rank
- #244
- US rank
- #3892
Category grades
Schools grade is shown separately in the Schools card above.
Census & demographics
- Census place
- Xenia, OH
- County
- Greene County · 132,120 people
- City population
- 40,617
- Metro
- Dayton-Kettering, OH
- Population (ZIP)
- 40,617
- Household income
- $76,564
- Rent vs Own
- Severe rent burden
- 906.0
Population outlook (Greene County) Hauer SSP2
- Today (2025)
- 170,301 people
- By 2030
- 171,840 · +0.9%
- By 2040
- 171,408 · +0.7%
- By 2050
- 167,806 · -1.5%
- By 2075
- 154,430 · -9.3%
- By 2100
- 138,669 · -18.6%
Race, ethnicity, and origin ACS 2023
- Neighborhood character
- Predominantly White (83%)
- Race & ethnicity
- White 83% Two or more races 6% Black 6% Hispanic / Latino 2% Asian 2%
- Common ancestry
- Slovak 3% Italian 2% Serbian 1%
- Foreign-born
- 3% · Canada
- Languages at home
- 96% English-only · Other Indo-European 1% Spanish 1%
Political lean MEDSL · Greene
- 2024 margin
- R (+19.8) · D 39.5% · R 59.3% · Other 1.2%
- 2008→2024 swing
- -1.4pp toward R · 2008: -18.4pp · 2024: -19.8pp
- All cycles
- 2024: R+19.8 2020: R+19.5 2016: R+24.5 2012: R+21.8 2008: R+18.4
Not yet ingested
- Civics
- —
Market trends
- HPI YoY
- ▼ -158.15%
- Current HPI
- 239.0473
- Rent YoY
- ▲ 5.48%
- Metro
- Dayton-Kettering, OH
- State GDP YoY
- ▲ 1.98%
- F500 in state
- 48
Industry mix (Fortune 500 HQ in OH)
| Industry | F500 HQs | Revenue |
|---|---|---|
| Insurance | 3 | $145B |
|
||
| Industrial Machinery | 3 | $49B |
|
||
| Financial Services | 3 | $24B |
|
||
| Consumer Goods | 2 | $93B |
|
||
| Aerospace / Defense | 2 | $47B |
|
||
| Utilities | 2 | $33B |
|
||
Price history
+764.3% since first listed11 events — show timeline
- 2026-05-13 Pending — Dayton MLS
- 2026-05-08 Listed $159,900 Dayton MLS
- 2013-07-17 Listing Removed — Dayton MLS
- 2013-04-17 Listed $34,900 Dayton MLS
- 2013-04-15 Listing Removed — Dayton MLS
- 2013-01-15 Listed $34,900 Dayton MLS
- 2010-10-28 Listing Removed — Dayton MLS
- 2010-09-30 Listing Removed — Dayton MLS
- 2010-07-28 Listed $68,900 Dayton MLS
- 2009-12-13 Listed $68,900 Dayton MLS
- 1978-10-25 Sold (Public Records) $18,500 Public Records
Property tax history
+2.8%/yrLatest (2025): $1,796 · +1.8% YoY. Source: county tax records.
Cash-flow waterfall
monthlySold comps — $/sqft
last 12 mo · ≤1 miLoading sold comps…