 Duplex
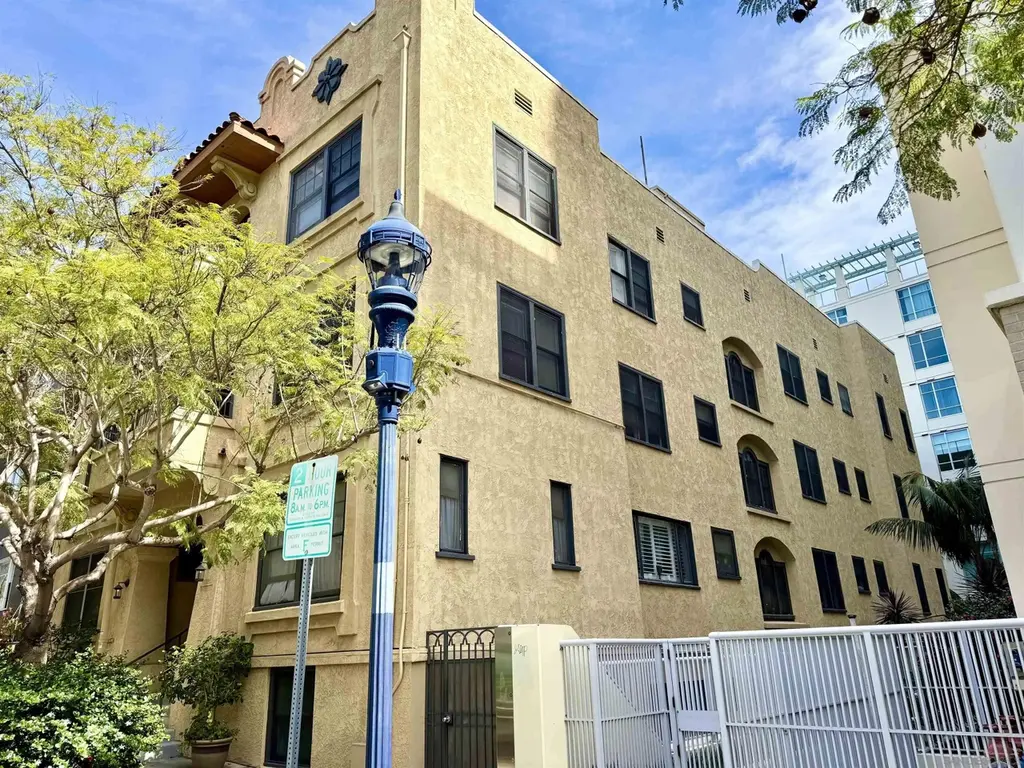
1541 8th Ave · San Diego, CA
Flood risk 1/10 · Minimal
- FEMA flood zone
- X (unshaded)
- Chance of flooding over 30 yrs
- 0.0%
- Est. flood insurance / yr
- $507 – $1,088
Fire risk 1/10 · Minimal
- Est. fire insurance / yr
- $659 – $1,223
Heat risk 4/10 · Minor
- Hot days now (above 84°F)
- 7 days/yr
- Hot days in 30 yrs
- 20 days/yr
Wind risk 1/10 · Minimal
- Chance of severe wind over 30 yrs
- —
Air-quality risk 4/10 · Minor
- Unhealthy air days now
- 4 days/yr
- Unhealthy air days in 30 yrs
- 4 days/yr
Risk factors via First Street. Map © Google.
Why this score? — see what drove the F grade
The composite is a weighted blend of 9 inputs, each scored 0–100. Each bar is that input's sub-score; the figure is the points it added to the 100-point composite (weight × sub-score).
- ARV discount +7.5/15.0
- Appreciation +4.1/10.0
- Livability +3.8/5.0
- Rent growth +2.6/5.0
- Condition / age +2.5/5.0
- Schools +2.2/10.0
- Cash flow +0.0/30.0
- 1% rule +0.0/10.0
- DSCR +0.0/10.0
$5,550,000
🖨 Deal sheet (PDF) 📄 Offer letter ✓ Due diligence
Multi-family units
County records classify this as Multi-Family (5+ Unit). Listing-text estimate: 2 units. estimate disagrees with records
5+ unit building — per-unit beds/baths from public records are typically unavailable; the breakdown below (if shown) is an estimate from the listing text.
Listing remarks
pleased to present 1451 8th Avenue, a 25-unit apartment community located in the highly desirable Cortez Hill neighborhood of Downtown San Diego. Originally constructed in 1914, the property consists of a unique mix of studio units, one-bedroom apartments, and a penthouse/commercial unit, offering investors a rare opportunity to acquire a character-rich asset in one of Downtown San Diego’s most established residential enclaves. The property also features a shared laundry facility and a substantial basement-level storage area, providing added convenience for tenants and potential operational upside for ownership. Additionally, the offering includes attractive assumable financing, with
Key facts
- Balboa park nearby
- Listed 40 days
Tags
Property features AI
Finance
- Other: Listed by San Diego Association of REALTORS
Exterior
- Utilities: Lot size reported in acres
- Home design: Residential income property (Com-Res Income)
- Construction: 11,400 total building area
Interior
- Bathrooms: 24 full bathrooms
- Interior features: 24 full bathrooms
Neighborhood map
What this means for you Summary
Snapshot
- This is a 2 × 1-bed/1-bath units multifamily listed at $5.55M.
Deal economics
- At list price, monthly cash flow is $-32k ($-389k/yr) — negative. Per door: $-16k/mo.
- To cash-flow at today's rent, offer at most $685k (87.7% below list).
- To meet the 1% rule (rent ≥ 1% of price), the offer needs to be $600k (89.2% below list).
- Recommended offer: $600k (89.2% below list) — sets the bar for 1% rule.
- Cap rate -0.7% vs local median 2.0% in San Diego — below-typical yield; the buyer is paying a premium for something (appreciation thesis, condition, location) that the cap rate doesn't capture.
Location & tenants
- Location reads 75/100 on livability (#123 in CA, #4,206 nationally) — a middle-class / working-renter tenant base. Strengths: amenities A+, commute A+, employment A+; Watch: health & safety C-, crime D+, cost of living F.
- San Diego Unified (urban): math 19% / reading 29% proficiency, ranked #393 of 517 in CA (top 76%) — low school quality limits family demand, transient renter base, plan for 1-2y turnover.
- Zoned schools: Washington Elementary (257 students, 69% FRL); Roosevelt International Middle (math 24% / reading 24%, grade F, #277 of 498 statewide, top 73%, 761 students, 59% FRL); San Diego High (2,105 students, 62% FRL).
- Market conditions: Rents flat; 520 active listings in the ZIP; solid renter incomes; 11,759 units permitted in San Diego County in 2024 (7,244 in 5+ unit buildings).
- At $5,995/mo this rent would consume 79% of the median local household income ($92k/yr) (locally 5603% of renters already pay >50% of income on rent) — very limited rent-growth headroom before tenants either downsize or default.
Forward outlook
- Local home prices are declining (-1.8%/yr); year-one equity from $38k of loan paydown is wiped out by about $101k of value loss. Plan a longer hold.
- San Diego County population projected at +20% by 2050 — long-run rental-demand tailwind backs the buy-and-hold thesis.
Negotiation context
- It's been on market 40 days — a 3% lower offer ($5.38M) is reasonable based on typical stale-listing flexibility.
- Current owner paid $1.75M; list at $5.55M implies a 217% gain — meaningful room to come down on a strong offer.
Questions for the listing agent
- What do current leases actually rent for vs. the listed asking? Can we see a recent rent roll and the last 12 months of T-12 income?
- It's been on market 40 days. Have you received any prior offers? Is the seller open to a 89% concession, seller financing, or rate buy-down credit?
- Can we see the unit-by-unit rent roll, current vacancy, and any below-market leases? What's the average tenancy length?
- What capital expenditures (roof, boiler, parking lot, exteriors) have been made in the last 5 years, and what's planned in the next 2?
- Is there a deadline driving the sale (1031 exchange, divorce, estate, relocation)? That informs how much negotiation room exists.
- Schools are B-rated — typically a magnet for longer-tenancy family renters. What's the average tenant stay here, and is there a school-zone premium baked into asking?
- Crime grade is D in this area — have there been break-ins, vandalism, or insurance claims at this property in the last 3 years? What carrier currently insures it and at what premium?
- The area grade is low — what's the realistic commute time and amenity access for the typical tenant pool here? Any planned neighborhood developments (good or bad) we should know about?
- What's the average days-on-market for RENTAL listings here right now (not sales)? A rising rental-DOM trend means longer vacancies and softer asking-rent achievability than the comps imply.
- What's the recent tenant-quality profile in this submarket — average credit score on applications, eviction rate, late-payment / NSF rate, and stable-employment percentage? A property-management company in the area should have these aggregated.
- How much new apartment / multifamily construction is in the pipeline within 1–3 miles? Heavy new supply (>2% of stock underway) typically softens rents 12–24 months out; light construction supports rent growth.
Investment metrics
- 1% rule
- 0.11% ✗
- Cap rate
- -0.71%
- Cash-on-cash
- -25.01%
- DSCR
- -0.11
- GRM
- 77.1
CMA / ARV
No comps found within radius.
Projected returns pro-forma
-1.82% appreciation · 0.35% rent growth · sell at horizon
- IRR
- -49.6%
- Equity multiple
- -0.74×
- Total profit
- $-2,698,274
- Equity at exit
- $1,125,738
- IRR
- -55.9%
- Equity multiple
- -2.10×
- Total profit
- $-4,816,969
- Equity at exit
- $1,008,060
Cash invested: $1,554,000 (down + closing). Projections, not guarantees.
Landlord ↔ Tenant lean methodology
- Overall (STATE)
- 18 Strongly Tenant-Friendly
- State California
- 18 Strongly Tenant-Friendly · D+13
- County
- — inherits STATE
- City
- — inherits STATE
ZIP-level market 92101
- Home prices YoY
- -0.8%
- Rents YoY
- 0.3%
- Active inventory
- 520
- Price-to-rent
- 154.3×
Monthly cashflow live
- Estimated rent
- $5,995 high interval (Pro) →
- Mortgage (P&I)
- −$29,105
- Tax from tax record
- −$5,710 /mo · $68,521/yr
- Insurance
- −$2,312
- HOA
- −$0
- Vacancy / Maint / Mgmt
- −$1,259
- Net cashflow
- $-32,391
Break-even live
Sensitivity live
| Price | -10% $-29,250 | -5% $-30,820 | +0% $-32,391 | +5% $-33,962 | +10% $-35,533 |
|---|---|---|---|---|---|
| Rent | -10% $-32,865 | -5% $-32,628 | +0% $-32,391 | +5% $-32,155 | +10% $-31,918 |
| Rate | -1.0pp $-29,596 | -0.5pp $-30,980 | base $-32,391 | +0.5pp $-33,829 | +1.0pp $-35,293 |
2-unit breakdown (identical units grouped — click to expand)
| Units | Beds | Baths | Est. rent |
|---|---|---|---|
| 2× units | 1 | 1 | $5,996 |
| #1 | 1 | 1 | $2,998 |
| #2 | 1 | 1 | $2,998 |
| Total (2 units) | $5,995 | ||
UW: 25.0% down · 7.5% · 30yr · 1.5% tax · 5.0% vac · 8.0% maint · 8.0% mgmt
Financing live
Cash to close
- Down payment
- $1,387,500
- Closing costs
- $166,500
- Reserves months
- —
- Total cash needed
- —
Loan-product check · same deal, 3 products live
Conventional
25% down · 7.5% · 30yr
- Down + closing
- —
- Monthly P&I
- —
- Monthly cashflow
- —
- DSCR
- —
- Eligible?
- —
Personal DTI + credit; lowest rate.
DSCR
20% down · 8.5% · 30yr
- Down + closing
- —
- Monthly P&I
- —
- Monthly cashflow
- —
- DSCR
- —
- Eligible?
- —
No personal income docs; deal must DSCR.
Hard money
10% down · 12.0% · 12mo
- Down + closing
- —
- Monthly P&I
- —
- Monthly cashflow
- —
- DSCR
- —
- Eligible?
- —
Short-term bridge; refi at stabilization.
Listing history 17 events
-
2026-06-21days on market $5,550,000 Active 40 DOM
-
2026-06-18days on market $5,550,000 Active 37 DOM
-
2026-06-17days on market $5,550,000 Active 36 DOM
-
2026-06-16days on market $5,550,000 Active 35 DOM
-
2026-06-15days on market $5,550,000 Active 34 DOM
-
2026-06-13days on market $5,550,000 Active 32 DOM
-
2026-06-09days on market $5,550,000 Active 28 DOM
-
2026-06-08days on market $5,550,000 Active 27 DOM
-
2026-06-07days on market $5,550,000 Active 26 DOM
-
2026-06-04pricedays on market $5,550,000 Active 23 DOM
-
2026-06-03days on market $5,600,000 Active 22 DOM
-
2026-06-02days on market $5,600,000 Active 21 DOM
-
2026-06-01days on market $5,600,000 Active 20 DOM
-
2026-05-31days on market $5,600,000 Active 19 DOM
-
2026-05-21price $5,600,000
-
2026-05-12$5,950,000 Active
-
2009-11-19soldstatus $1,750,000
ⓘ Source: listings_history table (triggers on properties + properties_extension) + one-shot
backfill from property_details.listing_events for pre-trigger history.
Tax reassessment forecast CA · Resets to sale price
- Current annual tax
- $68,521 · $5,710/mo
- Projected year-2 tax
- $68,521 · $5,710/mo
- Expected delta
- $0/yr ($0/mo · 0.0%)
ⓘ Screening estimate from a state-policy table — verify with the county assessor before closing.
Climate risk First Street
- Flood 1/10 Low FEMA zone X (unshaded) · 0% chance over 30 yrs
- Wildfire 1/10 Low
- Heat 4/10 Moderate 7 d/yr ≥84°F today · 20 d/yr by 30 yrs out
- Wind 1/10 Low
- Air quality 4/10 Moderate 4 unhealthy d/yr today · 4 by 30 yrs out
Nearby sold comps map
Loading sold comps map…
Walkable amenities ~0.75 mi
Loading nearby amenities…
Taxation est. · year 1
- Rental income
- $71,940
- − Mortgage interest
- −$310,886
- − Property taxes
- −$68,521
- − Insurance
- −$27,750
- − Repairs & maintenance
- −$5,755
- − Management
- −$5,755
- − Depreciation
- −$161,455
- Taxable loss
- −$508,182
- Est. tax savings @ 24.0%
- +$121,964
- After-tax cash flow
- $-266,732/yr
For passive investors: Depreciation is non-cash, so a rental often shows a tax loss while cash-flowing — sheltering income. Rental losses are passive: they offset passive income freely, and up to $25,000/yr can offset ordinary (W-2) income if you actively participate and your MAGI is under $100k (phasing out to $0 by $150k); unused losses carry forward. On sale, claimed depreciation is recaptured at up to 25%, and gains may owe capital-gains tax (a 1031 exchange can defer both). Figures are a year-1 estimate at your 24.0% rate — not tax advice; consult a CPA.
Schools (NCES district)
- District
- San Diego Unified
- NCES district ID
- 0634320
- Math proficiency
- 19% ▼ -29.00%
- Reading proficiency
- 29% ▼ -28.00%
- Median HH income
- $61,673
- Composite
- 22.31/100
- National rank
- #8135
- State rank
- #393 of 517 in CA
Livability — San Diego
- Score
- 75/100
- State rank
- #123
- US rank
- #4206
Category grades
Schools grade is shown separately in the Schools card above.
Census & demographics
- Census place
- San Diego, CA
- County
- San Diego County · 3,178,799 people
- City population
- 1,397,612
- Metro
- San Diego-Chula Vista-Carlsbad, CA
- Population (ZIP)
- 51,805
- Household income
- $91,566
- Rent vs Own
- Severe rent burden
- 5603.0
Population outlook (San Diego County) Hauer SSP2
- Today (2025)
- 3,678,185 people
- By 2030
- 3,856,546 · +4.8%
- By 2040
- 4,171,407 · +13.4%
- By 2050
- 4,421,607 · +20.2%
- By 2075
- 4,831,599 · +31.4%
- By 2100
- 4,832,502 · +31.4%
Race, ethnicity, and origin ACS 2023
- Neighborhood character
- Diverse neighborhood (Simpson 0.64)
- Race & ethnicity
- White 54% Hispanic / Latino 24% Two or more races 12% Asian 10% Black 8%
- Hispanic origin (detail)
- Mexican 16%
- Common ancestry
- Romanian 3% Lithuanian 2% Italian 2%
- Foreign-born
- 19% · Canada, China, Vietnam
- Languages at home
- 74% English-only · Spanish 15% Other Indo-European 3% Other Asian/Pacific 1%
Political lean MEDSL · San Diego
- 2024 margin
- D (+16.8) · D 56.9% · R 40.1% · Other 2.9%
- 2008→2024 swing
- +6.6pp toward D · 2008: 10.2pp · 2024: 16.8pp
- All cycles
- 2024: D+16.8 2020: D+22.8 2016: D+17.8 2012: D+5.1 2008: D+10.2
Not yet ingested
- Civics
- —
Market trends
- HPI YoY
- ▼ -1.82%
- Current HPI
- 224.0762
- Rent YoY
- ▲ 0.35%
- Metro
- San Diego-Chula Vista-Carlsbad, CA
- State GDP YoY
- ▲ 3.21%
- F500 in state
- 116
Industry mix (Fortune 500 HQ in CA)
| Industry | F500 HQs | Revenue |
|---|---|---|
| Technology | 27 | $1,492B |
|
||
| Financial Services | 3 | $174B |
|
||
| Retail | 3 | $44B |
|
||
| Insurance | 3 | $26B |
|
||
| Media / Entertainment | 2 | $115B |
|
||
| Pharmaceuticals / Biotech | 2 | $62B |
|
||
Price history
+220.0% since first listed3 events — show timeline
- 2026-05-21 Price Changed $5,600,000 SDMLS
- 2026-05-12 Listed $5,950,000 SDMLS
- 2009-11-19 Sold (Public Records) $1,750,000 Public Records
Property tax history
+17.4%/yrLatest (2025): $68,521 · +135.5% YoY. Source: county tax records.
Cash-flow waterfall
monthlySold comps — $/sqft
last 12 mo · ≤1 miLoading sold comps…