 Duplex
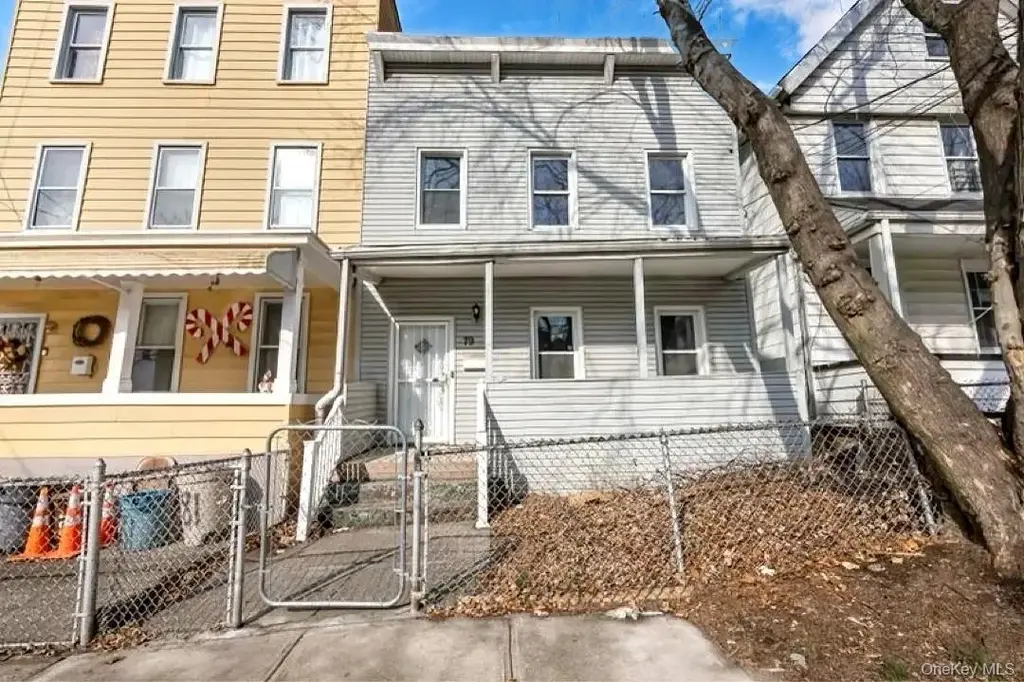
79 Taft Ave · New York, NY
Flood risk 1/10 · Minimal
- FEMA flood zone
- X (unshaded)
- Chance of flooding over 30 yrs
- 0.0%
- Est. flood insurance / yr
- $507 – $1,088
Fire risk 1/10 · Minimal
- Est. fire insurance / yr
- $691 – $1,283
Heat risk 7/10 · Major
- Hot days now (above 98°F)
- 7 days/yr
- Hot days in 30 yrs
- 15 days/yr
Wind risk 6/10 · Moderate
- Chance of severe wind over 30 yrs
- 54.0%
Air-quality risk 4/10 · Minor
- Unhealthy air days now
- 5 days/yr
- Unhealthy air days in 30 yrs
- 7 days/yr
Risk factors via First Street. Map © Google.
Why this score? — see what drove the B- grade
The composite is a weighted blend of 9 inputs, each scored 0–100. Each bar is that input's sub-score; the figure is the points it added to the 100-point composite (weight × sub-score).
- Cash flow +23.2/30.0
- ARV discount +15.0/15.0
- DSCR +7.5/10.0
- 1% rule +5.2/10.0
- Schools +5.0/10.0
- Rent growth +4.0/5.0
- Livability +3.8/5.0
- Condition / age +2.5/5.0
- Appreciation +0.0/10.0
$649,999
🖨 Deal sheet 📄 Offer letter ✓ Due diligence
Multi-family units
County records classify this as Multi-Family (2-4 Unit). Listing-text estimate: 2 units. confirmed
Listing remarks
Coming Soon! Fully renovated semi-detached two-family home offering modern updates and versatile living. This turnkey property features two spacious units, each with 3 bedrooms and 1 renovated bathroom. Open-concept layouts include new flooring, updated kitchens with stainless steel appliances, and quality finishes throughout. Large backyard provides excellent outdoor space for recreation, entertaining, or gardening. Located on a residential street with convenient access to transportation, shopping, dining, and everyday amenities. Ample street parking available. Property has been renovated throughout with no additional work needed. Some photos have been virtually staged to illustrate pote
Key facts
- Built 1905
- Listed 21 days
Property features AI
Finance
- Financial info: Tax year 2025
Exterior
- Parking: On-street parking
- Utilities: Cable available; Electricity available; Sewer: Other
- Home design: Duplex
- Construction: Frame construction
- Exterior features: Frame construction; Not waterfront
Interior
- Kitchen: Eat-in kitchen; Kitchen island; Tile counters
- Bedrooms: Two 3-bedroom units
- Flooring: Hardwood flooring
- Bathrooms: Two full bathrooms
- Heating & cooling: Oil heating; No central cooling
- Interior features: Eat-in kitchen with kitchen island; Open floorplan and open kitchen; Storage; Tile countertops; Walk-through kitchen
Neighborhood map
What this means for you Summary
Snapshot
- This is a 2 × 3-bed/1.0-bath units multifamily listed at $650k.
Deal economics
- At list price, monthly cash flow is $1k ($14k/yr) — positive. Per door: $590/mo.
- The deal already cash-flows at list — no discount required.
- Meets the 1% rule at list price ($7k rent vs $650k).
- Recommended offer: $640k (1.5% below list) — sets the bar for market timing.
- Cap rate 8.5% vs local median 2.6% in New York — top-decile yield for the area; either an underpriced asset or a hidden risk that comps aren't pricing in. Stress-test before assuming the spread holds.
Location & tenants
- Location reads 75/100 on livability (#268 in NY, #4,188 nationally) — a middle-class / working-renter tenant base. Strengths: amenities A+, commute A+, health & safety A; Watch: crime F, cost of living F.
- Market conditions: Rents rising fast (+6.1%/yr); 263 active listings in the ZIP; solid renter incomes; 480 units permitted in Richmond County in 2024 (22 in 5+ unit buildings).
- At $6,616/mo this rent would consume 93% of the median local household income ($86k/yr) (locally 2008% of renters already pay >50% of income on rent) — very limited rent-growth headroom before tenants either downsize or default.
Forward outlook
- Local home prices are declining (-3.0%/yr); year-one equity from $4k of loan paydown is wiped out by about $20k of value loss. Plan a longer hold.
- Richmond County population projected to shrink 5% by 2050 — rents likely to lag national; underwrite the cash flow, not the appreciation.
- At projected returns (-3.0% appreciation + 6.1% rent growth), your $182k cash investment doubles in ~10 years — after that, you're playing with house money.
Negotiation context
- It's been on market 22 days — a 2% lower offer ($640k) is reasonable based on typical stale-listing flexibility.
- 9 sale attempts since 4y ago; this cycle's ask is 9% above the opening price — seller raised mid-cycle; expect resistance to lowballs.
Risks & watch-outs
- Watch-outs: built in 1905 — expect roof / HVAC / electrical / plumbing capex.
- Climate carrying-cost: major wind risk, 54% chance of damaging wind over 30y; extreme-heat days projected 7→15/yr by 2055 (HVAC capex compounding) — expect insurance premiums to compound above CPI over the hold.
Questions for the listing agent
- Can we see the unit-by-unit rent roll, current vacancy, and any below-market leases? What's the average tenancy length?
- What capital expenditures (roof, boiler, parking lot, exteriors) have been made in the last 5 years, and what's planned in the next 2?
- Built in 1905 — when were the roof, HVAC, electrical panel, plumbing, and water heater last replaced?
- Is there a deadline driving the sale (1031 exchange, divorce, estate, relocation)? That informs how much negotiation room exists.
- Schools are B-rated — typically a magnet for longer-tenancy family renters. What's the average tenant stay here, and is there a school-zone premium baked into asking?
- Crime grade is F in this area — have there been break-ins, vandalism, or insurance claims at this property in the last 3 years? What carrier currently insures it and at what premium?
- What's the average days-on-market for RENTAL listings here right now (not sales)? A rising rental-DOM trend means longer vacancies and softer asking-rent achievability than the comps imply.
- What's the recent tenant-quality profile in this submarket — average credit score on applications, eviction rate, late-payment / NSF rate, and stable-employment percentage? A property-management company in the area should have these aggregated.
- How much new apartment / multifamily construction is in the pipeline within 1–3 miles? Heavy new supply (>2% of stock underway) typically softens rents 12–24 months out; light construction supports rent growth.
Investment metrics
- 1% rule
- 1.02% ✓
- Cap rate
- 8.47%
- Cash-on-cash
- 7.78%
- DSCR
- 1.35
- GRM
- 8.2
CMA / ARV
- ARV (on-the-fly)
- $877,680
- Comps found
- 4
Show comp detail 4 sales within ~0.75 mi
| Address | Dist | Beds/Ba | Sqft | Sold | Price | $/sf | Match |
|---|---|---|---|---|---|---|---|
| 80 Corson Ave | 0.31mi | 7/2.0 (+1) | 1,584 (-14%) | 5mo | $755,000 | $477 | 54 |
| 24 Webster Ave | 0.46mi | 5/2.5 (-1) | 2,024 (+10%) | 4mo | $705,000 | $348 | 51 |
| 190 W Buchanan St | 0.49mi | 5/2.5 (-1) | 1,657 (-10%) | 3mo | $790,000 | $477 | 51 |
| 106 Westervelt Ave | 0.28mi | 6/5.0 | 2,075 (+13%) | 11mo | $550,000 | $265 | 45 |
Match score weights: distance 35% · size 25% · config 20% · recency 20%. Top-matched comps best support the ARV.
Projected returns pro-forma
-3.0% appreciation · 6.07% rent growth · sell at horizon
- IRR
- -1.3%
- Equity multiple
- 0.95×
- Total profit
- $-9,330
- Equity at exit
- $96,917
- IRR
- 11.2%
- Equity multiple
- 1.99×
- Total profit
- $179,949
- Equity at exit
- $56,200
Cash invested: $182,000 (down + closing). Projections, not guarantees.
Landlord ↔ Tenant lean methodology
- Overall (CITY)
- 0 Strongly Tenant-Friendly
- State New York
- 15 Strongly Tenant-Friendly · D+10
- County
- — inherits STATE
- City New York
- 0 Strongly Tenant-Friendly · D+34
ZIP-level market 10301
- Rents YoY
- 6.1%
- Active inventory
- 263
- Price-to-rent
- 16.4×
Monthly cashflow live
- Estimated rent
- $6,616 medium interval (Pro) →
- Mortgage (P&I)
- −$3,409
- Tax from tax record
- −$368 /mo · $4,415/yr
- Insurance
- −$271
- HOA
- −$0
- Vacancy / Maint / Mgmt
- −$1,389
- Net cashflow
- $1,179
Break-even live
2-unit breakdown (identical units grouped — click to expand)
| Units | Beds | Baths | Est. rent |
|---|---|---|---|
| 2× units | 3 | 1 | $6,616 |
| #1 | 3 | 1 | $3,308 |
| #2 | 3 | 1 | $3,308 |
| Total (2 units) | $6,616 | ||
UW: 25.0% down · 7.5% · 30yr · 1.5% tax · 5.0% vac · 8.0% maint · 8.0% mgmt
Financing live
Cash to close
- Down payment
- $162,500
- Closing costs
- $19,500
- Reserves months
- —
- Total cash needed
- —
Loan-product check · same deal, 3 products live
Conventional
25% down · 7.5% · 30yr
- Down + closing
- —
- Monthly P&I
- —
- Monthly cashflow
- —
- DSCR
- —
- Eligible?
- —
Personal DTI + credit; lowest rate.
DSCR
20% down · 8.5% · 30yr
- Down + closing
- —
- Monthly P&I
- —
- Monthly cashflow
- —
- DSCR
- —
- Eligible?
- —
No personal income docs; deal must DSCR.
Hard money
10% down · 12.0% · 12mo
- Down + closing
- —
- Monthly P&I
- —
- Monthly cashflow
- —
- DSCR
- —
- Eligible?
- —
Short-term bridge; refi at stabilization.
Listing history 40 events
-
2026-06-18days on market $649,999 Active 22 DOM
-
2026-06-17days on market $649,999 Active 21 DOM
-
2026-06-16days on market $649,999 Active 20 DOM
-
2026-06-15days on market $649,999 Active 19 DOM
-
2026-06-13days on market $649,999 Active 17 DOM
-
2026-06-10days on market $649,999 Active 13 DOM
-
2026-06-08days on market $649,999 Active 12 DOM
-
2026-06-08days on market $649,999 Active 11 DOM
-
2026-06-04days on market $649,999 Active 8 DOM
-
2026-06-03days on market $649,999 Active 7 DOM
-
2026-06-02days on market $649,999 Active 6 DOM
-
2026-06-01days on market $649,999 Active 5 DOM
-
2026-05-31days on market $649,999 Active 4 DOM
-
2026-05-20historical $649,999
-
2023-08-22price $579,000
-
2023-08-01$599,000 Active
-
2023-07-24historical
-
2023-06-20historical
-
2023-06-14$599,000 Active
-
2023-06-09$579,000 Active
-
2023-06-07historical
-
2023-05-04price $579,000
-
2023-04-10$599,000 Active
-
2022-11-19historical
-
2022-11-19status Pending
-
2022-11-17historical Contingent
-
2022-10-03$595,000 Active
-
2022-09-01historical
-
2022-08-17status Active
-
2022-08-12historical
-
2022-07-27price $599,000
-
2022-07-27status Active
-
2022-07-19historical
-
2022-07-05price $605,000
-
2022-06-17historical
-
2022-06-15$619,000 Active
-
2022-06-06price $625,000
-
2022-05-06price $635,000
-
2022-04-17$650,000 Active
-
2021-12-02soldstatus $11,242,021
ⓘ Source: listings_history table (triggers on properties + properties_extension) + one-shot
backfill from property_details.listing_events for pre-trigger history.
Tax reassessment forecast NY · Partial reset (capped growth)
- Current annual tax
- $4,415 · $368/mo
- Projected year-2 tax
- $7,700 · $642/mo
- Expected delta
- +$3,285/yr (+$274/mo · 74.4%)
ⓘ Screening estimate from a state-policy table — verify with the county assessor before closing.
Climate risk First Street
- Flood 1/10 Low FEMA zone X (unshaded) · 0% chance over 30 yrs
- Wildfire 1/10 Low
- Heat 7/10 Severe 7 d/yr ≥98°F today · 15 d/yr by 30 yrs out
- Wind 6/10 Major 54% chance of damaging wind over 30 yrs
- Air quality 4/10 Moderate 5 unhealthy d/yr today · 7 by 30 yrs out
Nearby sold comps map
Loading sold comps map…
Walkable amenities ~0.75 mi
Loading nearby amenities…
Taxation est. · year 1
- Rental income
- $79,392
- − Mortgage interest
- −$36,410
- − Property taxes
- −$4,415
- − Insurance
- −$3,250
- − Repairs & maintenance
- −$6,351
- − Management
- −$6,351
- − Depreciation
- −$18,909
- Taxable income
- $3,705
- Est. tax owed @ 24.0%
- −$889
- After-tax cash flow
- $13,262/yr
For passive investors: Depreciation is non-cash, so a rental often shows a tax loss while cash-flowing — sheltering income. Rental losses are passive: they offset passive income freely, and up to $25,000/yr can offset ordinary (W-2) income if you actively participate and your MAGI is under $100k (phasing out to $0 by $150k); unused losses carry forward. On sale, claimed depreciation is recaptured at up to 25%, and gains may owe capital-gains tax (a 1031 exchange can defer both). Figures are a year-1 estimate at your 24.0% rate — not tax advice; consult a CPA.
Schools (NCES district)
No district data.
Livability — New York
- Score
- 75/100
- State rank
- #268
- US rank
- #4188
Category grades
Schools grade is shown separately in the Schools card above.
Census & demographics
- Census place
- New York, NY
- County
- Richmond County · 404,174 people
- City population
- 7,731,280
- Metro
- New York-Newark-Jersey City, NY-NJ-PA
- Population (ZIP)
- 41,052
- Household income
- $85,609
- Rent vs Own
- Severe rent burden
- 2008.0
Population outlook (Richmond County) Hauer SSP2
- Today (2025)
- 482,784 people
- By 2030
- 481,831 · -0.2%
- By 2040
- 473,159 · -2.0%
- By 2050
- 457,242 · -5.3%
- By 2075
- 408,029 · -15.5%
- By 2100
- 341,459 · -29.3%
Race, ethnicity, and origin ACS 2023
- Neighborhood character
- Highly diverse neighborhood (Simpson 0.72)
- Race & ethnicity
- White 37% Hispanic / Latino 29% Black 23% Two or more races 16% Asian 7%
- Hispanic origin (detail)
- Mexican 5% Puerto Rican 10% Cuban 2% Dominican 6%
- Common ancestry
- Romanian 3% Scotch-Irish 2% Italian 1%
- Foreign-born
- 22% · Canada, China, Jamaica
- Languages at home
- 68% English-only · Spanish 16% Other Indo-European 5% Russian/Polish/Slavic 3%
Political lean MEDSL · Richmond
- 2024 margin
- Strong R (+29.8) · D 35.1% · R 64.9%
- 2008→2024 swing
- -25.7pp toward R · 2008: -4.0pp · 2024: -29.8pp
- All cycles
- 2024: R+29.8 2020: R+14.9 2016: R+16.8 2012: D+0.8 2008: R+4.0
Not yet ingested
- Civics
- —
Market trends
- HPI YoY
- ▼ -407.37%
- Current HPI
- 319.0616
- Rent YoY
- ▲ 6.07%
- Metro
- New York-Newark-Jersey City, NY-NJ-PA
- State GDP YoY
- ▲ 2.60%
- F500 in state
- 92
Industry mix (Fortune 500 HQ in NY)
| Industry | F500 HQs | Revenue |
|---|---|---|
| Financial Services | 10 | $950B |
|
||
| Consumer Goods | 9 | $162B |
|
||
| Insurance | 4 | $225B |
|
||
| Telecommunications | 2 | $144B |
|
||
| Pharmaceuticals | 2 | $112B |
|
||
| Media / Entertainment | 2 | $69B |
|
||
Price history
-94.2% since first listed27 events — show timeline
- 2026-05-20 Coming Soon $649,999 OneKey® MLS as Distributed by MLS Grid
- 2023-08-22 Price Changed $579,000 OneKey® MLS as Distributed by MLS Grid
- 2023-08-01 Listed $599,000 OneKey® MLS as Distributed by MLS Grid
- 2023-07-24 Listing Removed — OneKey® MLS as Distributed by MLS Grid
- 2023-06-20 Listing Removed — OneKey® MLS as Distributed by MLS Grid
- 2023-06-14 Listed $599,000 OneKey® MLS as Distributed by MLS Grid
- 2023-06-09 Listed $579,000 OneKey® MLS as Distributed by MLS Grid
- 2023-06-07 Listing Removed — OneKey® MLS as Distributed by MLS Grid
- 2023-05-04 Price Changed $579,000 OneKey® MLS as Distributed by MLS Grid
- 2023-04-10 Listed $599,000 OneKey® MLS as Distributed by MLS Grid
- 2022-11-19 Listing Removed — SIBORMLS
- 2022-11-19 Pending — SIBORMLS
- 2022-11-17 Contingent — SIBORMLS
- 2022-10-03 Listed $595,000 SIBORMLS
- 2022-09-01 Listing Removed — SIBORMLS
- 2022-08-17 Relisted — SIBORMLS
- 2022-08-12 Listing Removed — SIBORMLS
- 2022-07-27 Price Changed $599,000 SIBORMLS
- 2022-07-27 Relisted — SIBORMLS
- 2022-07-19 Listing Removed — SIBORMLS
- 2022-07-05 Price Changed $605,000 SIBORMLS
- 2022-06-17 Listing Removed — OneKey® MLS as Distributed by MLS Grid
- 2022-06-15 Listed $619,000 SIBORMLS
- 2022-06-06 Price Changed $625,000 OneKey® MLS as Distributed by MLS Grid
- 2022-05-06 Price Changed $635,000 OneKey® MLS as Distributed by MLS Grid
- 2022-04-17 Listed $650,000 OneKey® MLS as Distributed by MLS Grid
- 2021-12-02 Sold (Public Records) $11,242,021 Public Records
Property tax history
+5.2%/yrLatest (2025): $4,415 · +6.0% YoY. Source: county tax records.
Cash-flow waterfall
monthlySold comps — $/sqft
last 12 mo · ≤1 miLoading sold comps…