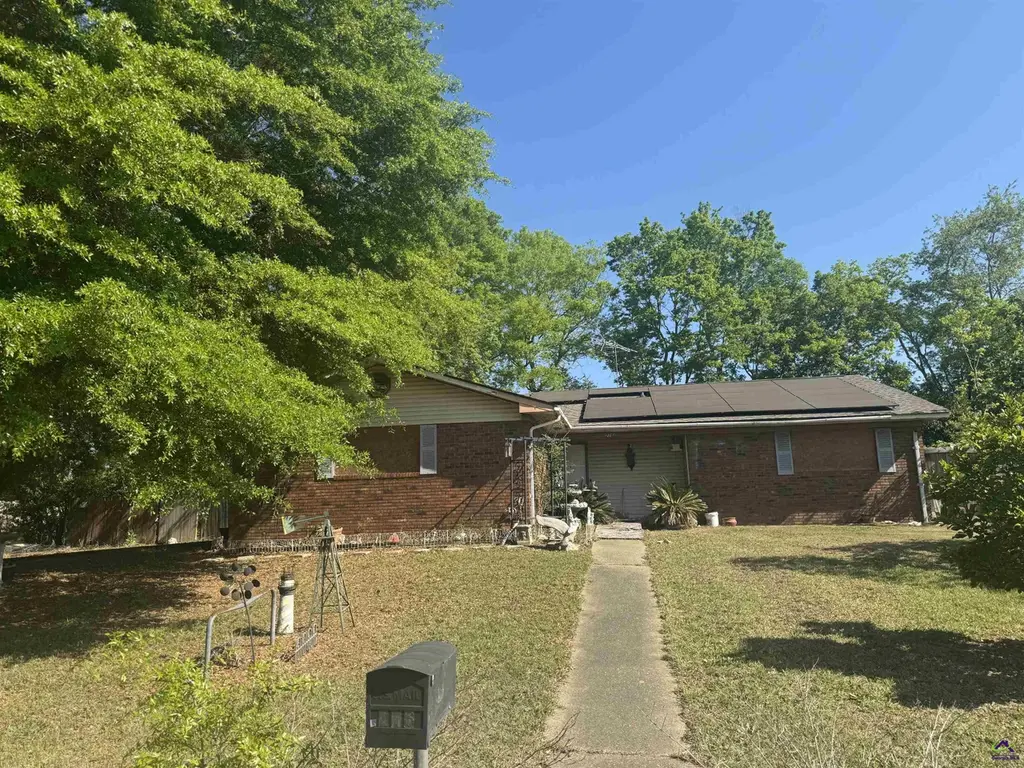
216 Hickory Glen Gln · Centerville, GA
Flood risk 1/10 · Minimal
- FEMA flood zone
- X (unshaded)
- Chance of flooding over 30 yrs
- 0.0%
- Est. flood insurance / yr
- $507 – $1,088
Fire risk 3/10 · Minor
- Est. fire insurance / yr
- $963 – $1,789
Heat risk 7/10 · Major
- Hot days now (above 107°F)
- 7 days/yr
- Hot days in 30 yrs
- 18 days/yr
Wind risk 6/10 · Moderate
- Chance of severe wind over 30 yrs
- 67.0%
Air-quality risk 3/10 · Minor
- Unhealthy air days now
- 2 days/yr
- Unhealthy air days in 30 yrs
- 3 days/yr
Risk factors via First Street. Map © Google.
Why this score? — see what drove the B+ grade
The composite is a weighted blend of 9 inputs, each scored 0–100. Each bar is that input's sub-score; the figure is the points it added to the 100-point composite (weight × sub-score).
- Cash flow +28.4/30.0
- ARV discount +15.0/15.0
- DSCR +10.0/10.0
- 1% rule +7.4/10.0
- Appreciation +5.0/10.0
- Schools +3.9/10.0
- Livability +3.7/5.0
- Rent growth +2.5/5.0
- Condition / age +2.5/5.0
$129,800
🖨 Deal sheet (PDF) 📄 Offer letter ✓ Due diligence
Listing remarks
Charming 3-bedroom, 2-bath brick home located in desirable Centerville, GA! This property offers a fantastic opportunity for homeowners or investors alike, being sold as-is with all belongings to convey—making it truly move-in ready or rental-ready from day one. The home features a newer roof and solar panels, helping keep energy costs down while adding long-term value. INVESTOR or Rehab Special: Enjoy the fenced-in backyard, perfect for pets, entertaining, or relaxing in your own private outdoor space. Conveniently situated near an up-and-coming area with new construction by Lennar Homes, this location offers exciting growth potential and increasing property values. Whether you&rsquo
Key facts
- Newer roof
- Fenced-in backyard
- Solar panels
Tags
Property features AI
Exterior
- Parking: Detached garage (2 covered spaces, 2 total parking spaces)
- Utilities: Public water; Public sewer
- Home design: Single-family residence; One level
- Construction: Brick construction
- Exterior features: Fenced lot; No pool
Interior
- Kitchen: Electric range; Refrigerator
- Flooring: See remarks
- Bathrooms: 2 full bathrooms
- Heating & cooling: Has heating (see remarks)
- Interior features: Storage; Fireplace (1)
Neighborhood map
What this means for you Summary
Snapshot
- This is a 3-bed/2.0-bath single-family listed at $130k.
Deal economics
- At list price, monthly cash flow is $420 ($5k/yr) — positive.
- The deal already cash-flows at list — no discount required.
- Meets the 1% rule at list price ($2k rent vs $130k).
- Recommended offer: $126k (3.0% below list) — sets the bar for market timing.
Location & tenants
- Location reads 73/100 on livability (#56 in GA) — a middle-class / working-renter tenant base. Strengths: cost of living A+, housing A+, health & safety A-; Watch: amenities F, commute F.
- Houston County (urban): math 43% / reading 46% proficiency, ranked #23 of 174 in GA (top 13%) — families likely to look elsewhere, expect single-tenant / working-renter base with shorter leases.
- Zoned schools: Centerville Elementary School (math 50% / reading 49%, grade D, #264 of 1,228 statewide, top 23%, 630 students, 84% FRL); Warner Robins Middle School (math 25% / reading 37%, grade F, #237 of 470 statewide, top 51%, 813 students, 84% FRL); Northside High School (math 5% / reading 21%, grade F, #331 of 424 statewide, top 78%, 1,959 students, 84% FRL) — zoned schools average 84% FRL vs 46% district-wide (38 pts higher); higher-poverty schools than district average — tighter screening recommended.
- Zoned-school proficiency averages 31% at this address vs 44% district-wide (-13 pts) — the specific schools serving this property underperform the Houston County average; the district grade overstates school quality for this exact location.
- Market conditions: 1 active listings in the ZIP; 12 comparable units currently listed for rent nearby; rentals at typical pace (median 23d on market — plan ~3-4 weeks tenant-placement turnaround); 42% of comp listings sitting > 30 days — soft ceiling on asking rent; 1,545 units permitted in Houston County in 2024 (336 in 5+ unit buildings).
Forward outlook
- In year one you build about $5k of equity ($897 loan paydown + $4k appreciation (3.0% local appreciation)).
- Houston County population projected at +22% by 2050 — long-run rental-demand tailwind backs the buy-and-hold thesis.
- At projected returns (3.0% appreciation + 3.0% rent growth), your $36k cash investment doubles in ~4 years — after that, you're playing with house money.
- By year 7, paydown + projected appreciation supports a ~$30k cash-out refi (75% LTV) — recoverable capital for the next deal without selling this one.
Negotiation context
- It's been on market 32 days — a 3% lower offer ($126k) is reasonable based on typical stale-listing flexibility.
- 2 sale attempts with the ask held roughly flat each time — persistent listings suggest the price (not the market) is what's stuck; bring a comps-based counter.
- Current owner paid $72k; list at $130k implies a 82% gain — meaningful room to come down on a strong offer.
Risks & watch-outs
- Climate carrying-cost: major wind risk, 67% chance of damaging wind over 30y; extreme-heat days projected 7→18/yr by 2055 (HVAC capex compounding) — expect insurance premiums to compound above CPI over the hold.
Questions for the listing agent
- It's been on market 32 days. Have you received any prior offers? Is the seller open to a 3% concession, seller financing, or rate buy-down credit?
- Built in 1978 — when were the roof, HVAC, electrical panel, plumbing, and water heater last replaced?
- Is there a deadline driving the sale (1031 exchange, divorce, estate, relocation)? That informs how much negotiation room exists.
- What's the average days-on-market for RENTAL listings here right now (not sales)? A rising rental-DOM trend means longer vacancies and softer asking-rent achievability than the comps imply.
- What's the recent tenant-quality profile in this submarket — average credit score on applications, eviction rate, late-payment / NSF rate, and stable-employment percentage? A property-management company in the area should have these aggregated.
- How much new for-sale + rental construction is in the pipeline within 1–3 miles? Heavy new supply typically softens prices + rents 12–24 months out; constrained supply supports both.
Investment metrics
- 1% rule
- 1.24% ✓
- Cap rate
- 10.17%
- Cash-on-cash
- 13.85%
- DSCR
- 1.62
- GRM
- 6.7
CMA / ARV
- ARV (median comp)
- $187,081
- List price
- $129,800
- Delta
- -30.62%
- Verdict
- UNDERPRICED
- Comps
- 20 within 1.0 mi
Show comp detail 12 sales within ~0.75 mi
| Address | Dist | Beds/Ba | Sqft | Sold | Price | $/sf | Match |
|---|---|---|---|---|---|---|---|
| 205 Scarborough Rd | 0.25mi | 3/2.0 | 1,761 (+5%) | 2mo | $225,000 | $128 | 78 |
| 110 Monteigo Ct | 0.33mi | 3/2.0 | 1,754 (+5%) | 4mo | $215,000 | $123 | 72 |
| 210 Webb St | 0.42mi | 3/2.0 | 1,600 (-4%) | 2mo | $235,000 | $147 | 72 |
| 102 Monteigo Ct | 0.38mi | 3/2.0 | 1,742 (+4%) | 5mo | $145,000 | $83 | 71 |
| 227 Crestwood Cir | 0.61mi | 3/2.0 | 1,652 (-1%) | 1mo | $170,000 | $103 | 69 |
| 303 Woodhaven Rd | 0.48mi | 3/2.0 | 1,584 (-5%) | 1mo | $218,000 | $138 | 69 |
| 103 Persimmon Glen Ct | 0.25mi | 3/2.0 | 1,436 (-14%) | 5mo | $130,000 | $91 | 60 |
| 106 Crestwood Rd | 0.65mi | 3/2.0 | 1,572 (-6%) | 0mo | $236,000 | $150 | 60 |
| 107 Stonefield Ct | 0.44mi | 3/2.5 | 1,468 (-12%) | 6mo | $170,000 | $116 | 52 |
| 104 Cedar Glen Ct | 0.69mi | 3/2.0 | 1,791 (+7%) | 8mo | $256,000 | $143 | 49 |
| 123 Meriwood Dr | 0.70mi | 4/2.0 (+1) | 1,791 (+7%) | 5mo | $219,000 | $122 | 46 |
| 106 Tor Dr. Dr | 0.73mi | 3/2.0 | 1,920 (+15%) | 6mo | $216,000 | $113 | 36 |
Match score weights: distance 35% · size 25% · config 20% · recency 20%. Top-matched comps best support the ARV.
Projected returns pro-forma
3.0% appreciation · 3.0% rent growth · sell at horizon
- IRR
- 20.5%
- Equity multiple
- 2.17×
- Total profit
- $42,355
- Equity at exit
- $58,364
- IRR
- 21.6%
- Equity multiple
- 4.12×
- Total profit
- $113,344
- Equity at exit
- $89,945
Cash invested: $36,344 (down + closing). Projections, not guarantees.
Landlord ↔ Tenant lean methodology
- Overall (STATE)
- 90 Strongly Landlord-Friendly
- State Georgia
- 90 Strongly Landlord-Friendly · R+3
- County
- — inherits STATE
- City
- — inherits STATE
ZIP-level market 31208
- Active inventory
- 1
- Price-to-rent
- 6.7×
Monthly cashflow live
- Estimated rent
- $1,609 high interval (Pro) →
- Mortgage (P&I)
- −$681
- Tax from tax record
- −$117 /mo · $1,401/yr
- Insurance
- −$54
- HOA
- −$0
- Vacancy / Maint / Mgmt
- −$338
- Net cashflow
- $420
Break-even live
Sensitivity live
| Price | -10% $493 | -5% $456 | +0% $420 | +5% $383 | +10% $346 |
|---|---|---|---|---|---|
| Rent | -10% $292 | -5% $356 | +0% $420 | +5% $483 | +10% $547 |
| Rate | -1.0pp $485 | -0.5pp $453 | base $420 | +0.5pp $386 | +1.0pp $352 |
UW: 25.0% down · 7.5% · 30yr · 1.5% tax · 5.0% vac · 8.0% maint · 8.0% mgmt
Financing live
Cash to close
- Down payment
- $32,450
- Closing costs
- $3,894
- Reserves months
- —
- Total cash needed
- —
Loan-product check · same deal, 3 products live
Conventional
25% down · 7.5% · 30yr
- Down + closing
- —
- Monthly P&I
- —
- Monthly cashflow
- —
- DSCR
- —
- Eligible?
- —
Personal DTI + credit; lowest rate.
DSCR
20% down · 8.5% · 30yr
- Down + closing
- —
- Monthly P&I
- —
- Monthly cashflow
- —
- DSCR
- —
- Eligible?
- —
No personal income docs; deal must DSCR.
Hard money
10% down · 12.0% · 12mo
- Down + closing
- —
- Monthly P&I
- —
- Monthly cashflow
- —
- DSCR
- —
- Eligible?
- —
Short-term bridge; refi at stabilization.
Rent comps 12 comps
| Address | Beds | Baths | Sqft | Rent | $/sqft | DOM | Units | Dist |
|---|---|---|---|---|---|---|---|---|
| 700 Fieldstone Rd Warner Robins, GA | 3.0 | 2.0 | 1339 | $1,625 | $1.21 | 45d | 1 | 0.33mi |
| 213 Webb St Warner Robins, GA | 3.0 | 2.0 | 1152 | $1,600 | $1.39 | 22d | 1 | 0.44mi |
| 108 Stonefield Ct Warner Robins, GA | 3.0 | 2.0 | 1483 | $1,475 | $0.99 | 45d | 1 | 0.49mi |
| 106 Scarborough Rd Centerville, GA | 3.0 | 2.0 | 1471 | $1,400 | $0.95 | 22d | 1 | 0.49mi |
| 104 Woodcarver Trl Warner Robins, GA | 3.0 | 2.0 | 1300 | $1,600 | $1.23 | 15d | 1 | 0.76mi |
| 210 Surrey Dr Warner Robins, GA | 3.0 | 2.0 | 1620 | $1,600 | $0.99 | 22d | 1 | 0.98mi |
| 103 Abney Ct Centerville, GA | 3.0 | 2.0 | 1500 | $1,800 | $1.20 | 22d | 1 | 1.03mi |
| 208 Wray St Warner Robins, GA | 3.0 | 2.0 | 1509 | $1,700 | $1.13 | 15d | 1 | 1.04mi |
| 111 Hawthorne Rd Warner Robins, GA | 3.0 | 2.0 | 1551 | $1,500 | $0.97 | 45d | 1 | 1.29mi |
| 501 Pinecrest Dr Warner Robins, GA | 4.0 | 2.0 | 1818 | $2,100 | $1.16 | 45d | 1 | 1.34mi |
| 111 Rainbow Ave Warner Robins, GA | 3.0 | 2.0 | 1422 | $1,695 | $1.19 | 22d | 1 | 1.37mi |
| 111 Rainbow Ave Warner Robins, GA | 3.0 | 2.0 | 1422 | $1,695 | $1.19 | 45d | 1 | 1.37mi |
Listing history 13 events
-
2026-06-21days on market $129,800 Active 32 DOM
-
2026-06-19days on market $129,800 Active 30 DOM
-
2026-06-18days on market $129,800 Active 29 DOM
-
2026-06-17days on market $129,800 Active 28 DOM
-
2026-06-16days on market $129,800 Active 27 DOM
-
2026-06-15days on market $129,800 Active 26 DOM
-
2026-06-14days on market $129,800 Active 24 DOM
-
2026-06-13pricedays on market $129,800 Active 23 DOM
-
2026-06-10statusdays on market $134,800 Active 21 DOM
-
2026-05-07status Pending 932-char remark
-
2026-04-17$134,800 Active 932-char remark
-
1990-07-23soldstatus $71,500
-
1978-02-28soldstatus $44,000
ⓘ Source: listings_history table (triggers on properties + properties_extension) + one-shot
backfill from property_details.listing_events for pre-trigger history.
Tax reassessment forecast GA · Resets to sale price
- Current annual tax
- $1,401 · $117/mo
- Projected year-2 tax
- $1,401 · $117/mo
- Expected delta
- $0/yr ($0/mo · 0.0%)
ⓘ Screening estimate from a state-policy table — verify with the county assessor before closing.
Climate risk First Street
- Flood 1/10 Low FEMA zone X (unshaded) · 0% chance over 30 yrs
- Wildfire 3/10 Moderate
- Heat 7/10 Severe 7 d/yr ≥107°F today · 18 d/yr by 30 yrs out
- Wind 6/10 Major 67% chance of damaging wind over 30 yrs
- Air quality 3/10 Moderate 2 unhealthy d/yr today · 3 by 30 yrs out
Nearby sold comps map
Loading sold comps map…
Walkable amenities ~0.75 mi
Loading nearby amenities…
Taxation est. · year 1
- Rental income
- $19,307
- − Mortgage interest
- −$7,271
- − Property taxes
- −$1,401
- − Insurance
- −$649
- − Repairs & maintenance
- −$1,545
- − Management
- −$1,545
- − Depreciation
- −$3,776
- Taxable income
- $3,121
- Est. tax owed @ 24.0%
- −$749
- After-tax cash flow
- $4,286/yr
For passive investors: Depreciation is non-cash, so a rental often shows a tax loss while cash-flowing — sheltering income. Rental losses are passive: they offset passive income freely, and up to $25,000/yr can offset ordinary (W-2) income if you actively participate and your MAGI is under $100k (phasing out to $0 by $150k); unused losses carry forward. On sale, claimed depreciation is recaptured at up to 25%, and gains may owe capital-gains tax (a 1031 exchange can defer both). Figures are a year-1 estimate at your 24.0% rate — not tax advice; consult a CPA.
Schools (NCES district)
- District
- Houston County
- NCES district ID
- 1302880
- Math proficiency
- 43% ▼ -7.00%
- Reading proficiency
- 46% ▼ -2.00%
- Median HH income
- $54,823
- Composite
- 38.68/100
- National rank
- #4144
- State rank
- #23 of 174 in GA
Livability — Centerville
- Score
- 73/100
- State rank
- #56
- US rank
- #5374
Category grades
Schools grade is shown separately in the Schools card above.
Census & demographics
- Census place
- Centerville, GA
Population outlook (Houston County) Hauer SSP2
- Today (2025)
- 169,502 people
- By 2030
- 178,486 · +5.3%
- By 2040
- 194,642 · +14.8%
- By 2050
- 207,119 · +22.2%
- By 2075
- 231,480 · +36.6%
- By 2100
- 235,034 · +38.7%
Not yet ingested
- Political lean
- —
- Race & ethnicity
- —
- Common origin
- —
- Civics
- —
Market trends
- HPI YoY
- —
- Current HPI
- —
- Rent YoY
- —
- Metro
- —
- State GDP YoY
- ▲ 2.66%
- F500 in state
- 28
Industry mix (Fortune 500 HQ in GA)
| Industry | F500 HQs | Revenue |
|---|---|---|
| Paper / Packaging | 2 | $29B |
|
||
| Retail | 1 | $160B |
|
||
| Transportation / Logistics | 1 | $91B |
|
||
| Airlines | 1 | $62B |
|
||
| Consumer Goods | 1 | $47B |
|
||
| Utilities | 1 | $25B |
|
||
Price history
+195.0% since first listed6 events — show timeline
- 2026-06-10 Price Changed $129,800 CGMLS
- 2026-06-09 Relisted — CGMLS
- 2026-05-07 Pending — CGMLS
- 2026-04-17 Listed $134,800 CGMLS
- 1990-07-23 Sold (Public Records) $71,500 Public Records
- 1978-02-28 Sold (Public Records) $44,000 Public Records
Property tax history
+5.1%/yrLatest (2025): $1,401 · +8.4% YoY. Source: county tax records.
Cash-flow waterfall
monthlySold comps — $/sqft
last 12 mo · ≤1 miLoading sold comps…