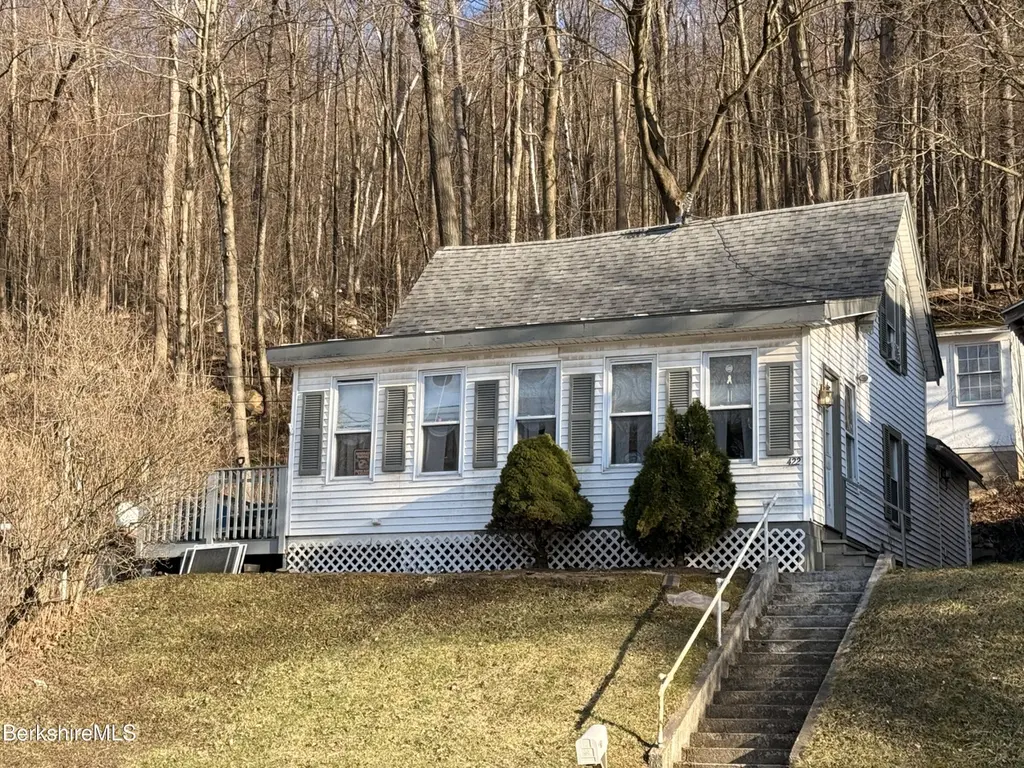
422 W Main St · North Adams, MA
Flood risk 1/10 · Minimal
- FEMA flood zone
- X
- Chance of flooding over 30 yrs
- 0.0%
- Est. flood insurance / yr
- $473 – $860
Fire risk 3/10 · Minor
- Est. fire insurance / yr
- $915 – $1,699
Heat risk 2/10 · Minimal
- Hot days now (above 92°F)
- 9 days/yr
- Hot days in 30 yrs
- 20 days/yr
Wind risk 3/10 · Minor
- Chance of severe wind over 30 yrs
- 7.0%
Air-quality risk 2/10 · Minimal
- Unhealthy air days now
- 0 days/yr
- Unhealthy air days in 30 yrs
- 1 days/yr
Risk factors via First Street. Map © Google.
Why this score? — see what drove the C grade
The composite is a weighted blend of 9 inputs, each scored 0–100. Each bar is that input's sub-score; the figure is the points it added to the 100-point composite (weight × sub-score).
- Cash flow +19.4/30.0
- ARV discount +15.0/15.0
- DSCR +6.1/10.0
- 1% rule +4.4/10.0
- Livability +2.8/5.0
- Rent growth +2.5/5.0
- Condition / age +2.5/5.0
- Appreciation +1.9/10.0
- Schools +1.8/10.0
$149,900
🖨 Deal sheet 📄 Offer letter ✓ Due diligence
Listing remarks MLS
Cape-style 2 bedroom home with a low entry price and recent key updates already completed- including roof, siding, windows, and heating system. The home is livable as-is and offers a opportunity to build equity. Features include a deck, multiple sheds, and a manageable yard. With a little bit of hard work, this could be a nice home- perfect for someone looking to move in and improve over time in an affordable price range.
Key facts
- Multiple sheds
- Manageable yard
- Deck
Tags
Neighborhood map
What this means for you Summary
Snapshot
- This is a 2-bed/1.0-bath single-family listed at $150k.
Deal economics
- At list price, monthly cash flow is $168 ($2k/yr) — positive.
- The deal already cash-flows at list — no discount required.
- To meet the 1% rule (rent ≥ 1% of price), the offer needs to be $140k (6.4% below list).
- Recommended offer: $140k (6.4% below list) — sets the bar for 1% rule.
- Cap rate 7.6% vs local median 5.8% in North Adams — top-decile yield for the area; either an underpriced asset or a hidden risk that comps aren't pricing in. Stress-test before assuming the spread holds.
Location & tenants
- Location reads 55/100 on livability (#242 in MA) — a working-class tenant base; expect higher turnover. Strengths: housing A+, cost of living A-; Watch: employment C-, health & safety D, schools F.
- North Adams (town): math 14% / reading 29% proficiency, ranked #291 of 302 in MA (top 96%) — low school quality limits family demand, transient renter base, plan for 1-2y turnover.
- Market conditions: 99 active listings in the ZIP; 4 comparable units currently listed for rent nearby; rentals at typical pace (median 14d on market — plan ~3-4 weeks tenant-placement turnaround); 130 units permitted in Berkshire County in 2024 (10 in 5+ unit buildings).
Forward outlook
- Local home prices are declining (-3.0%/yr); year-one equity from $1k of loan paydown is wiped out by about $4k of value loss. Plan a longer hold.
- Berkshire County population projected at -24% by 2050 — secular population decline; favor cash flow + early exit over multi-decade hold.
Negotiation context
- It's been on market 17 days — a 2% lower offer ($148k) is reasonable based on typical stale-listing flexibility.
- 7 sale attempts since 20y ago with the ask held roughly flat each time — persistent listings suggest the price (not the market) is what's stuck; bring a comps-based counter.
- Current owner paid $16k; list at $150k implies a 837% gain — meaningful room to come down on a strong offer.
Risks & watch-outs
- Watch-outs: built in 1900 — expect roof / HVAC / electrical / plumbing capex.
Questions for the listing agent
- Built in 1900 — when were the roof, HVAC, electrical panel, plumbing, and water heater last replaced?
- Is there a deadline driving the sale (1031 exchange, divorce, estate, relocation)? That informs how much negotiation room exists.
- Schools are F-rated, which usually means shorter tenancies and higher turnover. Who's the typical renter profile here, and what's been the actual vacancy rate?
- Crime grade is F in this area — have there been break-ins, vandalism, or insurance claims at this property in the last 3 years? What carrier currently insures it and at what premium?
- What's the average days-on-market for RENTAL listings here right now (not sales)? A rising rental-DOM trend means longer vacancies and softer asking-rent achievability than the comps imply.
- What's the recent tenant-quality profile in this submarket — average credit score on applications, eviction rate, late-payment / NSF rate, and stable-employment percentage? A property-management company in the area should have these aggregated.
- How much new for-sale + rental construction is in the pipeline within 1–3 miles? Heavy new supply typically softens prices + rents 12–24 months out; constrained supply supports both.
Investment metrics
- 1% rule
- 0.94% ✗
- Cap rate
- 7.64%
- Cash-on-cash
- 4.81%
- DSCR
- 1.21
- GRM
- 8.9
CMA / ARV
- ARV (median comp)
- $203,500
- List price
- $149,900
- Delta
- -26.34%
- Verdict
- UNDERPRICED
- Comps
- 20 within 1.0 mi
Show comp detail 7 sales within ~0.75 mi
| Address | Dist | Beds/Ba | Sqft | Sold | Price | $/sf | Match |
|---|---|---|---|---|---|---|---|
| 458 West Main St | 0.07mi | 2/1.5 | 969 (+2%) | 18mo | $139,000 | $143 | 77 |
| 138 Richview Ave | 0.26mi | 3/1.0 (+1) | 1,008 (+6%) | 1mo | $200,000 | $198 | 72 |
| 480 Main St | 0.11mi | 3/1.0 (+1) | 1,002 (+5%) | 12mo | $135,000 | $135 | 72 |
| 8 Richview Ave | 0.16mi | 1/1.0 (-1) | 1,061 (+11%) | 12mo | $89,000 | $84 | 59 |
| 39 Goodrich St | 0.11mi | 3/1.0 (+1) | 864 (-9%) | 22mo | $250,000 | $289 | 55 |
| 84 West Main St | 0.60mi | 3/1.0 (+1) | 1,064 (+12%) | 5mo | $197,000 | $185 | 44 |
| 271 Notch Rd | 0.67mi | 2/1.0 | 1,075 (+13%) | 24mo | $249,000 | $232 | 28 |
Match score weights: distance 35% · size 25% · config 20% · recency 20%. Top-matched comps best support the ARV.
Projected returns pro-forma
-3.0% appreciation · 3.0% rent growth · sell at horizon
- IRR
- -8.8%
- Equity multiple
- 0.68×
- Total profit
- $-13,604
- Equity at exit
- $22,351
- IRR
- 0.6%
- Equity multiple
- 1.04×
- Total profit
- $1,810
- Equity at exit
- $12,961
Cash invested: $41,972 (down + closing). Projections, not guarantees.
Landlord ↔ Tenant lean methodology
- Overall (STATE)
- 20 Strongly Tenant-Friendly
- State Massachusetts
- 20 Strongly Tenant-Friendly · D+15
- County
- — inherits STATE
- City
- — inherits STATE
ZIP-level market 01247
- Home prices YoY
- -2.0%
- Active inventory
- 99
- Price-to-rent
- 8.9×
Monthly cashflow live
- Estimated rent
- $1,403 medium interval (Pro) →
- Mortgage (P&I)
- −$786
- Tax from tax record
- −$92 /mo · $1,099/yr
- Insurance
- −$62
- HOA
- −$0
- Vacancy / Maint / Mgmt
- −$295
- Net cashflow
- $168
Break-even live
UW: 25.0% down · 7.5% · 30yr · 1.5% tax · 5.0% vac · 8.0% maint · 8.0% mgmt
Financing live
Cash to close
- Down payment
- $37,475
- Closing costs
- $4,497
- Reserves months
- —
- Total cash needed
- —
Loan-product check · same deal, 3 products live
Conventional
25% down · 7.5% · 30yr
- Down + closing
- —
- Monthly P&I
- —
- Monthly cashflow
- —
- DSCR
- —
- Eligible?
- —
Personal DTI + credit; lowest rate.
DSCR
20% down · 8.5% · 30yr
- Down + closing
- —
- Monthly P&I
- —
- Monthly cashflow
- —
- DSCR
- —
- Eligible?
- —
No personal income docs; deal must DSCR.
Hard money
10% down · 12.0% · 12mo
- Down + closing
- —
- Monthly P&I
- —
- Monthly cashflow
- —
- DSCR
- —
- Eligible?
- —
Short-term bridge; refi at stabilization.
Rent comps 4 comps
| Address | Beds | Baths | Sqft | Rent | $/sqft | DOM | Units | Dist |
|---|---|---|---|---|---|---|---|---|
| 1 Pebble St Apt B North Adams, MA | 1.0 | 1.0 | 1049 | $1,500 | $1.43 | 43d | 1 | 0.65mi |
| 21-23 Lyman St Unit 21B North Adams, MA | 2.0 | 1.0 | 725 | $1,300 | $1.79 | 14d | 1 | 0.92mi |
| 210 Eagle St Unit 1 North Adams, MA | 2.0 | 1.0 | 1040 | $1,300 | $1.25 | 14d | 1 | 1.21mi |
| 132 E Quincy St Unit 3 North Adams, MA | 2.0 | 1.0 | 800 | $1,450 | $1.81 | 13d | 1 | 1.44mi |
Listing history 16 events
-
2026-05-06status Pending 425-char remark
Show marketing remark (425 chars)
Cape-style 2 bedroom home with a low entry price and recent key updates already completed- including roof, siding, windows, and heating system. The home is livable as-is and offers a opportunity to build equity. Features include a deck, multiple sheds, and a manageable yard. With a little bit of hard work, this could be a nice home- perfect for someone looking to move in and improve over time in an affordable price range.
-
2026-04-29status Active 425-char remark
Show marketing remark (425 chars)
Cape-style 2 bedroom home with a low entry price and recent key updates already completed- including roof, siding, windows, and heating system. The home is livable as-is and offers a opportunity to build equity. Features include a deck, multiple sheds, and a manageable yard. With a little bit of hard work, this could be a nice home- perfect for someone looking to move in and improve over time in an affordable price range.
-
2026-04-20historical 425-char remark
Show marketing remark (425 chars)
Cape-style 2 bedroom home with a low entry price and recent key updates already completed- including roof, siding, windows, and heating system. The home is livable as-is and offers a opportunity to build equity. Features include a deck, multiple sheds, and a manageable yard. With a little bit of hard work, this could be a nice home- perfect for someone looking to move in and improve over time in an affordable price range.
-
2026-04-09$149,900 Active 425-char remark
Show marketing remark (425 chars)
Cape-style 2 bedroom home with a low entry price and recent key updates already completed- including roof, siding, windows, and heating system. The home is livable as-is and offers a opportunity to build equity. Features include a deck, multiple sheds, and a manageable yard. With a little bit of hard work, this could be a nice home- perfect for someone looking to move in and improve over time in an affordable price range.
-
2010-02-04soldstatus $16,000 110-char remark
Show marketing remark (110 chars)
Adorable house move in condition, priced way below assessed value. No off st. parking but could be worked out.
-
2009-10-29$21,500 110-char remark
Show marketing remark (110 chars)
Adorable house move in condition, priced way below assessed value. No off st. parking but could be worked out.
-
2009-10-08historical
-
2009-04-08$37,400
-
2009-03-30historical
-
2008-09-30$52,500
-
2007-11-21soldstatus $16,500
-
2007-11-21soldstatus $16,500
-
2007-04-27$18,699
-
2006-10-08historical
-
2006-04-08$49,900
-
1988-09-07soldstatus $45,877
ⓘ Source: listings_history table (triggers on properties + properties_extension) + one-shot
backfill from property_details.listing_events for pre-trigger history.
Tax reassessment forecast MA · Partial reset (capped growth)
- Current annual tax
- $1,099 · $92/mo
- Projected year-2 tax
- $1,471 · $123/mo
- Expected delta
- +$372/yr (+$31/mo · 33.9%)
ⓘ Screening estimate from a state-policy table — verify with the county assessor before closing.
Climate risk First Street
- Flood 1/10 Low FEMA zone X · 0% chance over 30 yrs
- Wildfire 3/10 Moderate
- Heat 2/10 Low 9 d/yr ≥92°F today · 20 d/yr by 30 yrs out
- Wind 3/10 Moderate 7% chance of damaging wind over 30 yrs
- Air quality 2/10 Low 0 unhealthy d/yr today · 1 by 30 yrs out
Nearby sold comps map
Loading sold comps map…
Walkable amenities ~0.75 mi
Loading nearby amenities…
Taxation est. · year 1
- Rental income
- $16,838
- − Mortgage interest
- −$8,397
- − Property taxes
- −$1,099
- − Insurance
- −$750
- − Repairs & maintenance
- −$1,347
- − Management
- −$1,347
- − Depreciation
- −$4,361
- Taxable loss
- −$462
- Est. tax savings @ 24.0%
- +$111
- After-tax cash flow
- $2,131/yr
For passive investors: Depreciation is non-cash, so a rental often shows a tax loss while cash-flowing — sheltering income. Rental losses are passive: they offset passive income freely, and up to $25,000/yr can offset ordinary (W-2) income if you actively participate and your MAGI is under $100k (phasing out to $0 by $150k); unused losses carry forward. On sale, claimed depreciation is recaptured at up to 25%, and gains may owe capital-gains tax (a 1031 exchange can defer both). Figures are a year-1 estimate at your 24.0% rate — not tax advice; consult a CPA.
Schools (NCES district)
- District
- North Adams
- NCES district ID
- 2508670
- Math proficiency
- 14% ▼ -13.00%
- Reading proficiency
- 29% ▼ -11.00%
- Median HH income
- $36,746
- Composite
- 17.83/100
- National rank
- #9006
- State rank
- #291 of 302 in MA
Livability — North Adams
- Score
- 55/100
- State rank
- #242
- US rank
- #23506
Category grades
Schools grade is shown separately in the Schools card above.
Census & demographics
- Census place
- North Adams, MA
- City population
- 14,967
- Population (ZIP)
- 14,967
Population outlook (Berkshire County) Hauer SSP2
- Today (2025)
- 119,723 people
- By 2030
- 114,608 · -4.3%
- By 2040
- 102,806 · -14.1%
- By 2050
- 91,305 · -23.7%
- By 2075
- 71,517 · -40.3%
- By 2100
- 57,988 · -51.6%
Race, ethnicity, and origin ACS 2023
- Neighborhood character
- Predominantly White (88%)
- Race & ethnicity
- White 88% Hispanic / Latino 5% Two or more races 4% Asian 3%
- Hispanic origin (detail)
- Puerto Rican 1%
- Common ancestry
- Lithuanian 15% Romanian 4% German 2%
- Foreign-born
- 5% · Canada
- Languages at home
- 95% English-only · Other Indo-European 2% Spanish 2% French/Haitian/Cajun 0%
Political lean MEDSL · Berkshire
- 2024 margin
- Solid D (+39.9) · D 68.9% · R 29.0% · Other 2.1%
- 2008→2024 swing
- -12.5pp toward R · 2008: 52.4pp · 2024: 39.9pp
- All cycles
- 2024: D+39.9 2020: D+47.1 2016: D+41.5 2012: D+53.7 2008: D+52.4
Not yet ingested
- Civics
- —
Market trends
- HPI YoY
- ▼ -6.22%
- Current HPI
- 298.8949
- Rent YoY
- —
- Metro
- —
- State GDP YoY
- ▲ 2.28%
- F500 in state
- 38
Industry mix (Fortune 500 HQ in MA)
| Industry | F500 HQs | Revenue |
|---|---|---|
| Technology | 3 | $17B |
|
||
| Insurance | 2 | $84B |
|
||
| Retail | 2 | $76B |
|
||
| Life Sciences | 1 | $43B |
|
||
| Energy Technology | 1 | $31B |
|
||
| Aerospace / Defense | 1 | $18B |
|
||
Price history
+226.7% since first listed16 events — show timeline
- 2026-05-06 Pending — BCMLS
- 2026-04-29 Relisted — BCMLS
- 2026-04-20 Listing Removed — BCMLS
- 2026-04-09 Listed $149,900 BCMLS
- 2010-02-04 Sold (MLS) $16,000 BCMLS
- 2009-10-29 Listed $21,500 BCMLS
- 2009-10-08 Listing Removed — BCMLS
- 2009-04-08 Listed $37,400 BCMLS
- 2009-03-30 Listing Removed — BCMLS
- 2008-09-30 Listed $52,500 BCMLS
- 2007-11-21 Sold (Public Records) $16,500 Public Records
- 2007-11-21 Sold (MLS) $16,500 MLS PIN
- 2007-04-27 Listed $18,699 MLS PIN
- 2006-10-08 Listing Removed — BCMLS
- 2006-04-08 Listed $49,900 BCMLS
- 1988-09-07 Sold (Public Records) $45,877 Public Records
Property tax history
+3.7%/yrLatest (2023): $1,099 · +7.2% YoY. Source: county tax records.
Cash-flow waterfall
monthlySold comps — $/sqft
last 12 mo · ≤1 miLoading sold comps…