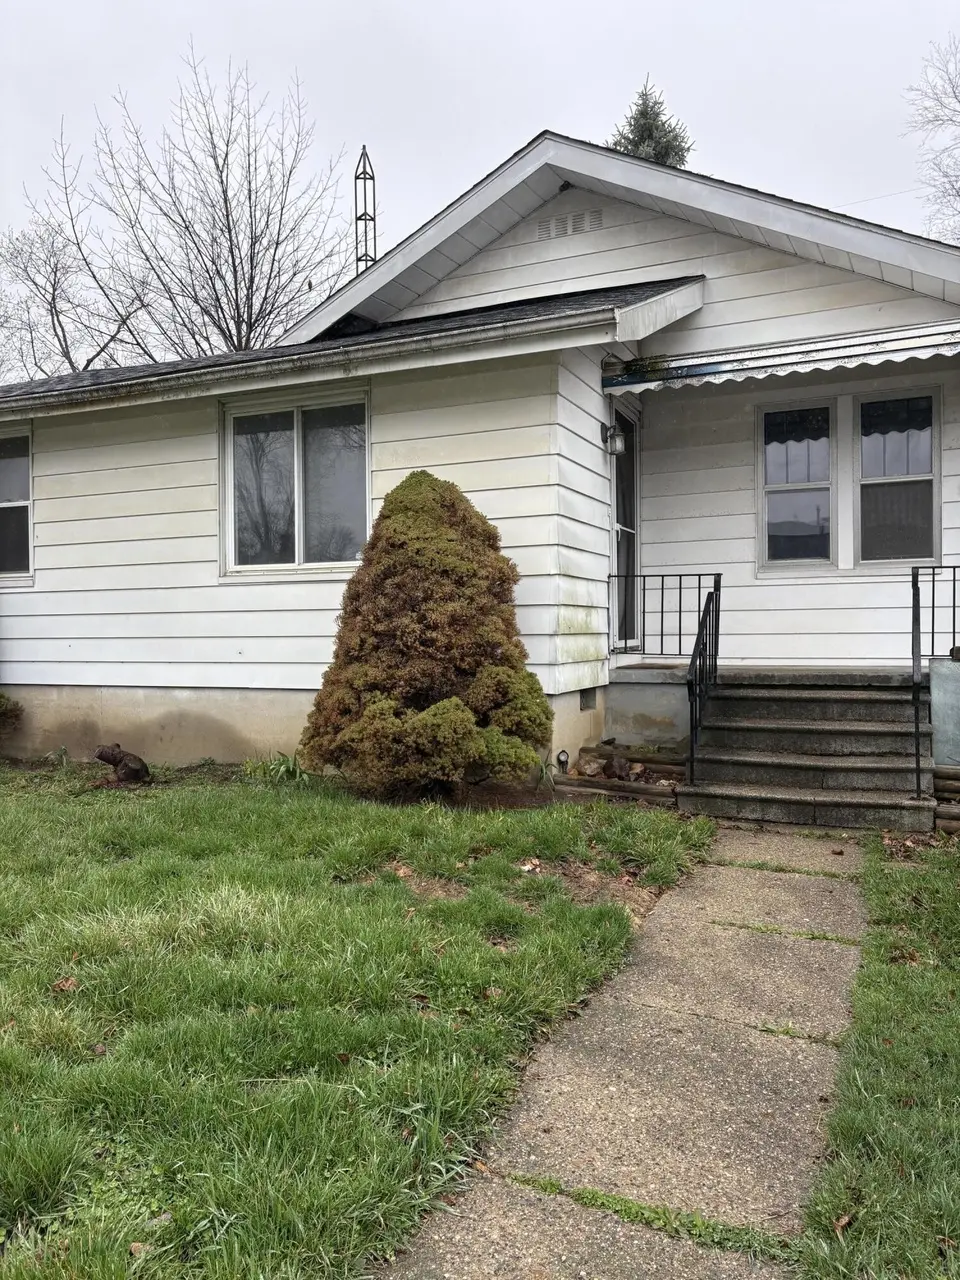
3290 Cheyenne Ave · Burton, MI
Flood risk 1/10 · Minimal
- FEMA flood zone
- X (unshaded)
- Chance of flooding over 30 yrs
- 0.0%
- Est. flood insurance / yr
- $473 – $860
Fire risk 1/10 · Minimal
- Est. fire insurance / yr
- $784 – $1,456
Heat risk 2/10 · Minimal
- Hot days now (above 96°F)
- 7 days/yr
- Hot days in 30 yrs
- 15 days/yr
Wind risk 2/10 · Minimal
- Chance of severe wind over 30 yrs
- —
Air-quality risk 3/10 · Minor
- Unhealthy air days now
- 3 days/yr
- Unhealthy air days in 30 yrs
- 4 days/yr
Risk factors via First Street. Map © Google.
Why this score? — see what drove the B grade
The composite is a weighted blend of 9 inputs, each scored 0–100. Each bar is that input's sub-score; the figure is the points it added to the 100-point composite (weight × sub-score).
- Cash flow +30.0/30.0
- ARV discount +13.4/15.0
- DSCR +10.0/10.0
- 1% rule +9.8/10.0
- Livability +3.1/5.0
- Rent growth +2.5/5.0
- Condition / age +2.5/5.0
- Schools +1.4/10.0
- Appreciation +0.0/10.0
$74,900
🖨 Deal sheet 📄 Offer letter ✓ Due diligence
Listing remarks MLS
Come see this fixer upper just needs a little T. L. C. and you could make it your home. You could also make it a rental or sell it. Come see what you think. It has been freshly painted.
Key facts
- 5,000 sq ft lot
- Garage
- Listed 66 days
Neighborhood map
What this means for you Summary
Snapshot
- This is a 3-bed/1.0-bath single-family listed at $75k.
Deal economics
- At list price, monthly cash flow is $356 ($4k/yr) — positive.
- The deal already cash-flows at list — no discount required.
- Meets the 1% rule at list price ($1k rent vs $75k).
- Recommended offer: $70k (6.0% below list) — sets the bar for market timing.
- Cap rate 12.0% vs local median 3.8% in Burton — top-decile yield for the area; either an underpriced asset or a hidden risk that comps aren't pricing in. Stress-test before assuming the spread holds.
Location & tenants
- Location reads 61/100 on livability (#555 in MI) — a middle-class / working-renter tenant base. Strengths: cost of living A+, housing A+; Watch: employment D, schools F, crime F.
- Bendle Public Schools (suburban): math 6% / reading 29% proficiency, ranked #487 of 540 in MI (top 90%) — low school quality limits family demand, transient renter base, plan for 1-2y turnover; 81% free/reduced lunch — lower-income household profile, screen leases tightly.
- Market conditions: 53 active listings in the ZIP; 4 comparable units currently listed for rent nearby; rentals lingering (median 44d on market — plan ~5-8 weeks vacancy on turnover, expect pricing pressure); 50% of comp listings sitting > 30 days — soft ceiling on asking rent; 419 units permitted in Genesee County in 2024 (68 in 5+ unit buildings).
Forward outlook
- Local home prices are declining (-3.0%/yr); year-one equity from $518 of loan paydown is wiped out by about $2k of value loss. Plan a longer hold.
- Genesee County population projected at -27% by 2050 — secular population decline; favor cash flow + early exit over multi-decade hold.
- At projected returns (-3.0% appreciation + 3.0% rent growth), your $21k cash investment doubles in ~6 years — after that, you're playing with house money.
Negotiation context
- It's been on market 66 days — a 6% lower offer ($70k) is reasonable based on typical stale-listing flexibility.
- 3 sale attempts since 29y ago; this cycle's ask has dropped $15k (17%) from the opening price — seller is motivated, your offer sets the floor, not the list.
Questions for the listing agent
- It's been on market 66 days. Have you received any prior offers? Is the seller open to a 6% concession, seller financing, or rate buy-down credit?
- Why hasn't it sold? Are there any deal-killer items the seller is aware of (foundation, flood, title, zoning, code violations)?
- Is there a deadline driving the sale (1031 exchange, divorce, estate, relocation)? That informs how much negotiation room exists.
- Schools are F-rated, which usually means shorter tenancies and higher turnover. Who's the typical renter profile here, and what's been the actual vacancy rate?
- Crime grade is F in this area — have there been break-ins, vandalism, or insurance claims at this property in the last 3 years? What carrier currently insures it and at what premium?
- What's the average days-on-market for RENTAL listings here right now (not sales)? A rising rental-DOM trend means longer vacancies and softer asking-rent achievability than the comps imply.
- What's the recent tenant-quality profile in this submarket — average credit score on applications, eviction rate, late-payment / NSF rate, and stable-employment percentage? A property-management company in the area should have these aggregated.
- How much new for-sale + rental construction is in the pipeline within 1–3 miles? Heavy new supply typically softens prices + rents 12–24 months out; constrained supply supports both.
Investment metrics
- 1% rule
- 1.48% ✓
- Cap rate
- 12.00%
- Cash-on-cash
- 20.40%
- DSCR
- 1.91
- GRM
- 5.6
CMA / ARV
- ARV (median comp)
- $86,302
- List price
- $74,900
- Delta
- -13.21%
- Verdict
- UNDERPRICED
- Comps
- 20 within 1.0 mi
Show comp detail 12 sales within ~0.75 mi
| Address | Dist | Beds/Ba | Sqft | Sold | Price | $/sf | Match |
|---|---|---|---|---|---|---|---|
| 1030 Mckeighan Ave | 0.18mi | 3/1.5 | 1,049 (+5%) | 2mo | $50,000 | $48 | 79 |
| 802 McKeighan Ave | 0.24mi | 3/1.0 | 1,056 (+6%) | 3mo | $95,900 | $91 | 76 |
| 3343 Cheyenne Ave | 0.11mi | 2/2.0 (-1) | 906 (-9%) | 6mo | $114,000 | $126 | 66 |
| 3508 Fern Ave | 0.56mi | 3/1.0 | 1,060 (+6%) | 0mo | $132,000 | $125 | 63 |
| 630 Buckingham Ave Ave | 0.57mi | 3/1.0 | 936 (-6%) | 1mo | $89,999 | $96 | 62 |
| 2371 E Parkwood Ave | 0.65mi | 3/1.0 | 1,032 (+3%) | 2mo | $149,000 | $144 | 62 |
| 2365 E Bergin Ave | 0.57mi | 3/1.0 | 1,008 (+1%) | 13mo | $107,000 | $106 | 61 |
| 3037 Shaw St | 0.54mi | 2/1.0 (-1) | 982 (-2%) | 10mo | $94,900 | $97 | 59 |
| 4402 Red Arrow Rd | 0.59mi | 3/1.0 | 946 (-5%) | 10mo | $85,000 | $90 | 55 |
| 601 Buckingham Ave | 0.63mi | 2/1.0 (-1) | 942 (-6%) | 9mo | $45,000 | $48 | 49 |
| 3705 Cherokee Ave | 0.61mi | 3/1.0 | 1,092 (+9%) | 10mo | $72,500 | $66 | 48 |
| 2368 E Boatfield Ave | 0.58mi | 2/1.0 (-1) | 864 (-13%) | 12mo | $95,900 | $111 | 36 |
Match score weights: distance 35% · size 25% · config 20% · recency 20%. Top-matched comps best support the ARV.
Projected returns pro-forma
-3.0% appreciation · 3.0% rent growth · sell at horizon
- IRR
- 12.7%
- Equity multiple
- 1.50×
- Total profit
- $10,582
- Equity at exit
- $11,168
- IRR
- 21.6%
- Equity multiple
- 2.84×
- Total profit
- $38,515
- Equity at exit
- $6,476
Cash invested: $20,972 (down + closing). Projections, not guarantees.
Landlord ↔ Tenant lean methodology
- Overall (STATE)
- 62 Landlord-Friendly
- State Michigan
- 62 Landlord-Friendly · EVEN
- County
- — inherits STATE
- City
- — inherits STATE
ZIP-level market 48529
- Home prices YoY
- -26.5%
- Active inventory
- 53
- Price-to-rent
- 5.6×
Monthly cashflow live
- Estimated rent
- $1,106 medium interval (Pro) →
- Mortgage (P&I)
- −$393
- Tax est. 1.5%
- −$94 /mo · $1,124/yr
- Insurance
- −$31
- HOA
- −$0
- Vacancy / Maint / Mgmt
- −$232
- Net cashflow
- $356
Break-even live
UW: 25.0% down · 7.5% · 30yr · 1.5% tax · 5.0% vac · 8.0% maint · 8.0% mgmt
Financing live
Cash to close
- Down payment
- $18,725
- Closing costs
- $2,247
- Reserves months
- —
- Total cash needed
- —
Loan-product check · same deal, 3 products live
Conventional
25% down · 7.5% · 30yr
- Down + closing
- —
- Monthly P&I
- —
- Monthly cashflow
- —
- DSCR
- —
- Eligible?
- —
Personal DTI + credit; lowest rate.
DSCR
20% down · 8.5% · 30yr
- Down + closing
- —
- Monthly P&I
- —
- Monthly cashflow
- —
- DSCR
- —
- Eligible?
- —
No personal income docs; deal must DSCR.
Hard money
10% down · 12.0% · 12mo
- Down + closing
- —
- Monthly P&I
- —
- Monthly cashflow
- —
- DSCR
- —
- Eligible?
- —
Short-term bridge; refi at stabilization.
Rent comps 4 comps
| Address | Beds | Baths | Sqft | Rent | $/sqft | DOM | Units | Dist |
|---|---|---|---|---|---|---|---|---|
| 1034 McKeighan Ave Flint, MI | 3.0 | 1.0 | 1040 | $1,250 | $1.20 | 20d | 1 | 0.19mi |
| 3291 Glengary St Burton, MI | 2.0 | 1.0 | 972 | $1,075 | $1.11 | 43d | 1 | 0.29mi |
| 2266 Donovan St Burton, MI | 2.0 | 1.0 | 700 | $800 | $1.14 | 13d | 1 | 0.46mi |
| 132 Pine Blf Flint, MI | 3.0 | 2.0 | 960 | $953 | $0.99 | 43d | 1 | 1.11mi |
Listing history 26 events
-
2026-06-18days on market $74,900 Active 66 DOM
-
2026-06-17days on market $74,900 Active 65 DOM
-
2026-06-16days on market $74,900 Active 64 DOM
-
2026-06-15days on market $74,900 Active 63 DOM
-
2026-06-14days on market $74,900 Active 61 DOM
-
2026-06-13days on market $74,900 Active 60 DOM
-
2026-06-10days on market $74,900 Active 58 DOM
-
2026-06-09days on market $74,900 Active 57 DOM
-
2026-06-08days on market $74,900 Active 56 DOM
-
2026-06-07days on market $74,900 Active 55 DOM
-
2026-06-05days on market $74,900 Active 52 DOM
-
2026-06-03days on market $74,900 Active 51 DOM
-
2026-06-03price $74,900 Active 50 DOM
-
2026-06-02days on market $79,900 Active 50 DOM
-
2026-06-01days on market $79,900 Active 49 DOM
-
2026-05-31days on market $79,900 Active 48 DOM
-
2026-05-30days on market $79,900 Active 47 DOM
-
2026-05-11price $79,900 185-char remark
Show marketing remark (185 chars)
Come see this fixer upper just needs a little T. L. C. and you could make it your home. You could also make it a rental or sell it. Come see what you think. It has been freshly painted.
-
2026-04-25price $84,900 185-char remark
Show marketing remark (185 chars)
Come see this fixer upper just needs a little T. L. C. and you could make it your home. You could also make it a rental or sell it. Come see what you think. It has been freshly painted.
-
2026-04-13$89,900 Active 185-char remark
Show marketing remark (185 chars)
Come see this fixer upper just needs a little T. L. C. and you could make it your home. You could also make it a rental or sell it. Come see what you think. It has been freshly painted.
-
2023-08-02soldstatus $85,000
-
1997-12-12soldstatus $53,350 187-char remark
Show marketing remark (187 chars)
Newer Windows In Part Of House, Quiet Neighborhood, Hardwood Floors Under Carpet, Land Contract Due On Sale, Taxes To Be Included In Pymt, Seller Limits, Fha/Va Conditions To $200. -20mls
-
1997-12-12soldstatus $53,350
Show marketing remark (187 chars)
Newer Windows In Part Of House, Quiet Neighborhood, Hardwood Floors Under Carpet, Land Contract Due On Sale, Taxes To Be Included In Pymt, Seller Limits, Fha/Va Conditions To $200. -20mls
-
1997-12-08historical
-
1997-11-19$54,900 187-char remark
Show marketing remark (187 chars)
Newer Windows In Part Of House, Quiet Neighborhood, Hardwood Floors Under Carpet, Land Contract Due On Sale, Taxes To Be Included In Pymt, Seller Limits, Fha/Va Conditions To $200. -20mls
-
1997-11-19$54,900
Show marketing remark (187 chars)
Newer Windows In Part Of House, Quiet Neighborhood, Hardwood Floors Under Carpet, Land Contract Due On Sale, Taxes To Be Included In Pymt, Seller Limits, Fha/Va Conditions To $200. -20mls
ⓘ Source: listings_history table (triggers on properties + properties_extension) + one-shot
backfill from property_details.listing_events for pre-trigger history.
Climate risk First Street
- Flood 1/10 Low FEMA zone X (unshaded) · 0% chance over 30 yrs
- Wildfire 1/10 Low
- Heat 2/10 Low 7 d/yr ≥96°F today · 15 d/yr by 30 yrs out
- Wind 2/10 Low
- Air quality 3/10 Moderate 3 unhealthy d/yr today · 4 by 30 yrs out
Nearby sold comps map
Loading sold comps map…
Walkable amenities ~0.75 mi
Loading nearby amenities…
Taxation est. · year 1
- Rental income
- $13,277
- − Mortgage interest
- −$4,196
- − Property taxes
- −$1,124
- − Insurance
- −$374
- − Repairs & maintenance
- −$1,062
- − Management
- −$1,062
- − Depreciation
- −$2,179
- Taxable income
- $3,280
- Est. tax owed @ 24.0%
- −$787
- After-tax cash flow
- $3,490/yr
For passive investors: Depreciation is non-cash, so a rental often shows a tax loss while cash-flowing — sheltering income. Rental losses are passive: they offset passive income freely, and up to $25,000/yr can offset ordinary (W-2) income if you actively participate and your MAGI is under $100k (phasing out to $0 by $150k); unused losses carry forward. On sale, claimed depreciation is recaptured at up to 25%, and gains may owe capital-gains tax (a 1031 exchange can defer both). Figures are a year-1 estimate at your 24.0% rate — not tax advice; consult a CPA.
Schools (NCES district)
- District
- Bendle Public Schools
- NCES district ID
- 2604740
- Math proficiency
- 6% ▼ -7.00%
- Reading proficiency
- 29% ▼ -1.00%
- Median HH income
- $35,492
- Composite
- 14.36/100
- National rank
- #9438
- State rank
- #487 of 540 in MI
Livability — Burton
- Score
- 61/100
- State rank
- #555
- US rank
- #17380
Category grades
Schools grade is shown separately in the Schools card above.
Census & demographics
- Census place
- Burton, MI
- City population
- 26,014
- Population (ZIP)
- 8,959
Population outlook (Genesee County) Hauer SSP2
- Today (2025)
- 381,312 people
- By 2030
- 362,731 · -4.9%
- By 2040
- 321,550 · -15.7%
- By 2050
- 279,212 · -26.8%
- By 2075
- 193,336 · -49.3%
- By 2100
- 128,118 · -66.4%
Race, ethnicity, and origin ACS 2023
- Neighborhood character
- Predominantly White (82%)
- Race & ethnicity
- White 82% Black 9% Hispanic / Latino 6% Two or more races 4%
- Hispanic origin (detail)
- Mexican 6%
- Common ancestry
- Romanian 6% Lithuanian 4% Slovak 4%
- Foreign-born
- 1% · Canada
- Languages at home
- 99% English-only · Spanish 1%
Political lean MEDSL · Genesee
- 2024 margin
- Toss-up / Even · D 51.4% · R 47.2% · Other 1.4%
- 2008→2024 swing
- -28.3pp toward R · 2008: 32.5pp · 2024: 4.2pp
- All cycles
- 2024: D+4.2 2020: D+9.3 2016: D+9.5 2012: D+28.2 2008: D+32.5
Not yet ingested
- Civics
- —
Market trends
- HPI YoY
- ▼ -82.30%
- Current HPI
- 228.5338
- Rent YoY
- —
- Metro
- —
- State GDP YoY
- ▲ 1.37%
- F500 in state
- 28
Industry mix (Fortune 500 HQ in MI)
| Industry | F500 HQs | Revenue |
|---|---|---|
| Automotive Parts | 3 | $48B |
|
||
| Automotive | 2 | $372B |
|
||
| Chemicals | 1 | $45B |
|
||
| Automotive Retail | 1 | $29B |
|
||
| Healthcare / Medical Devices | 1 | $23B |
|
||
| Automotive Technology | 1 | $20B |
|
||
Price history
+45.5% since first listed9 events — show timeline
- 2026-05-11 Price Changed $79,900 WWMLS
- 2026-04-25 Price Changed $84,900 WWMLS
- 2026-04-13 Listed $89,900 WWMLS
- 2023-08-02 Sold (Public Records) $85,000 Public Records
- 1997-12-12 Sold (MLS) $53,350 MiRealSource-MiMLS
- 1997-12-12 Sold (MLS) $53,350 REALCOMP
- 1997-12-08 Listing Removed — MiRealSource-MiMLS
- 1997-11-19 Listed $54,900 MiRealSource-MiMLS
- 1997-11-19 Listed $54,900 REALCOMP
Property tax history
+11.2%/yrLatest (2025): $3,921 · +39.7% YoY. Source: county tax records.
Cash-flow waterfall
monthlySold comps — $/sqft
last 12 mo · ≤1 miLoading sold comps…