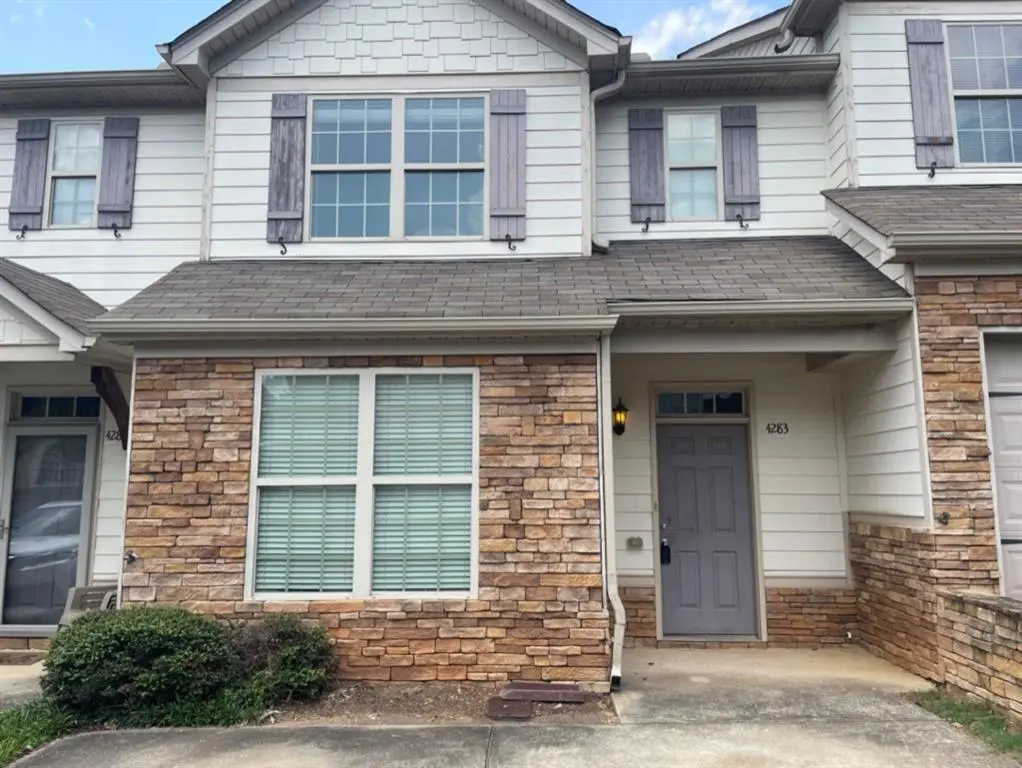
4283 High Park Ln #10 · East Point, GA
Flood risk 1/10 · Minimal
- FEMA flood zone
- X (unshaded)
- Chance of flooding over 30 yrs
- 0.0%
- Est. flood insurance / yr
- $507 – $1,088
Fire risk 1/10 · Minimal
- Est. fire insurance / yr
- $963 – $1,789
Heat risk 6/10 · Moderate
- Hot days now (above 103°F)
- 7 days/yr
- Hot days in 30 yrs
- 19 days/yr
Wind risk 5/10 · Moderate
- Chance of severe wind over 30 yrs
- 26.0%
Air-quality risk 4/10 · Minor
- Unhealthy air days now
- 4 days/yr
- Unhealthy air days in 30 yrs
- 6 days/yr
Risk factors via First Street. Map © Google.
Why this score? — see what drove the C- grade
The composite is a weighted blend of 9 inputs, each scored 0–100. Each bar is that input's sub-score; the figure is the points it added to the 100-point composite (weight × sub-score).
- Cash flow +19.1/30.0
- ARV discount +7.5/15.0
- 1% rule +6.6/10.0
- DSCR +6.0/10.0
- Schools +4.5/10.0
- Livability +3.6/5.0
- Rent growth +2.8/5.0
- Condition / age +2.5/5.0
- Appreciation +0.0/10.0
$165,000
🖨 Deal sheet 📄 Offer letter ✓ Due diligence
Listing remarks MLS
Discover exceptional value with this spacious townhouse in East Point. This well-maintained 4-bedroom, 3-bath home combines comfortable living with smart investment potential. Bright, open living spaces and a versatile floorplan provide room for everyone, while the convenient location offers effortless access to I-285 and downtown Atlanta - perfect for commuters, professionals. Property Highlights Open-concept main living area with abundant natural light. Functional kitchen with ample cabinet and counter space Primary suite with private bath; additional bedrooms, home office laundry located on 2nd for added convenience Location & convenience Easy access to I-285 and major highways for quick commutes Short drive to downtown Atlanta, Hartsfield-Jackson Atlanta International Airport, and major employment centers Close to shopping, dining, parks, and public transit options Neighborhood that still offers city accessibility Investment appeal Excellent rental history with consistent demand in the East Point market Strong cash-flow potential for investors or a turnkey rental for new owners Great opportunity for value-add updates to increase rental income and resale value Why this home This townhouse offers the rare combination of comfortable, flexible living space and a strategic location near Atlanta's core. Whether you're a first-time buyer seeking a roomy home in a commuter-friendly neighborhood or an investor looking to expand a rental portfolio, this property delivers immediate utility and long-term upside.
Key facts
- Functional kitchen
- Easy access to i-285
- Spacious townhouse
Tags
Property features AI
Finance
- HOA & community: Annual association fee of $3,000; Community has 178 units; Has association
Exterior
- Parking: Driveway; Open parking available
- Utilities: Public water; Public sewer; Cable available; Water available; Sewer available
- Home design: Two levels; Condominium; Resale property
- Construction: Aluminum siding; Wood siding; Shingle roof; Slab foundation; Built as part of a condominium community
- Exterior features: Paved road frontage; County road access
Interior
- Kitchen: Breakfast bar; Dishwasher; Gas range; Microwave; Refrigerator; Disposal
- Bedrooms: One main-level bedroom; Three upper-level bedrooms; No special bedroom features listed
- Flooring: Carpet; Vinyl
- Bathrooms: Three full bathrooms; One main-level bathroom; Two full upper-level bathrooms; Master bath with tub/shower combo
- Heating & cooling: Central heating; Central air conditioning
- Interior features: 2+ common walls; Attic
- Laundry & utility: Washer included; Laundry on main level
Neighborhood map
What this means for you Summary
Snapshot
- This is a 4-bed/3.0-bath condo listed at $165k.
Deal economics
- At list price, monthly cash flow is $174 ($2k/yr) — positive.
- The deal already cash-flows at list — no discount required.
- Meets the 1% rule at list price ($2k rent vs $165k).
- Recommended offer: $163k (1.5% below list) — sets the bar for market timing.
- Cap rate 7.6% vs local median 5.1% in East Point — top-decile yield for the area; either an underpriced asset or a hidden risk that comps aren't pricing in. Stress-test before assuming the spread holds.
Location & tenants
- Location reads 72/100 on livability (#72 in GA) — a middle-class / working-renter tenant base. Strengths: commute A+, cost of living A+, housing A+; Watch: employment D+, crime F, amenities F.
- Fulton County (suburban): math 49% / reading 53% proficiency, ranked #12 of 174 in GA (top 7%) — acceptable for families but not a draw, mixed tenant base, ~2y average lease.
- Zoned schools: Brookview Elementary School (math 10% / reading 10%, grade F, #1,076 of 1,228 statewide, top 89%, 416 students, 100% FRL); Tri-Cities High School (math 5% / reading 30%, grade F, #264 of 424 statewide, top 63%, 1,483 students, 100% FRL) — zoned schools average 100% FRL vs 41% district-wide (59 pts higher); higher-poverty schools than district average — tighter screening recommended.
- Zoned-school proficiency averages 14% at this address vs 51% district-wide (-37 pts) — the specific schools serving this property underperform the Fulton County average; the district grade overstates school quality for this exact location.
- Market conditions: Rents rising (+1.4%/yr); 283 active listings in the ZIP; 40 comparable units currently listed for rent nearby; rentals at typical pace (median 24d on market — plan ~3-4 weeks tenant-placement turnaround); 11,565 units permitted in Fulton County in 2024 (8,159 in 5+ unit buildings).
- This rent runs 34% of the median local income ($68k/yr) — at the standard rent-burdened threshold; future hikes will face affordability resistance.
Forward outlook
- Local home prices are declining (-3.0%/yr); year-one equity from $1k of loan paydown is wiped out by about $5k of value loss. Plan a longer hold.
- Fulton County population projected at +38% by 2050 — long-run rental-demand tailwind backs the buy-and-hold thesis.
Negotiation context
- It's been on market 17 days — a 2% lower offer ($163k) is reasonable based on typical stale-listing flexibility.
- 4 sale attempts since 5y ago with the ask held roughly flat each time — persistent listings suggest the price (not the market) is what's stuck; bring a comps-based counter.
Risks & watch-outs
- Climate carrying-cost: moderate wind risk, 26% chance of damaging wind over 30y; extreme-heat days projected 7→19/yr by 2055 (HVAC capex compounding) — expect insurance premiums to compound above CPI over the hold.
Questions for the listing agent
- What does the HOA fee cover, when was the last increase, and are there any pending special assessments or reserve-fund shortfalls?
- Any open or pending special assessments — roof, HVAC, plumbing, elevator, façade? What's the per-unit balance and payoff schedule, and is the seller paying it off at close or rolling it to the buyer?
- Is there a deadline driving the sale (1031 exchange, divorce, estate, relocation)? That informs how much negotiation room exists.
- Schools are F-rated, which usually means shorter tenancies and higher turnover. Who's the typical renter profile here, and what's been the actual vacancy rate?
- Crime grade is F in this area — have there been break-ins, vandalism, or insurance claims at this property in the last 3 years? What carrier currently insures it and at what premium?
- What's the average days-on-market for RENTAL listings here right now (not sales)? A rising rental-DOM trend means longer vacancies and softer asking-rent achievability than the comps imply.
- What's the recent tenant-quality profile in this submarket — average credit score on applications, eviction rate, late-payment / NSF rate, and stable-employment percentage? A property-management company in the area should have these aggregated.
- How much new apartment / multifamily construction is in the pipeline within 1–3 miles? Heavy new supply (>2% of stock underway) typically softens rents 12–24 months out; light construction supports rent growth.
Investment metrics
- 1% rule
- 1.16% ✓
- Cap rate
- 7.56%
- Cash-on-cash
- 4.51%
- DSCR
- 1.20
- GRM
- 7.2
CMA / ARV
No comps found within radius.
Projected returns pro-forma
-3.0% appreciation · 1.35% rent growth · sell at horizon
- IRR
- -11.3%
- Equity multiple
- 0.60×
- Total profit
- $-18,656
- Equity at exit
- $24,602
- IRR
- -5.0%
- Equity multiple
- 0.70×
- Total profit
- $-13,830
- Equity at exit
- $14,266
Cash invested: $46,200 (down + closing). Projections, not guarantees.
Landlord ↔ Tenant lean methodology
- Overall (STATE)
- 90 Strongly Landlord-Friendly
- State Georgia
- 90 Strongly Landlord-Friendly · R+3
- County
- — inherits STATE
- City
- — inherits STATE
ZIP-level market 30344
- Home prices YoY
- -31.0%
- Rents YoY
- 1.4%
- Active inventory
- 283
- Price-to-rent
- 7.2×
Monthly cashflow live
- Estimated rent
- $1,922 high interval (Pro) →
- Mortgage (P&I)
- −$865
- Tax from tax record
- −$160 /mo · $1,926/yr
- Insurance
- −$69
- HOA
- −$250
- Vacancy / Maint / Mgmt
- −$404
- Net cashflow
- $174
Break-even live
UW: 25.0% down · 7.5% · 30yr · 1.5% tax · 5.0% vac · 8.0% maint · 8.0% mgmt
Financing live
Cash to close
- Down payment
- $41,250
- Closing costs
- $4,950
- Reserves months
- —
- Total cash needed
- —
Loan-product check · same deal, 3 products live
Conventional
25% down · 7.5% · 30yr
- Down + closing
- —
- Monthly P&I
- —
- Monthly cashflow
- —
- DSCR
- —
- Eligible?
- —
Personal DTI + credit; lowest rate.
DSCR
20% down · 8.5% · 30yr
- Down + closing
- —
- Monthly P&I
- —
- Monthly cashflow
- —
- DSCR
- —
- Eligible?
- —
No personal income docs; deal must DSCR.
Hard money
10% down · 12.0% · 12mo
- Down + closing
- —
- Monthly P&I
- —
- Monthly cashflow
- —
- DSCR
- —
- Eligible?
- —
Short-term bridge; refi at stabilization.
Rent comps 40 comps
| Address | Beds | Baths | Sqft | Rent | $/sqft | DOM | Units | Dist |
|---|---|---|---|---|---|---|---|---|
| 509 Highwood Ln Atlanta, GA | 3.0 | 2.5 | 1166 | $1,800 | $1.54 | 5d | 1 | 0.02mi |
| 511 Highwood Ln Atlanta, GA | 3.0 | 2.5 | 1198 | $1,449 | $1.21 | 24d | 1 | 0.02mi |
| 511 Highwood Ln Atlanta, GA | 3.0 | 2.5 | 1198 | $1,449 | $1.21 | 43d | 1 | 0.02mi |
| 1410 Canopy Dr Unit 1 East Point, GA | 3.0 | 2.5 | 1600 | $1,600 | $1.00 | 12d | 1 | 0.04mi |
| 1414 Canopy Dr Unit 1 East Point, GA | 3.0 | 2.5 | 1660 | $3,000 | $1.81 | 24d | 1 | 0.04mi |
| 4249 High Park Ln Atlanta, GA | 3.0 | 2.5 | 1504 | $1,650 | $1.10 | 5d | 1 | 0.06mi |
| — Atlanta, GA | 3.0 | 2.5 | 1498 | $1,750 | $1.17 | 18d | 1 | 0.07mi |
| 806 Highwood Ln Atlanta, GA | 3.0 | 2.5 | 1166 | $1,700 | $1.46 | 43d | 1 | 0.07mi |
| 1110 Highwood Ln Atlanta, GA | 3.0 | 2.5 | 1166 | $1,940 | $1.66 | 24d | 1 | 0.07mi |
| 4401 Stone Gate Way Atlanta, GA | 3.0 | 2.5 | 1498 | $1,750 | $1.17 | 16d | 1 | 0.09mi |
| 4394 Stone Gate Way East Point, GA | 3.0 | 2.5 | 1485 | $1,645 | $1.11 | 24d | 1 | 0.11mi |
| 4031 7 Oaks Ln SW East Point, GA | 2.0–3.0 | 1.0–2.0 | 1184 | $1,265 | $1.07 | 5d | 1 | 0.21mi |
| 4001 Lakemont Dr Atlanta, GA | 1.0–3.0 | 1.0–2.5 | 1165 | $1,489 | $1.28 | 1d | 28 | 0.43mi |
| 5618 Laurel Ridge Dr East Point, GA | 4.0 | 2.5 | 2100 | $4,500 | $2.14 | 24d | 1 | 0.47mi |
| 2802 Laurel Ridge Cir Atlanta, GA | 4.0 | 3.5 | 1992 | $2,300 | $1.15 | 5d | 1 | 0.47mi |
| 2778 Laurel Ridge Cir Atlanta, GA | 3.0 | 2.5 | 1436 | $1,900 | $1.32 | 43d | 1 | 0.48mi |
| 2776 Laurel Ridge Cir Atlanta, GA | 3.0 | 2.5 | 1436 | $1,900 | $1.32 | 5d | 1 | 0.48mi |
| 2826 Laurel Ridge Cir Atlanta, GA | 3.0 | 2.5 | 1492 | $1,900 | $1.27 | 10d | 1 | 0.50mi |
| 2832 Laurel Ridge Cir Atlanta, GA | 3.0 | 2.5 | 1492 | $1,800 | $1.21 | 43d | 1 | 0.51mi |
| 4395 Washington Rd Atlanta, GA | 1.0–3.0 | 1.0–2.5 | 959 | $1,502 | $1.57 | 43d | 9 | 0.56mi |
| 2900 Laurel Ridge Way East Point, GA | 1.0–3.0 | 1.0–2.0 | 1028 | $1,662 | $1.62 | 10d | 9 | 0.59mi |
| 2797 Aralynn Way Atlanta, GA | 4.0 | 2.5 | 2100 | $3,000 | $1.43 | 43d | 1 | 0.62mi |
| 3200 Desert Dr Atlanta, GA | 3.0 | 1.0–2.5 | 977 | $1,630 | $1.67 | 1d | 15 | 0.63mi |
| 4007 Garden Ln Atlanta, GA | 3.0 | 2.5 | 2000 | $2,900 | $1.45 | 43d | 1 | 0.70mi |
| 2759 Aralynn Way Atlanta, GA | 4.0 | 2.5 | 2067 | $2,500 | $1.21 | 24d | 1 | 0.74mi |
| 3222 Kenelworth Dr Atlanta, GA | 2.0–3.0 | 1.5–2.5 | 1062 | $1,550 | $1.46 | 20d | 23 | 0.81mi |
| 4165 Williamsburg Dr Atlanta, GA | 4.0 | 3.0 | 1737 | $2,000 | $1.15 | 43d | 1 | 0.98mi |
| 2609 Charlestown Dr Atlanta, GA | 2.0–3.0 | 1.5–2.5 | 1360 | $1,675 | $1.23 | 1d | 23 | 1.04mi |
| 4609 Hopewell Rd Atlanta, GA | 3.0 | 2.0 | 1563 | $2,200 | $1.41 | 43d | 1 | 1.23mi |
| 4709 Tradition Pkwy #2 Atlanta, GA | 4.0 | 2.5 | 1868 | $2,200 | $1.18 | 43d | 1 | 1.27mi |
| 4680 Parkway Cir Atlanta, GA | 3.0 | 2.5 | 1200 | $2,100 | $1.75 | 22d | 1 | 1.30mi |
| 4209 Legacy Sq Atlanta, GA | 3.0 | 2.5 | 1520 | $1,750 | $1.15 | 43d | 1 | 1.32mi |
| 4761 Highpoint Way #139 Atlanta, GA | 3.0 | 2.5 | 1670 | $2,500 | $1.50 | 5d | 1 | 1.32mi |
| 3730 Will Lee Rd Atlanta, GA | 3.0 | 2.0 | 1462 | $1,939 | $1.33 | 5d | 1 | 1.33mi |
| 3361 The Way Pl Atlanta, GA | 3.0 | 2.5 | 1968 | $3,500 | $1.78 | 43d | 1 | 1.33mi |
| 3369 The Way Pl Atlanta, GA | 3.0 | 2.5 | 1830 | $2,395 | $1.31 | 43d | 1 | 1.34mi |
| 3740 Will Lee Rd Atlanta, GA | 3.0 | 2.0 | 1542 | $2,010 | $1.30 | 18d | 1 | 1.34mi |
| 4779 Highpoint Way College Park, GA | 4.0 | 2.5 | 1950 | $2,201 | $1.13 | 5d | 1 | 1.35mi |
| 4683 Highpoint Way Atlanta, GA | 3.0 | 2.5 | 1575 | $1,885 | $1.20 | 24d | 1 | 1.36mi |
| 2601 Roosevelt Hwy Atlanta, GA | 3.0 | 1.0–2.5 | 1000 | $1,550 | $1.55 | 1d | 9 | 1.36mi |
HOA detail condo
- Monthly dues
- $250 · $3,000/yr
- Assessments
- None detected in remarks — confirm with the listing agent.
Listing history 12 events
-
2026-06-18days on market $165,000 Active 17 DOM
-
2026-06-17days on market $165,000 Active 16 DOM
-
2026-06-16days on market $165,000 Active 15 DOM
-
2026-06-15days on market $165,000 Active 14 DOM
-
2026-06-13days on market $165,000 Active 12 DOM
-
2026-06-09days on market $165,000 Active 8 DOM
-
2026-06-08days on market $165,000 Active 7 DOM
-
2026-06-07days on market $165,000 Active 6 DOM
-
2026-06-04days on market $165,000 Active 3 DOM
-
2026-06-03days on market $165,000 Active 2 DOM
-
2026-06-02remarks 689-char remark
-
2026-06-02$165,000 Active 1 DOM
ⓘ Source: listings_history table (triggers on properties + properties_extension) + one-shot
backfill from property_details.listing_events for pre-trigger history.
Tax reassessment forecast GA · Resets to sale price
- Current annual tax
- $1,926 · $160/mo
- Projected year-2 tax
- $1,926 · $160/mo
- Expected delta
- $0/yr ($0/mo · 0.0%)
ⓘ Screening estimate from a state-policy table — verify with the county assessor before closing.
Climate risk First Street
- Flood 1/10 Low FEMA zone X (unshaded) · 0% chance over 30 yrs
- Wildfire 1/10 Low
- Heat 6/10 Major 7 d/yr ≥103°F today · 19 d/yr by 30 yrs out
- Wind 5/10 Major 26% chance of damaging wind over 30 yrs
- Air quality 4/10 Moderate 4 unhealthy d/yr today · 6 by 30 yrs out
Nearby sold comps map
Loading sold comps map…
Walkable amenities ~0.75 mi
Loading nearby amenities…
Taxation est. · year 1
- Rental income
- $23,062
- − Mortgage interest
- −$9,243
- − Property taxes
- −$1,926
- − Insurance
- −$825
- − Repairs & maintenance
- −$1,845
- − Management
- −$1,845
- − HOA
- −$3,000
- − Depreciation
- −$4,800
- Taxable loss
- −$421
- Est. tax savings @ 24.0%
- +$101
- After-tax cash flow
- $2,186/yr
For passive investors: Depreciation is non-cash, so a rental often shows a tax loss while cash-flowing — sheltering income. Rental losses are passive: they offset passive income freely, and up to $25,000/yr can offset ordinary (W-2) income if you actively participate and your MAGI is under $100k (phasing out to $0 by $150k); unused losses carry forward. On sale, claimed depreciation is recaptured at up to 25%, and gains may owe capital-gains tax (a 1031 exchange can defer both). Figures are a year-1 estimate at your 24.0% rate — not tax advice; consult a CPA.
Schools (NCES district)
- District
- Fulton County
- NCES district ID
- 1302280
- Math proficiency
- 49% ▼ -2.00%
- Reading proficiency
- 53% ▬ 0.00%
- Median HH income
- $68,035
- Composite
- 45.33/100
- National rank
- #2640
- State rank
- #12 of 174 in GA
Livability — East Point
- Score
- 72/100
- State rank
- #72
- US rank
- #6314
Category grades
Schools grade is shown separately in the Schools card above.
Census & demographics
- Census place
- East Point, GA
- County
- Fulton County · 1,094,430 people
- City population
- 35,456
- Metro
- Atlanta-Sandy Springs-Alpharetta, GA
- Population (ZIP)
- 35,456
- Household income
- $68,380
- Rent vs Own
- Severe rent burden
- 2226.0
Population outlook (Fulton County) Hauer SSP2
- Today (2025)
- 1,203,707 people
- By 2030
- 1,299,706 · +8.0%
- By 2040
- 1,488,256 · +23.6%
- By 2050
- 1,664,580 · +38.3%
- By 2075
- 2,036,072 · +69.2%
- By 2100
- 2,222,402 · +84.6%
Race, ethnicity, and origin ACS 2023
- Neighborhood character
- Predominantly Black (74%)
- Race & ethnicity
- Black 74% White 11% Hispanic / Latino 11% Two or more races 6%
- Hispanic origin (detail)
- Mexican 7% Puerto Rican 1%
- Common ancestry
- Italian 1% Swiss 1% Russian 1%
- Foreign-born
- 6% · Canada, Jamaica
- Languages at home
- 87% English-only · Spanish 9% Other Indo-European 1% German/W. Germanic 1%
Political lean MEDSL · Fulton
- 2024 margin
- Solid D (+44.9) · D 71.9% · R 27.0% · Other 1.1%
- 2008→2024 swing
- +9.8pp toward D · 2008: 35.0pp · 2024: 44.9pp
- All cycles
- 2024: D+44.9 2020: D+46.4 2016: D+42.1 2012: D+29.6 2008: D+35.0
Not yet ingested
- Civics
- —
Market trends
- HPI YoY
- ▼ -113.15%
- Current HPI
- 251.7916
- Rent YoY
- ▲ 1.35%
- Metro
- Atlanta-Sandy Springs-Alpharetta, GA
- State GDP YoY
- ▲ 2.66%
- F500 in state
- 28
Industry mix (Fortune 500 HQ in GA)
| Industry | F500 HQs | Revenue |
|---|---|---|
| Paper / Packaging | 2 | $29B |
|
||
| Retail | 1 | $160B |
|
||
| Transportation / Logistics | 1 | $91B |
|
||
| Airlines | 1 | $62B |
|
||
| Consumer Goods | 1 | $47B |
|
||
| Utilities | 1 | $25B |
|
||
Price history
+10.0% since first listed10 events — show timeline
- 2026-06-01 Listed $165,000 FMLS
- 2026-06-01 Listed $165,000 GAMLS
- 2023-07-25 Rental Removed — APPFOLIO
- 2021-08-16 Sold (Public Records) $170,000 Public Records
- 2021-08-09 Sold (MLS) $170,000 GAMLS
- 2021-08-09 Sold (MLS) $170,000 FMLS
- 2021-07-24 Pending — GAMLS
- 2021-07-24 Pending — FMLS
- 2021-07-22 Listed $150,000 GAMLS
- 2021-07-22 Listed $150,000 FMLS
Property tax history
+2.2%/yrLatest (2025): $1,926 · +1.8% YoY. Source: county tax records.
Cash-flow waterfall
monthlySold comps — $/sqft
last 12 mo · ≤1 miLoading sold comps…