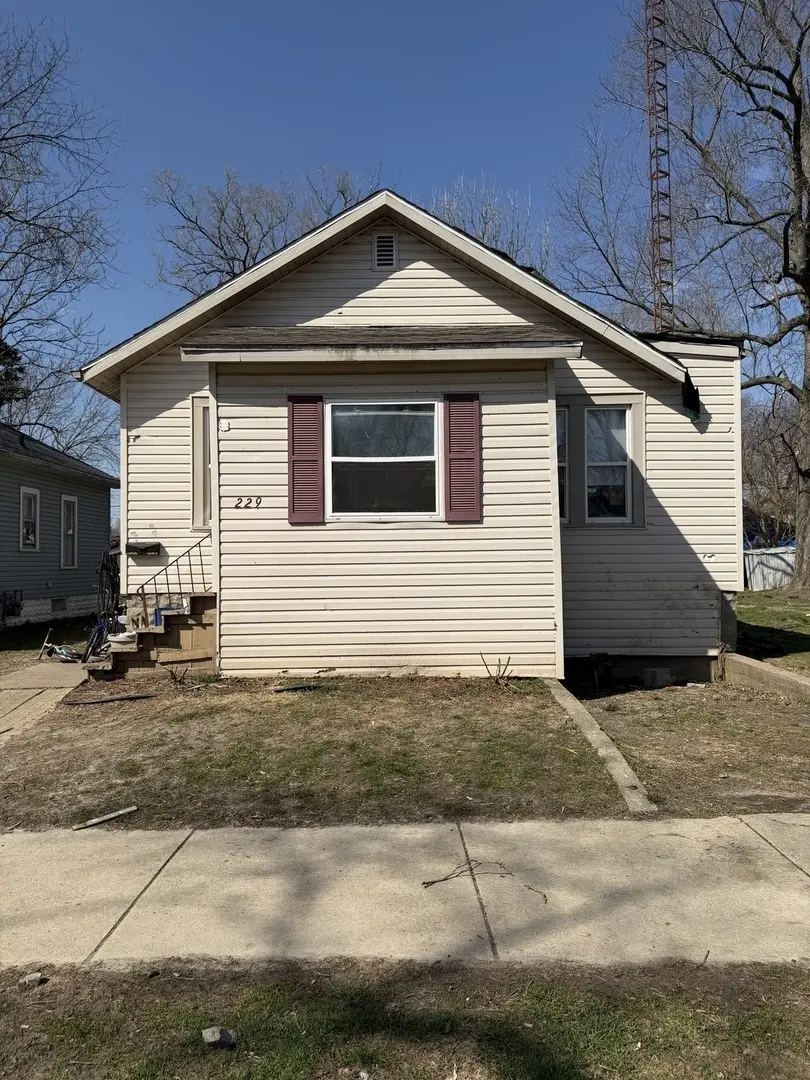
229 N 6th Ave · Kankakee, IL
Flood risk 4/10 · Minor
- FEMA flood zone
- X (unshaded)
- Chance of flooding over 30 yrs
- 0.27%
- Est. flood insurance / yr
- $473 – $860
Fire risk 1/10 · Minimal
- Est. fire insurance / yr
- $804 – $1,492
Heat risk 3/10 · Minor
- Hot days now (above 105°F)
- 7 days/yr
- Hot days in 30 yrs
- 16 days/yr
Wind risk 2/10 · Minimal
- Chance of severe wind over 30 yrs
- 1.0%
Air-quality risk 2/10 · Minimal
- Unhealthy air days now
- 1 days/yr
- Unhealthy air days in 30 yrs
- 1 days/yr
Risk factors via First Street. Map © Google.
Why this score? — see what drove the B grade
The composite is a weighted blend of 9 inputs, each scored 0–100. Each bar is that input's sub-score; the figure is the points it added to the 100-point composite (weight × sub-score).
- Cash flow +30.0/30.0
- ARV discount +15.0/15.0
- 1% rule +10.0/10.0
- DSCR +10.0/10.0
- Rent growth +3.6/5.0
- Livability +3.1/5.0
- Condition / age +2.5/5.0
- Schools +0.8/10.0
- Appreciation +0.0/10.0
$40,000
🖨 Deal sheet 📄 Offer letter ✓ Due diligence
Listing remarks MLS
Investor special with great potential! This 2-bedroom, 1-bath home features a full basement offering opportunities for additional living space or expansion. An additional lot is included, creating a generously sized property with plenty of possibilities. Perfect for rehabbers or investors looking to add value.
Key facts
- Full basement
- Additional lot
- 1,950 sq ft lot
Tags
Neighborhood map
What this means for you Summary
Snapshot
- This is a 2-bed/1.0-bath single-family listed at $40k.
Deal economics
- At list price, monthly cash flow is $670 ($8k/yr) — positive.
- The deal already cash-flows at list — no discount required.
- Meets the 1% rule at list price ($1k rent vs $40k).
- Recommended offer: $39k (1.5% below list) — sets the bar for market timing.
- Cap rate 26.4% vs local median 5.8% in Kankakee — top-decile yield for the area; either an underpriced asset or a hidden risk that comps aren't pricing in. Stress-test before assuming the spread holds.
Location & tenants
- Location reads 62/100 on livability (#832 in IL) — a middle-class / working-renter tenant base. Strengths: commute A+, cost of living A+, housing A; Watch: schools F, crime F, amenities F.
- Kankakee SD 111 (urban): math 6% / reading 13% proficiency, ranked #584 of 620 in IL (top 94%) — low school quality limits family demand, transient renter base, plan for 1-2y turnover; 78% free/reduced lunch — lower-income household profile, screen leases tightly.
- Market conditions: Rents rising fast (+4.4%/yr); 115 active listings in the ZIP; 4 comparable units currently listed for rent nearby; rentals lingering (median 44d on market — plan ~5-8 weeks vacancy on turnover, expect pricing pressure); 75% of comp listings sitting > 30 days — soft ceiling on asking rent; 145 units permitted in Kankakee County in 2024 (5 in 5+ unit buildings).
Forward outlook
- Local home prices are declining (-3.0%/yr); year-one equity from $277 of loan paydown is wiped out by about $1k of value loss. Plan a longer hold.
- Kankakee County population projected at -19% by 2050 — secular population decline; favor cash flow + early exit over multi-decade hold.
- At projected returns (-3.0% appreciation + 4.4% rent growth), your $11k cash investment doubles in ~2 years — after that, you're playing with house money.
Negotiation context
- It's been on market 16 days — a 2% lower offer ($39k) is reasonable based on typical stale-listing flexibility.
- 8 sale attempts since 18y ago with the ask held roughly flat each time — persistent listings suggest the price (not the market) is what's stuck; bring a comps-based counter.
- Current owner paid $13k; list at $40k implies a 208% gain — meaningful room to come down on a strong offer.
Risks & watch-outs
- Watch-outs: built in 1928 — expect roof / HVAC / electrical / plumbing capex.
Questions for the listing agent
- Built in 1928 — when were the roof, HVAC, electrical panel, plumbing, and water heater last replaced?
- Is there a deadline driving the sale (1031 exchange, divorce, estate, relocation)? That informs how much negotiation room exists.
- Schools are F-rated, which usually means shorter tenancies and higher turnover. Who's the typical renter profile here, and what's been the actual vacancy rate?
- Crime grade is F in this area — have there been break-ins, vandalism, or insurance claims at this property in the last 3 years? What carrier currently insures it and at what premium?
- What's the average days-on-market for RENTAL listings here right now (not sales)? A rising rental-DOM trend means longer vacancies and softer asking-rent achievability than the comps imply.
- What's the recent tenant-quality profile in this submarket — average credit score on applications, eviction rate, late-payment / NSF rate, and stable-employment percentage? A property-management company in the area should have these aggregated.
- How much new for-sale + rental construction is in the pipeline within 1–3 miles? Heavy new supply typically softens prices + rents 12–24 months out; constrained supply supports both.
Investment metrics
- 1% rule
- 3.00% ✓
- Cap rate
- 26.40%
- Cash-on-cash
- 71.80%
- DSCR
- 4.19
- GRM
- 2.8
CMA / ARV
- ARV (median comp)
- $78,036
- List price
- $40,000
- Delta
- -48.74%
- Verdict
- UNDERPRICED
- Comps
- 20 within 1.0 mi
Show comp detail 12 sales within ~0.75 mi
| Address | Dist | Beds/Ba | Sqft | Sold | Price | $/sf | Match |
|---|---|---|---|---|---|---|---|
| 229 N 6th Ave | 0.00mi | 2/1.0 | 802 (0%) | 0mo | $40,000 | $50 | 100 |
| 356 W Cypress St | 0.23mi | 2/1.0 | 832 (+4%) | 1mo | $46,000 | $55 | 82 |
| 556 N 10th Ave | 0.30mi | 2/1.0 | 810 (+1%) | 6mo | $119,000 | $147 | 79 |
| 595 W Bridge St | 0.03mi | 2/1.0 | 700 (-13%) | 1mo | $126,100 | $180 | 76 |
| 245 N 6th Ave | 0.01mi | 2/2.0 | 720 (-10%) | 7mo | $100,000 | $139 | 73 |
| 520 N 10th Ave | 0.29mi | 2/1.0 | 768 (-4%) | 9mo | $90,000 | $117 | 72 |
| 945 Stone St | 0.21mi | 2/1.0 | 900 (+12%) | 7mo | $57,500 | $64 | 64 |
| 225 N West Ave | 0.36mi | 3/1.0 (+1) | 850 (+6%) | 8mo | $29,900 | $35 | 62 |
| 618 N 9th Ave | 0.31mi | 2/1.5 | 720 (-10%) | 8mo | $120,000 | $167 | 60 |
| 458 N Washington Ave | 0.36mi | 2/1.0 | 700 (-13%) | 3mo | $50,000 | $71 | 59 |
| 846 N 5th Ave | 0.48mi | 2/2.0 | 850 (+6%) | 7mo | $50,000 | $59 | 58 |
| 208 E Birch St | 0.59mi | 3/1.0 (+1) | 900 (+12%) | 8mo | $45,000 | $50 | 40 |
Match score weights: distance 35% · size 25% · config 20% · recency 20%. Top-matched comps best support the ARV.
Projected returns pro-forma
-3.0% appreciation · 4.38% rent growth · sell at horizon
- IRR
- 73.0%
- Equity multiple
- 4.38×
- Total profit
- $37,906
- Equity at exit
- $5,964
- IRR
- 77.3%
- Equity multiple
- 9.50×
- Total profit
- $95,161
- Equity at exit
- $3,458
Cash invested: $11,200 (down + closing). Projections, not guarantees.
Landlord ↔ Tenant lean methodology
- Overall (STATE)
- 43 Moderately Tenant-Leaning
- State Illinois
- 43 Moderately Tenant-Leaning · D+7
- County
- — inherits STATE
- City
- — inherits STATE
ZIP-level market 60901
- Home prices YoY
- -32.5%
- Rents YoY
- 4.4%
- Active inventory
- 115
- Price-to-rent
- 2.8×
Monthly cashflow live
- Estimated rent
- $1,198 medium interval (Pro) →
- Mortgage (P&I)
- −$210
- Tax est. 1.5%
- −$50 /mo · $600/yr
- Insurance
- −$17
- HOA
- −$0
- Vacancy / Maint / Mgmt
- −$252
- Net cashflow
- $670
Break-even live
UW: 25.0% down · 7.5% · 30yr · 1.5% tax · 5.0% vac · 8.0% maint · 8.0% mgmt
Financing live
Cash to close
- Down payment
- $10,000
- Closing costs
- $1,200
- Reserves months
- —
- Total cash needed
- —
Loan-product check · same deal, 3 products live
Conventional
25% down · 7.5% · 30yr
- Down + closing
- —
- Monthly P&I
- —
- Monthly cashflow
- —
- DSCR
- —
- Eligible?
- —
Personal DTI + credit; lowest rate.
DSCR
20% down · 8.5% · 30yr
- Down + closing
- —
- Monthly P&I
- —
- Monthly cashflow
- —
- DSCR
- —
- Eligible?
- —
No personal income docs; deal must DSCR.
Hard money
10% down · 12.0% · 12mo
- Down + closing
- —
- Monthly P&I
- —
- Monthly cashflow
- —
- DSCR
- —
- Eligible?
- —
Short-term bridge; refi at stabilization.
Rent comps 4 comps
| Address | Beds | Baths | Sqft | Rent | $/sqft | DOM | Units | Dist |
|---|---|---|---|---|---|---|---|---|
| 243 S 5th Ave Unit 247 Kankakee, IL | 2.0 | 1.0 | 1000 | $1,150 | $1.15 | 43d | 1 | 0.25mi |
| 319 S 5th Ave Unit 4 Kankakee, IL | 1.0 | 1.0 | 750 | $1,115 | $1.49 | 43d | 1 | 0.32mi |
| 1017 N Schuyler Ave Unit 3 Kankakee, IL | 2.0 | 1.0 | 800 | $1,375 | $1.72 | 43d | 1 | 0.82mi |
| 1100 W Jeffery St Kankakee, IL | 1.0–3.0 | 1.0–2.0 | 900 | $1,224 | $1.36 | 16d | 1 | 1.46mi |
Listing history 33 events
-
2026-05-09status Pending 311-char remark
Show marketing remark (311 chars)
Investor special with great potential! This 2-bedroom, 1-bath home features a full basement offering opportunities for additional living space or expansion. An additional lot is included, creating a generously sized property with plenty of possibilities. Perfect for rehabbers or investors looking to add value.
-
2026-04-22$40,000 Active 311-char remark
Show marketing remark (311 chars)
Investor special with great potential! This 2-bedroom, 1-bath home features a full basement offering opportunities for additional living space or expansion. An additional lot is included, creating a generously sized property with plenty of possibilities. Perfect for rehabbers or investors looking to add value.
-
2026-04-22historical
Show marketing remark (311 chars)
Investor special with great potential! This 2-bedroom, 1-bath home features a full basement offering opportunities for additional living space or expansion. An additional lot is included, creating a generously sized property with plenty of possibilities. Perfect for rehabbers or investors looking to add value.
-
2026-04-14price
-
2026-04-06price
-
2026-03-27Active
-
2015-08-14soldstatus $13,000
-
2015-08-11soldstatus $13,000 Closed Sale
-
2015-07-30status Pending
-
2015-07-24price $15,900
-
2015-05-05price $17,900
-
2015-02-26price $19,900
-
2014-12-30$24,900 New
-
2014-12-08soldstatus $227,000
-
2014-12-02soldstatus $15,861 Closed Sale
-
2014-07-17status Pending
-
2014-06-25historical
-
2014-04-23historical Contingent
-
2014-03-28historical
-
2014-03-27$29,900 New
-
2014-03-14historical
-
2013-11-05status Active
-
2013-11-04historical
-
2013-10-24New
-
2013-09-03soldstatus $551,050
-
2008-10-28soldstatus $30,833
-
2008-10-17soldstatus $30,120
-
2008-10-17soldstatus $30,120
-
2008-07-19historical
-
2008-07-18$31,270
-
2008-07-18$31,270
-
2005-10-28soldstatus $80,000
-
2004-11-01soldstatus $30,000
ⓘ Source: listings_history table (triggers on properties + properties_extension) + one-shot
backfill from property_details.listing_events for pre-trigger history.
Climate risk First Street
- Flood 4/10 Moderate FEMA zone X (unshaded) · 27% chance over 30 yrs
- Wildfire 1/10 Low
- Heat 3/10 Moderate 7 d/yr ≥105°F today · 16 d/yr by 30 yrs out
- Wind 2/10 Low 100% chance of damaging wind over 30 yrs
- Air quality 2/10 Low 1 unhealthy d/yr today · 1 by 30 yrs out
Nearby sold comps map
Loading sold comps map…
Walkable amenities ~0.75 mi
Loading nearby amenities…
Taxation est. · year 1
- Rental income
- $14,379
- − Mortgage interest
- −$2,241
- − Property taxes
- −$600
- − Insurance
- −$200
- − Repairs & maintenance
- −$1,150
- − Management
- −$1,150
- − Depreciation
- −$1,164
- Taxable income
- $7,874
- Est. tax owed @ 24.0%
- −$1,890
- After-tax cash flow
- $6,152/yr
For passive investors: Depreciation is non-cash, so a rental often shows a tax loss while cash-flowing — sheltering income. Rental losses are passive: they offset passive income freely, and up to $25,000/yr can offset ordinary (W-2) income if you actively participate and your MAGI is under $100k (phasing out to $0 by $150k); unused losses carry forward. On sale, claimed depreciation is recaptured at up to 25%, and gains may owe capital-gains tax (a 1031 exchange can defer both). Figures are a year-1 estimate at your 24.0% rate — not tax advice; consult a CPA.
Schools (NCES district)
- District
- Kankakee SD 111
- NCES district ID
- 1720760
- Math proficiency
- 6% ▼ -7.00%
- Reading proficiency
- 13% ▼ -6.00%
- Median HH income
- $37,968
- Composite
- 8.03/100
- National rank
- #9921
- State rank
- #584 of 620 in IL
Livability — Kankakee
- Score
- 62/100
- State rank
- #832
- US rank
- #16432
Category grades
Schools grade is shown separately in the Schools card above.
Census & demographics
- Census place
- Kankakee, IL
- County
- Kankakee County · 61,801 people
- City population
- 33,128
- Metro
- Kankakee, IL
- Population (ZIP)
- 33,128
- Household income
- $58,309
- Rent vs Own
- Severe rent burden
- 1317.0
Population outlook (Kankakee County) Hauer SSP2
- Today (2025)
- 105,479 people
- By 2030
- 101,792 · -3.5%
- By 2040
- 93,479 · -11.4%
- By 2050
- 85,061 · -19.4%
- By 2075
- 67,314 · -36.2%
- By 2100
- 52,439 · -50.3%
Race, ethnicity, and origin ACS 2023
- Neighborhood character
- Diverse neighborhood (Simpson 0.65)
- Race & ethnicity
- White 47% Black 30% Hispanic / Latino 19% Two or more races 7%
- Hispanic origin (detail)
- Mexican 16%
- Common ancestry
- Lithuanian 4% Romanian 4% Slovak 1%
- Foreign-born
- 10% · Canada
- Languages at home
- 82% English-only · Spanish 16%
Political lean MEDSL · Kankakee
- 2024 margin
- Strong R (+20.8) · D 38.7% · R 59.5% · Other 1.8%
- 2008→2024 swing
- -25.4pp toward R · 2008: 4.6pp · 2024: -20.8pp
- All cycles
- 2024: R+20.8 2020: R+16.5 2016: R+13.3 2012: R+3.4 2008: D+4.6
Not yet ingested
- Civics
- —
Market trends
- HPI YoY
- ▼ -92.12%
- Current HPI
- 190.8755
- Rent YoY
- ▲ 4.38%
- Metro
- Kankakee, IL
- State GDP YoY
- ▲ 1.59%
- F500 in state
- 60
Industry mix (Fortune 500 HQ in IL)
| Industry | F500 HQs | Revenue |
|---|---|---|
| Insurance | 4 | $201B |
|
||
| Consumer Goods | 4 | $87B |
|
||
| Industrial Machinery | 3 | $64B |
|
||
| Healthcare | 2 | $55B |
|
||
| Retail / Pharmacy | 1 | $148B |
|
||
| Agriculture / Food | 1 | $86B |
|
||
Price history
+33.3% since first listed33 events — show timeline
- 2026-05-09 Pending — MRED as Distributed by MLS Grid
- 2026-04-22 Listing Removed — MRED as Distributed by MLS Grid
- 2026-04-22 Listed $40,000 MRED as Distributed by MLS Grid
- 2026-04-14 Price Changed — MRED as Distributed by MLS Grid
- 2026-04-06 Price Changed — MRED as Distributed by MLS Grid
- 2026-03-27 Listed — MRED as Distributed by MLS Grid
- 2015-08-14 Sold (Public Records) $13,000 Public Records
- 2015-08-11 Sold (MLS) $13,000 MRED as Distributed by MLS Grid
- 2015-07-30 Pending — MRED as Distributed by MLS Grid
- 2015-07-24 Price Changed $15,900 MRED as Distributed by MLS Grid
- 2015-05-05 Price Changed $17,900 MRED as Distributed by MLS Grid
- 2015-02-26 Price Changed $19,900 MRED as Distributed by MLS Grid
- 2014-12-30 Listed $24,900 MRED as Distributed by MLS Grid
- 2014-12-08 Sold (Public Records) $227,000 Public Records
- 2014-12-02 Sold (MLS) $15,861 MRED as Distributed by MLS Grid
- 2014-07-17 Pending — MRED as Distributed by MLS Grid
- 2014-06-25 Listing Removed — MRED as Distributed by MLS Grid
- 2014-04-23 Contingent — MRED as Distributed by MLS Grid
- 2014-03-28 Listing Removed — MRED as Distributed by MLS Grid
- 2014-03-27 Listed $29,900 MRED as Distributed by MLS Grid
- 2014-03-14 Listing Removed — MRED as Distributed by MLS Grid
- 2013-11-05 Relisted — MRED as Distributed by MLS Grid
- 2013-11-04 Listing Removed — MRED as Distributed by MLS Grid
- 2013-10-24 Listed — MRED as Distributed by MLS Grid
- 2013-09-03 Sold (Public Records) $551,050 Public Records
- 2008-10-28 Sold (Public Records) $30,833 Public Records
- 2008-10-17 Sold (MLS) $30,120 MRED as Distributed by MLS Grid
- 2008-10-17 Sold (MLS) $30,120 MRED as Distributed by MLS Grid
- 2008-07-19 Listing Removed — MRED as Distributed by MLS Grid
- 2008-07-18 Listed $31,270 MRED as Distributed by MLS Grid
- 2008-07-18 Listed $31,270 MRED as Distributed by MLS Grid
- 2005-10-28 Sold (Public Records) $80,000 Public Records
- 2004-11-01 Sold (Public Records) $30,000 Public Records
Property tax history
+0.2%/yrLatest (2024): $2,736 · +7.2% YoY. Source: county tax records.
Cash-flow waterfall
monthlySold comps — $/sqft
last 12 mo · ≤1 miLoading sold comps…