 🏷️ Likely Rental
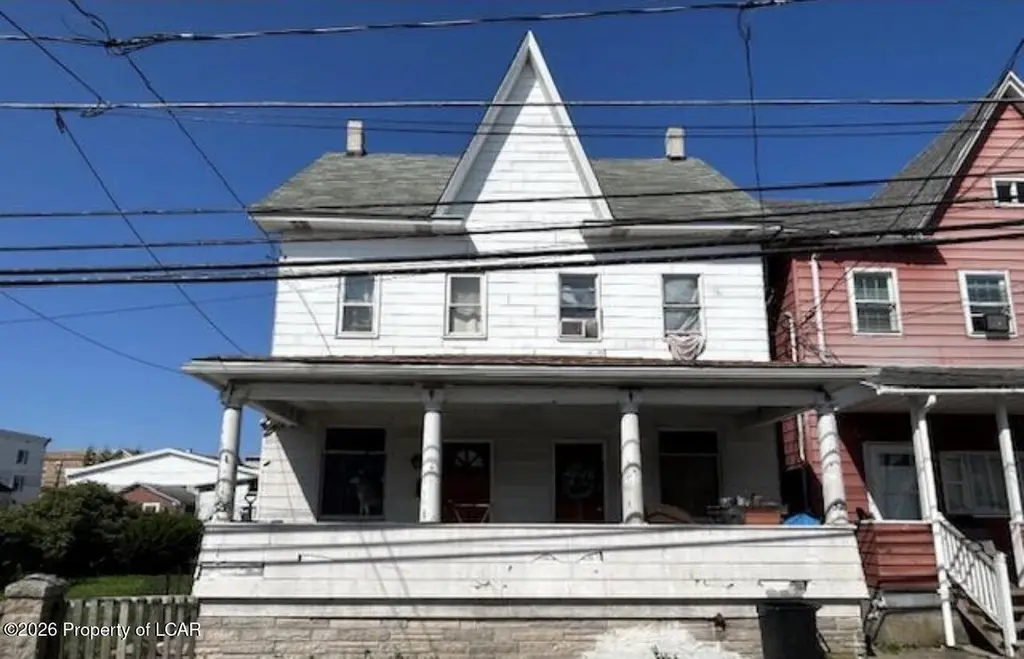
326-328 Washington St. St · Freeland, PA
Flood risk 1/10 · Minimal
- FEMA flood zone
- X (unshaded)
- Chance of flooding over 30 yrs
- 0.0%
- Est. flood insurance / yr
- $507 – $1,088
Fire risk 3/10 · Minor
- Est. fire insurance / yr
- $511 – $949
Heat risk 3/10 · Minor
- Hot days now (above 90°F)
- 7 days/yr
- Hot days in 30 yrs
- 17 days/yr
Wind risk 4/10 · Minor
- Chance of severe wind over 30 yrs
- 8.0%
Air-quality risk 2/10 · Minimal
- Unhealthy air days now
- 1 days/yr
- Unhealthy air days in 30 yrs
- 2 days/yr
Risk factors via First Street. Map © Google.
Why this score? — see what drove the A- grade
The composite is a weighted blend of 9 inputs, each scored 0–100. Each bar is that input's sub-score; the figure is the points it added to the 100-point composite (weight × sub-score).
- Cash flow +30.0/30.0
- ARV discount +15.0/15.0
- 1% rule +10.0/10.0
- DSCR +10.0/10.0
- Appreciation +10.0/10.0
- Livability +3.1/5.0
- Rent growth +2.5/5.0
- Schools +2.0/10.0
- Condition / age +1.0/5.0
$159,900
🖨 Deal sheet 📄 Offer letter ✓ Due diligence
Multi-family units
County records classify this as Multi-Family (2-4 Unit). Listing-text estimate: 2 units. confirmed
Listing remarks
This double home is perfect for investor who is handy. Needs lots of TLC. Home has 3 bedrooms on each side and attic. 326 is vacant and 328 is tenant occupied requires 24 hour notice and showings 4pm or later. Pets present in home. 5 car garage is in poor condition. No FHA, Va or Conventional offers, cash offers only.
Key facts
- 9,750 sq ft lot
- 5 garage spots
- Listed 34 days
Property features AI
Finance
- Financial info: Annual tax amount reported
Exterior
- Parking: Detached garage; On-street parking; Garage with 5 spaces
- Utilities: Public water; Public sewer
- Home design: Multi-family residential income property
- Construction: Asbestos construction material
- Exterior features: Residential zoning; Lot approximately 75x130
Interior
- Heating & cooling: Oil heating; Baseboard heat
- Interior features: Basement present
Neighborhood map
What this means for you Summary
Snapshot
- This is a 2 × 3-bed/1-bath units multifamily listed at $160k. Condition is rated poor.
Deal economics
- At list price, monthly cash flow is $1k ($14k/yr) — positive. Per door: $593/mo.
- The deal already cash-flows at list — no discount required.
- Meets the 1% rule at list price ($3k rent vs $160k).
- Recommended offer: $155k (3.0% below list) — sets the bar for market timing.
- Cap rate 15.2% vs local median 6.3% in Freeland — top-decile yield for the area; either an underpriced asset or a hidden risk that comps aren't pricing in. Stress-test before assuming the spread holds.
Location & tenants
- Location reads 61/100 on livability (#1,409 in PA) — a middle-class / working-renter tenant base. Strengths: cost of living A+, crime A, housing A-; Watch: schools F, amenities F, commute F.
- Hazleton Area SD (suburban): math 18% / reading 30% proficiency, ranked #476 of 539 in PA (top 88%) — low school quality limits family demand, transient renter base, plan for 1-2y turnover.
- Market conditions: 43 active listings in the ZIP; 349 units permitted in Luzerne County in 2024 (16 in 5+ unit buildings).
Forward outlook
- In year one you build about $17k of equity ($1k loan paydown + $16k appreciation (10.0% local appreciation)).
- Luzerne County population projected at +4% by 2050 — modest demand growth; plan on rents tracking national, not racing it.
- At projected returns (10.0% appreciation + 3.0% rent growth), your $45k cash investment doubles in ~2 years — after that, you're playing with house money.
- By year 3, paydown + projected appreciation supports a ~$43k cash-out refi (75% LTV) — recoverable capital for the next deal without selling this one.
Negotiation context
- It's been on market 35 days — a 3% lower offer ($155k) is reasonable based on typical stale-listing flexibility.
Questions for the listing agent
- It's been on market 35 days. Have you received any prior offers? Is the seller open to a 3% concession, seller financing, or rate buy-down credit?
- Can we see the unit-by-unit rent roll, current vacancy, and any below-market leases? What's the average tenancy length?
- What capital expenditures (roof, boiler, parking lot, exteriors) have been made in the last 5 years, and what's planned in the next 2?
- Have any recent inspections been done? Can we get a copy of the seller's disclosures and any deferred-maintenance estimates?
- Is there a deadline driving the sale (1031 exchange, divorce, estate, relocation)? That informs how much negotiation room exists.
- Schools are F-rated, which usually means shorter tenancies and higher turnover. Who's the typical renter profile here, and what's been the actual vacancy rate?
- What's the average days-on-market for RENTAL listings here right now (not sales)? A rising rental-DOM trend means longer vacancies and softer asking-rent achievability than the comps imply.
- What's the recent tenant-quality profile in this submarket — average credit score on applications, eviction rate, late-payment / NSF rate, and stable-employment percentage? A property-management company in the area should have these aggregated.
- How much new apartment / multifamily construction is in the pipeline within 1–3 miles? Heavy new supply (>2% of stock underway) typically softens rents 12–24 months out; light construction supports rent growth.
Investment metrics
- 1% rule
- 1.81% ✓
- Cap rate
- 15.19%
- Cash-on-cash
- 31.79%
- DSCR
- 2.41
- GRM
- 4.6
CMA / ARV
- ARV (median comp)
- $217,447
- List price
- $159,900
- Delta
- -26.46%
- Verdict
- UNDERPRICED
- Comps
- 20 within 1.0 mi
Show comp detail 10 sales within ~0.75 mi
| Address | Dist | Beds/Ba | Sqft | Sold | Price | $/sf | Match |
|---|---|---|---|---|---|---|---|
| 548 550 South St | 0.16mi | 6/16.0 | 2,917 (-9%) | 19mo | $195,000 | $67 | 62 |
| 828 830 Front St | 0.29mi | 5/4.0 (-1) | 3,136 (-2%) | 5mo | $290,000 | $92 | 59 |
| 606 608 Walnut St | 0.33mi | 6/2.0 | 2,850 (-11%) | 1mo | $290,000 | $102 | 45 |
| 454 456 Fern St | 0.22mi | 6/2.0 | 2,819 (-12%) | 8mo | $210,000 | $74 | 43 |
| 1048 Birkbeck St | 0.57mi | 6/4.0 | 3,312 (+4%) | 12mo | $235,000 | $71 | 38 |
| 516 518 Vine St | 0.30mi | 6/3.0 | 3,618 (+13%) | 14mo | $295,000 | $82 | 32 |
| 605 607 Fern St | 0.27mi | 6/2.0 | 2,876 (-10%) | 22mo | $190,000 | $66 | 32 |
| 928 930 Washington St | 0.45mi | 7/114.0 (+1) | 2,856 (-11%) | 11mo | $305,000 | $107 | 32 |
| 946 948 Ridge St | 0.49mi | 6/4.0 | 3,564 (+11%) | 10mo | $287,000 | $81 | 30 |
| 1008 Schwabe St | 0.73mi | 7/4.0 (+1) | 3,609 (+13%) | 3mo | $277,000 | $77 | 22 |
Match score weights: distance 35% · size 25% · config 20% · recency 20%. Top-matched comps best support the ARV.
Projected returns pro-forma
10.0% appreciation · 3.0% rent growth · sell at horizon
- IRR
- 48.5%
- Equity multiple
- 4.63×
- Total profit
- $162,664
- Equity at exit
- $144,051
- IRR
- 42.3%
- Equity multiple
- 10.37×
- Total profit
- $419,707
- Equity at exit
- $310,651
Cash invested: $44,772 (down + closing). Projections, not guarantees.
Landlord ↔ Tenant lean methodology
- Overall (STATE)
- 62 Landlord-Friendly
- State Pennsylvania
- 62 Landlord-Friendly · EVEN
- County
- — inherits STATE
- City
- — inherits STATE
ZIP-level market 18224
- Home prices YoY
- 9.2%
- Active inventory
- 43
- Price-to-rent
- 9.2×
Monthly cashflow live
- Estimated rent
- $2,900 medium interval (Pro) →
- Mortgage (P&I)
- −$839
- Tax est. 1.5%
- −$200 /mo · $2,398/yr
- Insurance
- −$67
- HOA
- −$0
- Vacancy / Maint / Mgmt
- −$609
- Net cashflow
- $1,186
Break-even live
2-unit breakdown (identical units grouped — click to expand)
| Units | Beds | Baths | Est. rent |
|---|---|---|---|
| 2× units | 3 | 1 | $2,900 |
| #1 | 3 | 1 | $1,450 |
| #2 | 3 | 1 | $1,450 |
| Total (2 units) | $2,900 | ||
UW: 25.0% down · 7.5% · 30yr · 1.5% tax · 5.0% vac · 8.0% maint · 8.0% mgmt
Financing live
Cash to close
- Down payment
- $39,975
- Closing costs
- $4,797
- Reserves months
- —
- Total cash needed
- —
Loan-product check · same deal, 3 products live
Conventional
25% down · 7.5% · 30yr
- Down + closing
- —
- Monthly P&I
- —
- Monthly cashflow
- —
- DSCR
- —
- Eligible?
- —
Personal DTI + credit; lowest rate.
DSCR
20% down · 8.5% · 30yr
- Down + closing
- —
- Monthly P&I
- —
- Monthly cashflow
- —
- DSCR
- —
- Eligible?
- —
No personal income docs; deal must DSCR.
Hard money
10% down · 12.0% · 12mo
- Down + closing
- —
- Monthly P&I
- —
- Monthly cashflow
- —
- DSCR
- —
- Eligible?
- —
Short-term bridge; refi at stabilization.
Listing history 16 events
-
2026-06-19days on market $159,900 Active 35 DOM
-
2026-06-18days on market $159,900 Active 34 DOM
-
2026-06-17days on market $159,900 Active 33 DOM
-
2026-06-16days on market $159,900 Active 32 DOM
-
2026-06-15days on market $159,900 Active 31 DOM
-
2026-06-14days on market $159,900 Active 29 DOM
-
2026-06-12days on market $159,900 Active 28 DOM
-
2026-06-09days on market $159,900 Active 25 DOM
-
2026-06-08days on market $159,900 Active 24 DOM
-
2026-06-07days on market $159,900 Active 23 DOM
-
2026-06-02days on market $159,900 Active 18 DOM
-
2026-06-01days on market $159,900 Active 17 DOM
-
2026-05-31days on market $159,900 Active 16 DOM
-
2026-05-30days on market $159,900 Active 15 DOM
-
2026-05-15$159,900 Active 319-char remark
-
2024-12-04price $175,000
ⓘ Source: listings_history table (triggers on properties + properties_extension) + one-shot
backfill from property_details.listing_events for pre-trigger history.
Climate risk First Street
- Flood 1/10 Low FEMA zone X (unshaded) · 0% chance over 30 yrs
- Wildfire 3/10 Moderate
- Heat 3/10 Moderate 7 d/yr ≥90°F today · 17 d/yr by 30 yrs out
- Wind 4/10 Moderate 8% chance of damaging wind over 30 yrs
- Air quality 2/10 Low 1 unhealthy d/yr today · 2 by 30 yrs out
Nearby sold comps map
Loading sold comps map…
Walkable amenities ~0.75 mi
Loading nearby amenities…
Taxation est. · year 1
- Rental income
- $34,800
- − Mortgage interest
- −$8,957
- − Property taxes
- −$2,398
- − Insurance
- −$800
- − Repairs & maintenance
- −$2,784
- − Management
- −$2,784
- − Depreciation
- −$4,652
- Taxable income
- $12,425
- Est. tax owed @ 24.0%
- −$2,982
- After-tax cash flow
- $11,249/yr
For passive investors: Depreciation is non-cash, so a rental often shows a tax loss while cash-flowing — sheltering income. Rental losses are passive: they offset passive income freely, and up to $25,000/yr can offset ordinary (W-2) income if you actively participate and your MAGI is under $100k (phasing out to $0 by $150k); unused losses carry forward. On sale, claimed depreciation is recaptured at up to 25%, and gains may owe capital-gains tax (a 1031 exchange can defer both). Figures are a year-1 estimate at your 24.0% rate — not tax advice; consult a CPA.
Condition & rehab AI · 9 photos
This double home requires extensive renovations and repairs to become move-in ready. Significant updates to the kitchen, bathrooms, roof, exterior, and HVAC system will greatly increase its resale and rental value.
Repairs flagged
- Major kitchen appliances — outdated and non-functional
- Major bathroom fixtures — dark and outdated
- Major roof — visible wear and tear
- Major exterior siding — weathered and peeling
- Major windows — broken or missing
- Major HVAC system — outdated and possibly non-functional
- Major landscaping — overgrown and unkempt
Value-add opportunities
- Both extensive kitchen renovation — modern kitchen will attract both buyers and renters
- Both bathroom renovation — modern bathrooms will attract both buyers and renters
- Both roof replacement — new roof will increase property value and attract buyers
- Both exterior siding and landscaping — new siding and landscaping will improve curb appeal and attract buyers
- Both HVAC system replacement — modern HVAC system will attract buyers and renters
- Both paint interior walls — fresh paint will improve interior appearance and attract buyers
- Both replace flooring — new flooring will improve interior appearance and attract buyers
- Both repair foundation — repairing foundation will improve structural integrity and attract buyers
Renovation cost estimate screening
| Repair item | Severity | Est. cost |
|---|---|---|
| kitchen appliances · outdated and non-functional | Major | $15,000–50,000 |
| bathroom fixtures · dark and outdated | Major | $15,000–50,000 |
| roof · visible wear and tear | Major | $15,000–50,000 |
| exterior siding · weathered and peeling | Major | $15,000–50,000 |
| windows · broken or missing | Major | $15,000–50,000 |
| HVAC system · outdated and possibly non-functional | Major | $15,000–50,000 |
| landscaping · overgrown and unkempt | Major | $15,000–50,000 |
| Total estimated repair cost · 7 items | $105,000–350,000 |
Value-add ROI direction
- Both extensive kitchen renovation — modern kitchen will attract both buyers and renters ↑
- Both bathroom renovation — modern bathrooms will attract both buyers and renters ↑
- Both roof replacement — new roof will increase property value and attract buyers ↑
- Both exterior siding and landscaping — new siding and landscaping will improve curb appeal and attract buyers ↑
- Both HVAC system replacement — modern HVAC system will attract buyers and renters ↑
- Both paint interior walls — fresh paint will improve interior appearance and attract buyers ↑
- Both replace flooring — new flooring will improve interior appearance and attract buyers ↑
- Both repair foundation — repairing foundation will improve structural integrity and attract buyers ↑
ⓘ Cost ranges are severity-bucket heuristics (US national rule-of-thumb). Get contractor quotes + a written scope before underwriting a rehab budget.
Schools (NCES district)
- District
- Hazleton Area SD
- NCES district ID
- 4211700
- Math proficiency
- 18% ▼ -3.00%
- Reading proficiency
- 30% ▼ -15.00%
- Median HH income
- $42,247
- Composite
- 20.44/100
- National rank
- #8582
- State rank
- #476 of 539 in PA
Livability — Freeland
- Score
- 61/100
- State rank
- #1409
- US rank
- #17813
Category grades
Schools grade is shown separately in the Schools card above.
Census & demographics
- Census place
- Freeland, PA
- City population
- 5,954
- Population (ZIP)
- 5,954
Population outlook (Luzerne County) Hauer SSP2
- Today (2025)
- 319,505 people
- By 2030
- 319,943 · +0.1%
- By 2040
- 322,643 · +1.0%
- By 2050
- 330,817 · +3.5%
- By 2075
- 379,145 · +18.7%
- By 2100
- 431,908 · +35.2%
Race, ethnicity, and origin ACS 2023
- Neighborhood character
- Predominantly White (85%)
- Race & ethnicity
- White 85% Hispanic / Latino 12% Two or more races 6%
- Hispanic origin (detail)
- Puerto Rican 8% Dominican 3%
- Common ancestry
- Romanian 13% Scotch-Irish 4% Iranian 2%
- Foreign-born
- 3% · Canada
- Languages at home
- 87% English-only · Spanish 10% Russian/Polish/Slavic 1%
Political lean MEDSL · Luzerne
- 2024 margin
- R (+19.2) · D 40.0% · R 59.2%
- 2008→2024 swing
- -27.6pp toward R · 2008: 8.4pp · 2024: -19.2pp
- All cycles
- 2024: R+19.2 2020: R+14.4 2016: R+19.6 2012: D+4.8 2008: D+8.4
Not yet ingested
- Civics
- —
Market trends
- HPI YoY
- ▲ 22.89%
- Current HPI
- 270.8055
- Rent YoY
- —
- Metro
- —
- State GDP YoY
- ▲ 1.68%
- F500 in state
- 34
Industry mix (Fortune 500 HQ in PA)
| Industry | F500 HQs | Revenue |
|---|---|---|
| Healthcare | 2 | $309B |
|
||
| Insurance | 2 | $27B |
|
||
| Telecommunications / Media | 1 | $124B |
|
||
| Industrial Distribution | 1 | $22B |
|
||
| Financial Services | 1 | $20B |
|
||
| Chemicals / Materials | 1 | $18B |
|
||
Price history
-8.6% since first listed2 events — show timeline
- 2026-05-15 Listed $159,900 LCAR
- 2024-12-04 Price Changed $175,000 LCAR
Cash-flow waterfall
monthlySold comps — $/sqft
last 12 mo · ≤1 miLoading sold comps…