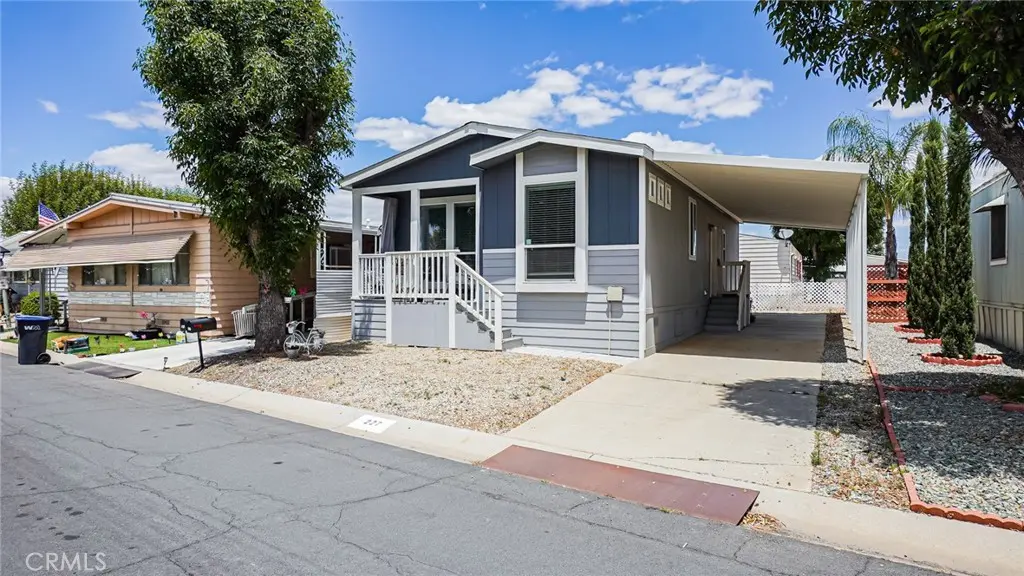
27601 Sun City Blvd #227 · Menifee, CA
Flood risk 1/10 · Minimal
- FEMA flood zone
- X (unshaded)
- Chance of flooding over 30 yrs
- 0.0%
- Est. flood insurance / yr
- $507 – $1,088
Fire risk 7/10 · Major
- Est. fire insurance / yr
- $659 – $1,223
Heat risk 7/10 · Major
- Hot days now (above 105°F)
- 5 days/yr
- Hot days in 30 yrs
- 14 days/yr
Wind risk 1/10 · Minimal
- Chance of severe wind over 30 yrs
- —
Air-quality risk 5/10 · Moderate
- Unhealthy air days now
- 9 days/yr
- Unhealthy air days in 30 yrs
- 11 days/yr
Risk factors via First Street. Map © Google.
Why this score? — see what drove the C+ grade
The composite is a weighted blend of 9 inputs, each scored 0–100. Each bar is that input's sub-score; the figure is the points it added to the 100-point composite (weight × sub-score).
- Cash flow +26.0/30.0
- DSCR +8.7/10.0
- ARV discount +7.5/15.0
- 1% rule +5.9/10.0
- Schools +4.5/10.0
- Rent growth +4.0/5.0
- Condition / age +4.0/5.0
- Livability +3.2/5.0
- Appreciation +0.0/10.0
$209,999
🖨 Deal sheet (PDF) 📄 Offer letter ✓ Due diligence
Listing remarks
Welcome to Sun City Mobile Home Estates, a desirable 55+ community in the heart of Menifee! This beautiful double wide Colonial style practically NEW manufactured home is a MUST see! This home features a 2 bedroom, 2 bath and offers 1,027 square feet of comfortable living space designed for easy, low maintenance living. Step inside to find a bright and inviting floor plan featuring spacious living area, functional kitchen and generously sized bedrooms. The primary suite includes its own private bathroom, providing a comfortable retreat at the end of the day. Enjoy a peaceful lifestyle this vibrant community offers while being near shopping centers, restaurants, grocery stores and local pa
Key facts
- Community pool
- Built 2023
- Listed 22 days
Property features AI
Finance
- Other: Pets allowed
- Financial info: Land lease: $674.46 (current)
- HOA & community: Senior community; Community features: Golf course, biking, dog park, hiking, fishing, street lighting, sidewalks, suburban park
Exterior
- Parking: Located in Sun City Mobile Home Estates (space 227)
- Utilities: Public/District water; Sewer or septic (unknown)
- Home design: Single-story mobile home; Model SR 24442A; Mobile home remains
- Construction: Mobile width 23; Mobile length 44; 1 total story; Year built (per seller)
- Exterior features: Community pool
Interior
- Kitchen: Gas cooktop; Gas range; Gas oven; Microwave; Refrigerator; Dishwasher
- Bedrooms: Entry level: 1
- Flooring: Laminated flooring
- Bathrooms: 2 full bathrooms
- Heating & cooling: Central cooling; Central furnace heating
- Interior features: Ceiling fan; Recessed lighting; Front entry
- Laundry & utility: Laundry room (individual room); Has laundry
Neighborhood map
What this means for you Summary
Snapshot
- This is a 2-bed/2.0-bath manufactured listed at $210k. Condition is rated good.
Deal economics
- At list price, monthly cash flow is $521 ($6k/yr) — positive.
- The deal already cash-flows at list — no discount required.
- Meets the 1% rule at list price ($2k rent vs $210k).
- Recommended offer: $207k (1.5% below list) — sets the bar for market timing.
- Cap rate 9.3% vs local median 3.6% in Menifee — top-decile yield for the area; either an underpriced asset or a hidden risk that comps aren't pricing in. Stress-test before assuming the spread holds.
Location & tenants
- Location reads 64/100 on livability (#407 in CA) — a middle-class / working-renter tenant base. Strengths: housing A+, crime A, employment A-; Watch: schools D+, health & safety D+, amenities D.
- Menifee Union Elementary (suburban): math 43% / reading 56% proficiency, ranked #434 of 1,400 in CA (top 31%) — families likely to look elsewhere, expect single-tenant / working-renter base with shorter leases.
- Market conditions: Rents rising fast (+6.1%/yr); 196 active listings in the ZIP; 20 comparable units currently listed for rent nearby; rentals leasing fast (median 0d on market — plan ~1-2 weeks tenant-placement turnaround); 9,195 units permitted in Riverside County in 2024 (1,512 in 5+ unit buildings).
- At $2,290/mo this rent would consume 48% of the median local household income ($58k/yr) (locally 1163% of renters already pay >50% of income on rent) — very limited rent-growth headroom before tenants either downsize or default.
Forward outlook
- Local home prices are declining (-3.0%/yr); year-one equity from $1k of loan paydown is wiped out by about $6k of value loss. Plan a longer hold.
- Riverside County population projected at +22% by 2050 — long-run rental-demand tailwind backs the buy-and-hold thesis.
- At projected returns (-3.0% appreciation + 6.1% rent growth), your $59k cash investment doubles in ~8 years — after that, you're playing with house money.
Negotiation context
- It's been on market 23 days — a 2% lower offer ($207k) is reasonable based on typical stale-listing flexibility.
Risks & watch-outs
- Climate carrying-cost: major wildfire risk; extreme-heat days projected 5→14/yr by 2055 (HVAC capex compounding) — expect insurance premiums to compound above CPI over the hold.
Questions for the listing agent
- Is there a deadline driving the sale (1031 exchange, divorce, estate, relocation)? That informs how much negotiation room exists.
- Schools are D-rated, which usually means shorter tenancies and higher turnover. Who's the typical renter profile here, and what's been the actual vacancy rate?
- What's the average days-on-market for RENTAL listings here right now (not sales)? A rising rental-DOM trend means longer vacancies and softer asking-rent achievability than the comps imply.
- What's the recent tenant-quality profile in this submarket — average credit score on applications, eviction rate, late-payment / NSF rate, and stable-employment percentage? A property-management company in the area should have these aggregated.
- How much new for-sale + rental construction is in the pipeline within 1–3 miles? Heavy new supply typically softens prices + rents 12–24 months out; constrained supply supports both.
Investment metrics
- 1% rule
- 1.09% ✓
- Cap rate
- 9.27%
- Cash-on-cash
- 10.63%
- DSCR
- 1.47
- GRM
- 7.6
CMA / ARV
- ARV (on-the-fly)
- $80,106
- Comps found
- 12
Show comp detail 12 sales within ~0.75 mi
| Address | Dist | Beds/Ba | Sqft | Sold | Price | $/sf | Match |
|---|---|---|---|---|---|---|---|
| 27601 Sun City Blvd Spc 194 | 0.00mi | 2/2.0 | 1,040 (+1%) | 14mo | $110,000 | $106 | 86 |
| 27601 Sun City Blvd #291 | 0.00mi | 2/2.0 | 1,060 (+3%) | 20mo | $110,000 | $104 | 78 |
| 27601 Sun City Blvd #248 | 0.07mi | 2/2.0 | 1,080 (+5%) | 12mo | $70,000 | $65 | 78 |
| 27601 Sun City Blvd #37 | 0.00mi | 2/2.0 | 1,080 (+5%) | 17mo | $105,000 | $97 | 78 |
| 27601 Sun City Blvd #143 | 0.05mi | 2/2.0 | 1,068 (+4%) | 18mo | $115,000 | $108 | 76 |
| 27150 Shadel Rd #108 | 0.49mi | 2/2.0 | 1,080 (+5%) | 1mo | $72,500 | $67 | 68 |
| 27150 Shadel Rd #82 | 0.49mi | 2/2.0 | 1,120 (+9%) | 4mo | $75,000 | $67 | 59 |
| 27150 Shadel Rd #75 | 0.32mi | 2/1.0 | 960 (-6%) | 14mo | $59,000 | $61 | 58 |
| 27150 Shadel Rd #37 | 0.32mi | 2/2.0 | 1,120 (+9%) | 20mo | $48,000 | $43 | 54 |
| 27250 Murrieta Rd #378 | 0.70mi | 2/2.0 | 1,150 (+12%) | 3mo | $90,000 | $78 | 44 |
| 27250 Murrieta Rd #28 | 0.70mi | 2/2.0 | 960 (-6%) | 24mo | $72,500 | $76 | 37 |
| 27250 Murrieta Rd #59 | 0.70mi | 2/2.0 | 1,150 (+12%) | 14mo | $160,000 | $139 | 36 |
Match score weights: distance 35% · size 25% · config 20% · recency 20%. Top-matched comps best support the ARV.
Projected returns pro-forma
-3.0% appreciation · 6.1% rent growth · sell at horizon
- IRR
- 2.8%
- Equity multiple
- 1.11×
- Total profit
- $6,442
- Equity at exit
- $31,312
- IRR
- 14.9%
- Equity multiple
- 2.37×
- Total profit
- $80,267
- Equity at exit
- $18,157
Cash invested: $58,800 (down + closing). Projections, not guarantees.
Landlord ↔ Tenant lean methodology
- Overall (STATE)
- 18 Strongly Tenant-Friendly
- State California
- 18 Strongly Tenant-Friendly · D+13
- County
- — inherits STATE
- City
- — inherits STATE
ZIP-level market 92586
- Home prices YoY
- -19.1%
- Rents YoY
- 6.1%
- Active inventory
- 196
- Price-to-rent
- 7.6×
Monthly cashflow live
- Estimated rent
- $2,290 high interval (Pro) →
- Mortgage (P&I)
- −$1,101
- Tax from tax record
- −$100 /mo · $1,196/yr
- Insurance
- −$87
- HOA
- −$0
- Vacancy / Maint / Mgmt
- −$481
- Net cashflow
- $521
Break-even live
Sensitivity live
| Price | -10% $640 | -5% $580 | +0% $521 | +5% $461 | +10% $402 |
|---|---|---|---|---|---|
| Rent | -10% $340 | -5% $430 | +0% $521 | +5% $611 | +10% $702 |
| Rate | -1.0pp $627 | -0.5pp $574 | base $521 | +0.5pp $466 | +1.0pp $411 |
UW: 25.0% down · 7.5% · 30yr · 1.5% tax · 5.0% vac · 8.0% maint · 8.0% mgmt
Financing live
Cash to close
- Down payment
- $52,500
- Closing costs
- $6,300
- Reserves months
- —
- Total cash needed
- —
Loan-product check · same deal, 3 products live
Conventional
25% down · 7.5% · 30yr
- Down + closing
- —
- Monthly P&I
- —
- Monthly cashflow
- —
- DSCR
- —
- Eligible?
- —
Personal DTI + credit; lowest rate.
DSCR
20% down · 8.5% · 30yr
- Down + closing
- —
- Monthly P&I
- —
- Monthly cashflow
- —
- DSCR
- —
- Eligible?
- —
No personal income docs; deal must DSCR.
Hard money
10% down · 12.0% · 12mo
- Down + closing
- —
- Monthly P&I
- —
- Monthly cashflow
- —
- DSCR
- —
- Eligible?
- —
Short-term bridge; refi at stabilization.
Rent comps 20 comps
| Address | Beds | Baths | Sqft | Rent | $/sqft | DOM | Units | Dist |
|---|---|---|---|---|---|---|---|---|
| 27051 Sun City Blvd Unit 1 Menifee, CA | 2.0 | 1.0 | 729 | $1,975 | $2.71 | 0d | 1 | 0.58mi |
| 29196 Crestone Dr Sun City, CA | 2.0 | 2.0 | 1393 | $1,995 | $1.43 | 0d | 1 | 0.58mi |
| 28244 Encanto Dr Menifee, CA | 2.0 | 2.0 | 900 | $2,300 | $2.56 | 0d | 1 | 0.66mi |
| 28301 Encanto Dr Unit 10 Menifee, CA | 2.0 | 2.0 | 900 | $2,200 | $2.44 | 19d | 1 | 0.70mi |
| 28082 Bavaria Dr Menifee, CA | 2.0 | 2.0 | 1065 | $2,250 | $2.11 | 0d | 1 | 0.74mi |
| 28301 Encanto Dr Menifee, CA | 2.0 | 1.0–2.0 | 873 | $2,025 | $2.32 | 0d | 5 | 0.78mi |
| 26217 Birkdale Rd Menifee, CA | 1.0 | 1.0 | 876 | $2,150 | $2.45 | 0d | 1 | 0.81mi |
| 26156 Birkdale Rd Menifee, CA | 2.0 | 2.0 | 1285 | $2,000 | $1.56 | 3d | 1 | 0.83mi |
| 28375 Paseo Grande Dr Menifee, CA | 2.0 | 2.0 | 1285 | $2,395 | $1.86 | 0d | 1 | 0.85mi |
| 28230 Avenida Francesca Menifee, CA | 2.0 | 2.0 | 1116 | $2,250 | $2.02 | 0d | 1 | 0.87mi |
| 27709 Camino Donaire Menifee, CA | 3.0 | 2.0 | 1317 | $3,000 | $2.28 | 0d | 1 | 0.88mi |
| 28377 Encanto Dr Menifee, CA | 1.0–3.0 | 1.0–2.0 | 815 | $2,150 | $2.64 | 0d | 7 | 0.90mi |
| 25861 McCall Blvd Menifee, CA | 2.0 | 2.0 | 1378 | $2,350 | $1.71 | 0d | 1 | 1.00mi |
| 28323 Murrieta Rd Menifee, CA | 2.0 | 2.0 | 1098 | $2,350 | $2.14 | 21d | 1 | 1.06mi |
| 27305 Uppercrest Ct Menifee, CA | 3.0 | 2.0 | 1318 | $2,353 | $1.79 | 23d | 1 | 1.16mi |
| 27757 Aspel Rd Menifee, CA | 1.0–2.0 | 1.0–2.0 | 1026 | $2,822 | $2.75 | 0d | 17 | 1.26mi |
| 25615 Union Hill Dr Menifee, CA | 3.0 | 2.0 | 1350 | $2,550 | $1.89 | 16d | 1 | 1.29mi |
| 28880 Amersfoot Way Menifee, CA | 2.0 | 2.0 | 1386 | $2,400 | $1.73 | 0d | 1 | 1.36mi |
| 28461 Portsmouth Dr Menifee, CA | 3.0 | 2.0 | 1450 | $2,685 | $1.85 | 0d | 1 | 1.45mi |
| 27077 El Rancho Dr Menifee, CA | 3.0 | 2.0 | 1364 | $2,499 | $1.83 | 0d | 1 | 1.48mi |
Listing history 15 events
-
2026-06-21days on market $209,999 Active 23 DOM
-
2026-06-18days on market $209,999 Active 20 DOM
-
2026-06-17days on market $209,999 Active 19 DOM
-
2026-06-16days on market $209,999 Active 18 DOM
-
2026-06-15days on market $209,999 Active 17 DOM
-
2026-06-13days on market $209,999 Active 15 DOM
-
2026-06-09days on market $209,999 Active 11 DOM
-
2026-06-08days on market $209,999 Active 10 DOM
-
2026-06-07remarks 699-char remark
-
2026-06-07days on market $209,999 Active 9 DOM
-
2026-06-04days on market $209,999 Active 6 DOM
-
2026-06-03days on market $209,999 Active 5 DOM
-
2026-06-02days on market $209,999 Active 4 DOM
-
2026-06-01days on market $209,999 Active 3 DOM
-
2026-05-31days on market $209,999 Active 2 DOM
ⓘ Source: listings_history table (triggers on properties + properties_extension) + one-shot
backfill from property_details.listing_events for pre-trigger history.
Tax reassessment forecast CA · Resets to sale price
- Current annual tax
- $1,196 · $100/mo
- Projected year-2 tax
- $1,596 · $133/mo
- Expected delta
- +$400/yr (+$33/mo · 33.4%)
ⓘ Screening estimate from a state-policy table — verify with the county assessor before closing.
Climate risk First Street
- Flood 1/10 Low FEMA zone X (unshaded) · 0% chance over 30 yrs
- Wildfire 7/10 Severe
- Heat 7/10 Severe 5 d/yr ≥105°F today · 14 d/yr by 30 yrs out
- Wind 1/10 Low
- Air quality 5/10 Major 9 unhealthy d/yr today · 11 by 30 yrs out
Nearby sold comps map
Loading sold comps map…
Walkable amenities ~0.75 mi
Loading nearby amenities…
Taxation est. · year 1
- Rental income
- $27,483
- − Mortgage interest
- −$11,763
- − Property taxes
- −$1,196
- − Insurance
- −$1,050
- − Repairs & maintenance
- −$2,199
- − Management
- −$2,199
- − Depreciation
- −$6,109
- Taxable income
- $2,967
- Est. tax owed @ 24.0%
- −$712
- After-tax cash flow
- $5,538/yr
For passive investors: Depreciation is non-cash, so a rental often shows a tax loss while cash-flowing — sheltering income. Rental losses are passive: they offset passive income freely, and up to $25,000/yr can offset ordinary (W-2) income if you actively participate and your MAGI is under $100k (phasing out to $0 by $150k); unused losses carry forward. On sale, claimed depreciation is recaptured at up to 25%, and gains may owe capital-gains tax (a 1031 exchange can defer both). Figures are a year-1 estimate at your 24.0% rate — not tax advice; consult a CPA.
Condition & rehab AI · 13 photos
This home is in good condition with a well-maintained exterior and interior. It has a good roof, flooring, and HVAC system. The landscaping and curb appeal are attractive. Painting the exterior and cleaning the HVAC unit can further enhance its value.
Value-add opportunities
- Both Paint the exterior — Painting the exterior can enhance the curb appeal and increase the home's value.
- Both Clean the HVAC unit — A clean HVAC unit can improve air quality and reduce energy costs, making the home more attractive to buyers and renters.
Renovation cost estimate screening
Value-add ROI direction
- Both Paint the exterior — Painting the exterior can enhance the curb appeal and increase the home's value. ↑
- Both Clean the HVAC unit — A clean HVAC unit can improve air quality and reduce energy costs, making the home more attractive to buyers and renters. ↑
ⓘ Cost ranges are severity-bucket heuristics (US national rule-of-thumb). Get contractor quotes + a written scope before underwriting a rehab budget.
Schools (NCES district)
- District
- Menifee Union Elementary
- NCES district ID
- 0624540
- Math proficiency
- 43% ▬ 0.00%
- Reading proficiency
- 56% ▲ 3.00%
- Median HH income
- $58,228
- Composite
- 45.17/100
- National rank
- #5790
- State rank
- #434 of 1400 in CA
Livability — Menifee
- Score
- 64/100
- State rank
- #407
- US rank
- #13882
Category grades
Schools grade is shown separately in the Schools card above.
Census & demographics
- Census place
- Menifee, CA
- County
- Riverside County · 2,287,001 people
- City population
- 111,667
- Metro
- Riverside-San Bernardino-Ontario, CA
- Population (ZIP)
- 20,767
- Household income
- $57,708
- Rent vs Own
- Severe rent burden
- 1163.0
Population outlook (Riverside County) Hauer SSP2
- Today (2025)
- 2,664,475 people
- By 2030
- 2,802,692 · +5.2%
- By 2040
- 3,050,904 · +14.5%
- By 2050
- 3,256,783 · +22.2%
- By 2075
- 3,655,058 · +37.2%
- By 2100
- 3,766,594 · +41.4%
Race, ethnicity, and origin ACS 2023
- Neighborhood character
- Diverse neighborhood (Simpson 0.59)
- Race & ethnicity
- White 55% Hispanic / Latino 31% Two or more races 17% Black 6% Asian 3%
- Hispanic origin (detail)
- Mexican 25% Puerto Rican 1%
- Common ancestry
- Lithuanian 3% Italian 2% Romanian 1%
- Foreign-born
- 15% · Canada, Vietnam, China
- Languages at home
- 77% English-only · Spanish 18% Other Asian/Pacific 1% Other Indo-European 1%
Political lean MEDSL · Riverside
- 2024 margin
- Toss-up / Even · D 48.0% · R 49.3% · Other 2.6%
- 2008→2024 swing
- -3.6pp toward R · 2008: 2.3pp · 2024: -1.3pp
- All cycles
- 2024: R+1.3 2020: D+8.0 2016: D+4.3 2012: R+0.4 2008: D+2.3
Not yet ingested
- Civics
- —
Market trends
- HPI YoY
- ▼ -86.18%
- Current HPI
- 364.9577
- Rent YoY
- ▲ 6.10%
- Metro
- Riverside-San Bernardino-Ontario, CA
- State GDP YoY
- ▲ 3.21%
- F500 in state
- 116
Industry mix (Fortune 500 HQ in CA)
| Industry | F500 HQs | Revenue |
|---|---|---|
| Technology | 27 | $1,492B |
|
||
| Financial Services | 3 | $174B |
|
||
| Retail | 3 | $44B |
|
||
| Insurance | 3 | $26B |
|
||
| Media / Entertainment | 2 | $115B |
|
||
| Pharmaceuticals / Biotech | 2 | $62B |
|
||
Price history
1 event — show timeline
- 2026-05-29 Listed $209,999 CRMLS
Cash-flow waterfall
monthlySold comps — $/sqft
last 12 mo · ≤1 miLoading sold comps…