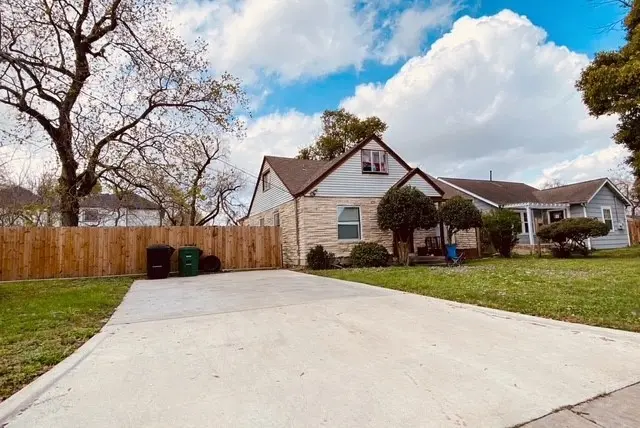
7108 Eastwood St · Houston, TX
Flood risk 7/10 · Major
- FEMA flood zone
- X (unshaded)
- Chance of flooding over 30 yrs
- 0.99%
- Est. flood insurance / yr
- $507 – $1,088
Fire risk 1/10 · Minimal
- Est. fire insurance / yr
- $1,222 – $2,270
Heat risk 9/10 · Severe
- Hot days now (above 109°F)
- 7 days/yr
- Hot days in 30 yrs
- 24 days/yr
Wind risk 9/10 · Severe
- Chance of severe wind over 30 yrs
- 99.0%
Air-quality risk 2/10 · Minimal
- Unhealthy air days now
- 2 days/yr
- Unhealthy air days in 30 yrs
- 2 days/yr
Risk factors via First Street. Map © Google.
Why this score? — see what drove the B- grade
The composite is a weighted blend of 9 inputs, each scored 0–100. Each bar is that input's sub-score; the figure is the points it added to the 100-point composite (weight × sub-score).
- Cash flow +25.2/30.0
- ARV discount +15.0/15.0
- DSCR +8.3/10.0
- 1% rule +6.9/10.0
- Livability +3.7/5.0
- Rent growth +3.0/5.0
- Schools +2.7/10.0
- Condition / age +2.5/5.0
- Appreciation +0.0/10.0
$189,888
🖨 Deal sheet (PDF) 📄 Offer letter ✓ Due diligence
Listing remarks
Located in the heart of Foster Place Subdivision, this property offers a rare opportunity to build your dream home. Surrounded by a blend of new construction and old-school charm, this prime location provides endless possibilities. The property is being sold for lot value, and it boasts a nice-sized lot. Don’t miss out on this fantastic opportunity! Call today!
Key facts
- Nice-sized lot
- Prime location
- 7,723 sq ft lot
Tags
Property features AI
Exterior
- Parking: Driveway; Electric gate
- Utilities: Public water; Public sewer
- Home design: Residential property; Full ownership; Slab foundation
- Construction: Brick and cement siding construction; Built in 1949; Composition roof
- Exterior features: Cleared lot; Asphalt road frontage; Curbs in the community
Interior
- Bedrooms: Up to 4 possible bedrooms
- Bathrooms: 2 full bathrooms
- Heating & cooling: Central heating (gas); Central electric air conditioning; Thermostat (programmable)
- Interior features: Ceiling fans; Kitchen/dining combo; Programmable thermostat
Neighborhood map
What this means for you Summary
Snapshot
- This is a 4-bed/2.0-bath single-family listed at $190k.
Deal economics
- At list price, monthly cash flow is $358 ($4k/yr) — positive.
- The deal already cash-flows at list — no discount required.
- Meets the 1% rule at list price ($2k rent vs $190k).
- Recommended offer: $187k (1.5% below list) — sets the bar for market timing.
- Cap rate 9.0% vs local median 3.2% in Houston — top-decile yield for the area; either an underpriced asset or a hidden risk that comps aren't pricing in. Stress-test before assuming the spread holds.
Location & tenants
- Location reads 74/100 on livability (#184 in TX, #4,771 nationally) — a middle-class / working-renter tenant base. Strengths: amenities A+, cost of living A+, housing A+; Watch: crime F.
- Houston ISD (urban): math 27% / reading 35% proficiency, ranked #593 of 826 in TX (top 72%) — families likely to look elsewhere, expect single-tenant / working-renter base with shorter leases; 71% free/reduced lunch — lower-income household profile, screen leases tightly.
- Zoned schools: Cullen Middle (math 6% / reading 14%, grade F, #1,641 of 1,662 statewide, top 99%, 324 students, 100% FRL); Yates H S (math 12% / reading 23%, grade F, #1,451 of 1,632 statewide, top 89%, 851 students, 96% FRL) — zoned schools average 98% FRL vs 71% district-wide (27 pts higher); higher-poverty schools than district average — tighter screening recommended.
- Zoned-school proficiency averages 14% at this address vs 31% district-wide (-17 pts) — the specific schools serving this property underperform the Houston ISD average; the district grade overstates school quality for this exact location.
- Market conditions: Rents rising (+2.2%/yr); 471 active listings in the ZIP; 40 comparable units currently listed for rent nearby; rentals at typical pace (median 19d on market — plan ~3-4 weeks tenant-placement turnaround); 29,883 units permitted in Harris County in 2024 (8,621 in 5+ unit buildings).
- At $2,269/mo this rent would consume 60% of the median local household income ($46k/yr) (locally 2532% of renters already pay >50% of income on rent) — very limited rent-growth headroom before tenants either downsize or default.
Forward outlook
- Local home prices are declining (-3.0%/yr); year-one equity from $1k of loan paydown is wiped out by about $6k of value loss. Plan a longer hold.
- Harris County population projected at +47% by 2050 — long-run rental-demand tailwind backs the buy-and-hold thesis.
Negotiation context
- It's been on market 25 days — a 2% lower offer ($187k) is reasonable based on typical stale-listing flexibility.
- 2 sale attempts with the ask held roughly flat each time — persistent listings suggest the price (not the market) is what's stuck; bring a comps-based counter.
Risks & watch-outs
- Watch-outs: flood insurance adds $66/mo; built in 1949 — expect roof / HVAC / electrical / plumbing capex.
- Climate carrying-cost: major flood risk; severe wind risk, 99% chance of damaging wind over 30y; extreme-heat days projected 7→24/yr by 2055 (HVAC capex compounding) — expect insurance premiums to compound above CPI over the hold.
Questions for the listing agent
- Built in 1949 — when were the roof, HVAC, electrical panel, plumbing, and water heater last replaced?
- What's the actual annual flood-insurance premium (NFIP or private), and is the property in a SFHA with mandatory coverage?
- Is there a deadline driving the sale (1031 exchange, divorce, estate, relocation)? That informs how much negotiation room exists.
- Schools are D-rated, which usually means shorter tenancies and higher turnover. Who's the typical renter profile here, and what's been the actual vacancy rate?
- Crime grade is F in this area — have there been break-ins, vandalism, or insurance claims at this property in the last 3 years? What carrier currently insures it and at what premium?
- What's the average days-on-market for RENTAL listings here right now (not sales)? A rising rental-DOM trend means longer vacancies and softer asking-rent achievability than the comps imply.
- What's the recent tenant-quality profile in this submarket — average credit score on applications, eviction rate, late-payment / NSF rate, and stable-employment percentage? A property-management company in the area should have these aggregated.
- How much new for-sale + rental construction is in the pipeline within 1–3 miles? Heavy new supply typically softens prices + rents 12–24 months out; constrained supply supports both.
Investment metrics
- 1% rule
- 1.19% ✓
- Cap rate
- 8.98%
- Cash-on-cash
- 9.58%
- DSCR
- 1.43
- GRM
- 7.0
CMA / ARV
- ARV (median comp)
- $230,687
- List price
- $189,888
- Delta
- -13.35%
- Verdict
- UNDERPRICED
- Comps
- 20 within 1.0 mi
Show comp detail 12 sales within ~0.75 mi
| Address | Dist | Beds/Ba | Sqft | Sold | Price | $/sf | Match |
|---|---|---|---|---|---|---|---|
| 7121 England St | 0.18mi | 3/1.0 (-1) | 1,296 (-2%) | 1mo | $139,900 | $108 | 78 |
| 5006 Idaho St | 0.60mi | 4/2.0 | 1,308 (-1%) | 3mo | $225,000 | $172 | 67 |
| 6832 Goforth St | 0.26mi | 3/1.0 (-1) | 1,392 (+5%) | 5mo | $98,000 | $70 | 66 |
| 7247 Saint Augustine St | 0.35mi | 3/2.0 (-1) | 1,440 (+9%) | 9mo | $150,000 | $104 | 57 |
| 4715 Ward St | 0.42mi | 3/2.5 (-1) | 1,454 (+10%) | 7mo | $230,000 | $158 | 52 |
| 6907 Conley St | 0.29mi | 3/2.5 (-1) | 1,501 (+13%) | 8mo | $314,999 | $210 | 51 |
| 5009 Bataan Rd | 0.70mi | 3/2.0 (-1) | 1,228 (-7%) | 2mo | $130,500 | $106 | 49 |
| 3838 Daphne St | 0.71mi | 4/2.0 | 1,461 (+10%) | 2mo | $269,000 | $184 | 48 |
| 6625 Goforth St | 0.44mi | 3/1.0 (-1) | 1,489 (+12%) | 4mo | $142,000 | $95 | 46 |
| 5014 Yellowstone Blvd | 0.71mi | 3/2.0 (-1) | 1,190 (-10%) | 6mo | $189,900 | $160 | 40 |
| 3846 Lydia St | 0.68mi | 3/2.0 (-1) | 1,164 (-12%) | 7mo | $165,000 | $142 | 37 |
| 5035 Andrea St | 0.74mi | 3/2.0 (-1) | 1,156 (-13%) | 6mo | $195,000 | $169 | 35 |
Match score weights: distance 35% · size 25% · config 20% · recency 20%. Top-matched comps best support the ARV.
Projected returns pro-forma
-3.0% appreciation · 2.17% rent growth · sell at horizon
- IRR
- -4.9%
- Equity multiple
- 0.82×
- Total profit
- $-9,730
- Equity at exit
- $28,313
- IRR
- 3.7%
- Equity multiple
- 1.26×
- Total profit
- $13,759
- Equity at exit
- $16,418
Cash invested: $53,169 (down + closing). Projections, not guarantees.
Landlord ↔ Tenant lean methodology
- Overall (STATE)
- 87 Strongly Landlord-Friendly
- State Texas
- 87 Strongly Landlord-Friendly · R+5
- County
- — inherits STATE
- City
- — inherits STATE
ZIP-level market 77021
- Home prices YoY
- -23.6%
- Rents YoY
- 2.2%
- Active inventory
- 471
- Price-to-rent
- 7.0×
Monthly cashflow live
- Estimated rent
- $2,269 high interval (Pro) →
- Mortgage (P&I)
- −$996
- Tax from tax record
- −$293 /mo · $3,517/yr
- Insurance
- −$79
- Flood insurance flood zone
- −$66 /mo · $798/yr
- HOA
- −$0
- Vacancy / Maint / Mgmt
- −$477
- Net cashflow
- $358
Break-even live
Sensitivity live
| Price | -10% $466 | -5% $412 | +0% $358 | +5% $304 | +10% $251 |
|---|---|---|---|---|---|
| Rent | -10% $179 | -5% $269 | +0% $358 | +5% $448 | +10% $537 |
| Rate | -1.0pp $454 | -0.5pp $406 | base $358 | +0.5pp $309 | +1.0pp $259 |
UW: 25.0% down · 7.5% · 30yr · 1.5% tax · 5.0% vac · 8.0% maint · 8.0% mgmt
Financing live
Cash to close
- Down payment
- $47,472
- Closing costs
- $5,697
- Reserves months
- —
- Total cash needed
- —
Loan-product check · same deal, 3 products live
Conventional
25% down · 7.5% · 30yr
- Down + closing
- —
- Monthly P&I
- —
- Monthly cashflow
- —
- DSCR
- —
- Eligible?
- —
Personal DTI + credit; lowest rate.
DSCR
20% down · 8.5% · 30yr
- Down + closing
- —
- Monthly P&I
- —
- Monthly cashflow
- —
- DSCR
- —
- Eligible?
- —
No personal income docs; deal must DSCR.
Hard money
10% down · 12.0% · 12mo
- Down + closing
- —
- Monthly P&I
- —
- Monthly cashflow
- —
- DSCR
- —
- Eligible?
- —
Short-term bridge; refi at stabilization.
Rent comps 40 comps
| Address | Beds | Baths | Sqft | Rent | $/sqft | DOM | Units | Dist |
|---|---|---|---|---|---|---|---|---|
| 6928 Paris St Houston, TX | 3.0 | 2.0 | 1276 | $1,900 | $1.49 | 0d | 1 | 0.23mi |
| 6926 Paris St Houston, TX | 3.0 | 2.0 | 1276 | $1,900 | $1.49 | 0d | 1 | 0.23mi |
| 7032 Conley St Houston, TX | 3.0 | 2.0 | 1220 | $2,850 | $2.34 | 44d | 1 | 0.26mi |
| 4705 Idaho St Houston, TX | 3.0 | 2.5 | 1664 | $2,500 | $1.50 | 18d | 1 | 0.33mi |
| 7321 Conley St Unit A Houston, TX | 3.0 | 2.5 | 1869 | $2,025 | $1.08 | 21d | 1 | 0.37mi |
| 7321 Conley St Unit B Houston, TX | 3.0 | 2.0 | 1501 | $2,025 | $1.35 | 21d | 1 | 0.37mi |
| 3846 Seabrook St Houston, TX | 3.0 | 3.5 | 1833 | $2,300 | $1.25 | 44d | 1 | 0.61mi |
| 4530 Mayflower St Houston, TX | 3.0 | 2.0 | 1302 | $1,800 | $1.38 | 44d | 1 | 0.66mi |
| 6532 Weston St Unit A Houston, TX | 3.0 | 3.0 | 1484 | $2,200 | $1.48 | 19d | 1 | 0.67mi |
| 4942 Bataan Rd Unit 77033 Houston, TX | 4.0 | 2.0 | 1350 | $1,800 | $1.33 | 44d | 1 | 0.67mi |
| 6528 Weston St Unit A Houston, TX | 3.0 | 3.0 | 1484 | $2,200 | $1.48 | 44d | 1 | 0.69mi |
| 6528 Weston St Unit A Houston, TX | 3.0 | 3.0 | 1484 | $2,200 | $1.48 | 0d | 1 | 0.69mi |
| 7358 Guadalcanal Rd Houston, TX | 3.0 | 3.0 | 1768 | $2,195 | $1.24 | 44d | 1 | 0.73mi |
| 3732 Seabrook St Houston, TX | 3.0 | 2.5 | 1727 | $2,350 | $1.36 | 25d | 1 | 0.74mi |
| 4609 Bricker St Unit B Houston, TX | 3.0 | 2.5 | 1300 | $3,500 | $2.69 | 13d | 1 | 0.91mi |
| 4609 Bricker St Unit ABC Houston, TX | 3.0 | 2.5 | 1375 | $3,500 | $2.55 | 12d | 1 | 0.91mi |
| 4613 Bricker St Unit B Houston, TX | 3.0 | 2.5 | 1600 | $2,300 | $1.44 | 44d | 1 | 0.91mi |
| 7710 Darnay Dr Houston, TX | 3.0 | 3.0 | 1635 | $2,095 | $1.28 | 44d | 1 | 0.97mi |
| 8107 Calhoun Rd Houston, TX | 3.0 | 2.5 | 1304 | $2,250 | $1.73 | 25d | 1 | 1.00mi |
| 4601 White Rock St Unit A Houston, TX | 3.0 | 2.5 | 1700 | $2,500 | $1.47 | 44d | 1 | 1.00mi |
| 6109 Wayland St Houston, TX | 4.0 | 2.0 | 1600 | $1,595 | $1.00 | 0d | 1 | 1.01mi |
| 5317 Chennault Rd Unit A Houston, TX | 3.0 | 2.5 | 1608 | $1,849 | $1.15 | 0d | 1 | 1.04mi |
| 7806 Comal St Unit B Houston, TX | 3.0 | 2.5 | 1800 | $2,200 | $1.22 | 44d | 1 | 1.05mi |
| 5813 England St Unit A Houston, TX | 3.0 | 2.5 | 1473 | $2,195 | $1.49 | 5d | 1 | 1.13mi |
| 5123 Dewberry St Houston, TX | 4.0 | 2.0 | 1391 | $2,400 | $1.73 | 44d | 1 | 1.15mi |
| 8521 Dosia St Houston, TX | 3.0 | 2.0 | 1028 | $1,665 | $1.62 | 13d | 1 | 1.20mi |
| 7918 Jutland Rd Houston, TX | 3.0 | 1.0 | 996 | $1,295 | $1.30 | 44d | 1 | 1.20mi |
| 5314 Longmeadow St Houston, TX | 3.0 | 3.0 | 1646 | $1,900 | $1.15 | 44d | 1 | 1.22mi |
| 8010 Livingston St Houston, TX | 3.0 | 2.0 | 1400 | $1,800 | $1.29 | 44d | 1 | 1.23mi |
| 4117 Shelby Cir Unit 1230900P Houston, TX | 4.0 | 2.0 | 1367 | $5,253 | $3.84 | 0d | 1 | 1.23mi |
| 8606 Lee Otis St Houston, TX | 4.0 | 2.5 | 1869 | $1,975 | $1.06 | 0d | 1 | 1.25mi |
| 4406 Sterling St Houston, TX | 3.0 | 2.5 | 1840 | $1,999 | $1.09 | 18d | 1 | 1.25mi |
| 3360 Alice St Unit 510 Houston, TX | 3.0 | 2.0 | 1154 | $1,172 | $1.02 | 13d | 1 | 1.27mi |
| 3360 Alice St Unit 3174 Houston, TX | 3.0 | 2.0 | 1154 | $1,121 | $0.97 | 0d | 1 | 1.27mi |
| 3360 Alice St Unit 3047 Houston, TX | 3.0 | 2.0 | 1154 | $1,172 | $1.02 | 12d | 1 | 1.28mi |
| 3620 Du Bois St Unit 1302349P Houston, TX | 3.0 | 2.5 | 1797 | $2,945 | $1.64 | 4d | 1 | 1.29mi |
| 5222 Northridge Dr Houston, TX | 4.0 | 2.0 | 1300 | $1,850 | $1.42 | 25d | 1 | 1.29mi |
| 6737 Peerless St Unit A Houston, TX | 3.0 | 3.5 | 1732 | $2,649 | $1.53 | 18d | 1 | 1.30mi |
| 6735 Peerless St Unit CUNIT A Houston, TX | 3.0 | 3.5 | 1732 | $2,649 | $1.53 | 18d | 1 | 1.30mi |
| 6735c Peerless St Houston, TX | 3.0 | 3.5 | 1732 | $2,599 | $1.50 | 0d | 1 | 1.31mi |
Listing history 18 events
-
2026-06-21days on market $189,888 Active 25 DOM
-
2026-06-18days on market $189,888 Active 22 DOM
-
2026-06-17days on market $189,888 Active 21 DOM
-
2026-06-16days on market $189,888 Active 20 DOM
-
2026-06-15days on market $189,888 Active 19 DOM
-
2026-06-13days on market $189,888 Active 17 DOM
-
2026-06-09days on market $189,888 Active 13 DOM
-
2026-06-08days on market $189,888 Active 12 DOM
-
2026-06-07days on market $189,888 Active 11 DOM
-
2026-06-04days on market $189,888 Active 8 DOM
-
2026-06-03days on market $189,888 Active 7 DOM
-
2026-06-02days on market $189,888 Active 6 DOM
-
2026-06-01days on market $189,888 Active 5 DOM
-
2026-05-31days on market $189,888 Active 4 DOM
-
2026-04-25price $199,888 369-char remark
-
2026-03-20$215,000 Active 369-char remark
-
2024-08-14soldstatus
-
1988-01-02soldstatus
ⓘ Source: listings_history table (triggers on properties + properties_extension) + one-shot
backfill from property_details.listing_events for pre-trigger history.
Tax reassessment forecast TX · Resets to sale price
- Current annual tax
- $3,517 · $293/mo
- Projected year-2 tax
- $3,517 · $293/mo
- Expected delta
- $0/yr ($0/mo · -0.0%)
ⓘ Screening estimate from a state-policy table — verify with the county assessor before closing.
Climate risk First Street
- Flood 7/10 Severe FEMA zone X (unshaded) · 99% chance over 30 yrs
- Wildfire 1/10 Low
- Heat 9/10 Extreme 7 d/yr ≥109°F today · 24 d/yr by 30 yrs out
- Wind 9/10 Extreme 99% chance of damaging wind over 30 yrs
- Air quality 2/10 Low 2 unhealthy d/yr today · 2 by 30 yrs out
Nearby sold comps map
Loading sold comps map…
Walkable amenities ~0.75 mi
Loading nearby amenities…
Taxation est. · year 1
- Rental income
- $27,230
- − Mortgage interest
- −$10,637
- − Property taxes
- −$3,517
- − Insurance
- −$1,747
- − Repairs & maintenance
- −$2,178
- − Management
- −$2,178
- − Depreciation
- −$5,524
- Taxable income
- $1,448
- Est. tax owed @ 24.0%
- −$348
- After-tax cash flow
- $3,950/yr
For passive investors: Depreciation is non-cash, so a rental often shows a tax loss while cash-flowing — sheltering income. Rental losses are passive: they offset passive income freely, and up to $25,000/yr can offset ordinary (W-2) income if you actively participate and your MAGI is under $100k (phasing out to $0 by $150k); unused losses carry forward. On sale, claimed depreciation is recaptured at up to 25%, and gains may owe capital-gains tax (a 1031 exchange can defer both). Figures are a year-1 estimate at your 24.0% rate — not tax advice; consult a CPA.
Schools (NCES district)
- District
- Houston ISD
- NCES district ID
- 4823640
- Math proficiency
- 27% ▼ -18.00%
- Reading proficiency
- 35% ▼ -6.00%
- Median HH income
- $46,054
- Composite
- 26.63/100
- National rank
- #7173
- State rank
- #593 of 826 in TX
Livability — Houston
- Score
- 74/100
- State rank
- #184
- US rank
- #4771
Category grades
Schools grade is shown separately in the Schools card above.
Census & demographics
- Census place
- Houston, TX
- County
- Harris County · 4,702,590 people
- City population
- 3,226,434
- Metro
- Houston-The Woodlands-Sugar Land, TX
- Population (ZIP)
- 26,153
- Household income
- $45,574
- Rent vs Own
- Severe rent burden
- 2532.0
Population outlook (Harris County) Hauer SSP2
- Today (2025)
- 5,571,493 people
- By 2030
- 6,089,821 · +9.3%
- By 2040
- 7,142,806 · +28.2%
- By 2050
- 8,185,864 · +46.9%
- By 2075
- 10,574,329 · +89.8%
- By 2100
- 12,109,958 · +117.4%
Race, ethnicity, and origin ACS 2023
- Neighborhood character
- Diverse neighborhood (Simpson 0.55)
- Race & ethnicity
- Black 62% Hispanic / Latino 22% Two or more races 12% White 10% Asian 2%
- Hispanic origin (detail)
- Mexican 15%
- Common ancestry
- Italian 1% Romanian 1% Lithuanian 1%
- Foreign-born
- 11% · Canada
- Languages at home
- 77% English-only · Spanish 19% French/Haitian/Cajun 1% Other Indo-European 1%
Political lean MEDSL · Harris
- 2024 margin
- Lean D (+5.5) · D 52.0% · R 46.4% · Other 1.6%
- 2008→2024 swing
- +3.9pp toward D · 2008: 1.6pp · 2024: 5.5pp
- All cycles
- 2024: D+5.5 2020: D+13.3 2016: D+12.4 2012: D+0.1 2008: D+1.6
Not yet ingested
- Civics
- —
Market trends
- HPI YoY
- ▼ -71.22%
- Current HPI
- 230.2869
- Rent YoY
- ▲ 2.17%
- Metro
- Houston-The Woodlands-Sugar Land, TX
- State GDP YoY
- ▲ 3.95%
- F500 in state
- 110
Industry mix (Fortune 500 HQ in TX)
| Industry | F500 HQs | Revenue |
|---|---|---|
| Energy | 16 | $1,198B |
|
||
| Technology | 5 | $198B |
|
||
| Engineering / Construction | 4 | $72B |
|
||
| Energy Services | 3 | $60B |
|
||
| Utilities | 3 | $41B |
|
||
| Healthcare | 2 | $330B |
|
||
Price history
-11.7% since first listed6 events — show timeline
- 2026-05-27 Listed $189,888 HARMLS
- 2026-05-27 Listing Removed — HARMLS
- 2026-04-25 Price Changed $199,888 HARMLS
- 2026-03-20 Listed $215,000 HARMLS
- 2024-08-14 Sold (Public Records) — Public Records
- 1988-01-02 Sold (Public Records) — Public Records
Property tax history
+7.6%/yrLatest (2025): $3,517 · +15.9% YoY. Source: county tax records.
Cash-flow waterfall
monthlySold comps — $/sqft
last 12 mo · ≤1 miLoading sold comps…