11764 W Finch Ave · Middlesex, NC
Flood risk 1/10 · Minimal
- FEMA flood zone
- X (unshaded)
- Chance of flooding over 30 yrs
- 0.0%
- Est. flood insurance / yr
- $507 – $1,088
Fire risk 3/10 · Minor
- Est. fire insurance / yr
- $906 – $1,684
Heat risk 7/10 · Major
- Hot days now (above 107°F)
- 7 days/yr
- Hot days in 30 yrs
- 16 days/yr
Wind risk 6/10 · Moderate
- Chance of severe wind over 30 yrs
- 72.0%
Air-quality risk 2/10 · Minimal
- Unhealthy air days now
- 2 days/yr
- Unhealthy air days in 30 yrs
- 2 days/yr
Risk factors via First Street. Map © Google.
Why this score? — see what drove the D- grade
The composite is a weighted blend of 9 inputs, each scored 0–100. Each bar is that input's sub-score; the figure is the points it added to the 100-point composite (weight × sub-score).
- Appreciation +8.9/10.0
- ARV discount +8.3/15.0
- Cash flow +8.0/30.0
- Livability +3.0/5.0
- Rent growth +2.5/5.0
- Condition / age +2.5/5.0
- Schools +2.2/10.0
- DSCR +2.1/10.0
- 1% rule +1.8/10.0
$275,000
🖨 Deal sheet 📄 Offer letter ✓ Due diligence
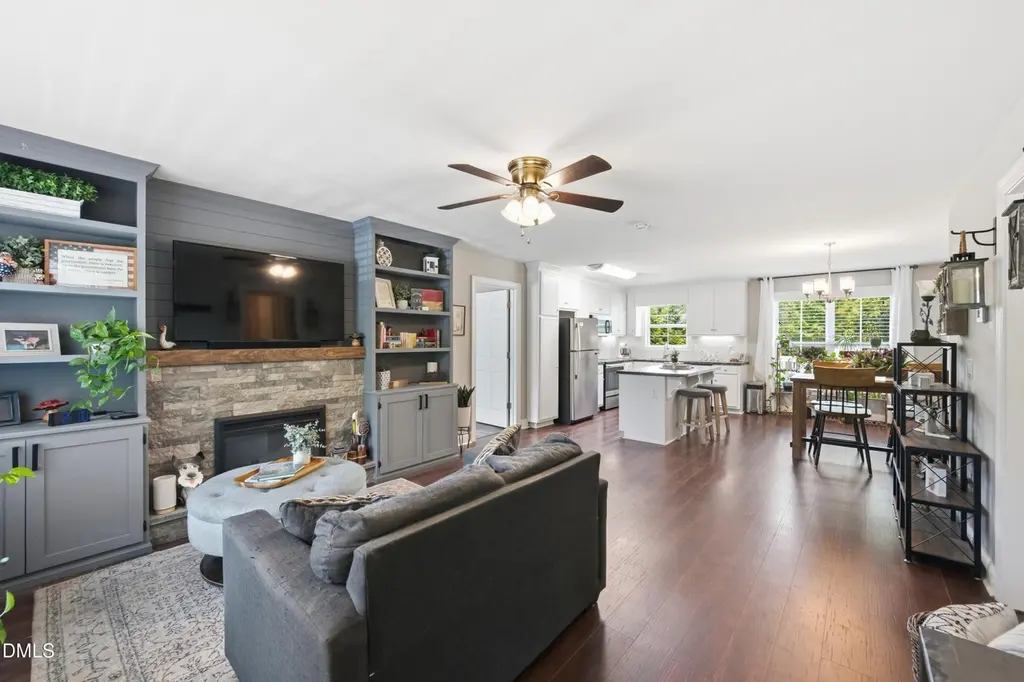
Listing remarks MLS
Great location Min. from Mudcats stadium and super-walmart! Home has wide plank laminate in the living, dining and kitchen, tile backsplash in kitchen. Open floor plan with split bedrooms plan. Lots of windows light and bright. Tile flooring in laundry and bathrooms. Large walk-in closet in master and 3rd bedroom. Tons of storage in attic with room to stand up. Brick foundation all under 150,000. Large deck. PICTURES ARE OF HOME AT 11786 W FINCH THIS HOME IS NOT COMPLETED.
Key facts
- Open floor plan
- Split-bedroom layout
- Natural light
Tags
Property features AI
Finance
- HOA & community: No homeowners association
Exterior
- Parking: Concrete parking
- Utilities: Public water; Public sewer; Electricity connected; Cable connected
- Home design: Site-built one-level home; Entry level: 1
- Construction: Vinyl siding; Shingle roof
- Exterior features: Deck; Rain gutters; Workshop on the property
Interior
- Kitchen: Dishwasher; Microwave; Range; Refrigerator; Water heater
- Bedrooms: 3 bedrooms (all on the main level)
- Flooring: Carpet; Laminate; Luxury vinyl; Tile
- Bathrooms: 2 full bathrooms
- Heating & cooling: Central heating (electric, heat pump); Central air (heat pump)
- Interior features: Bookcases; Built-in features; Ceiling fan(s); Entrance foyer; Kitchen island; Open floorplan; Walk-in closet(s); Walk-in shower
- Laundry & utility: Laundry room
Neighborhood map
What this means for you Summary
Snapshot
- This is a 3-bed/2.0-bath single-family listed at $275k.
Deal economics
- At list price, monthly cash flow is $-277 ($-3k/yr) — negative.
- To cash-flow at today's rent, offer at most $226k (17.8% below list).
- To meet the 1% rule (rent ≥ 1% of price), the offer needs to be $188k (31.8% below list).
- Recommended offer: $188k (31.8% below list) — sets the bar for 1% rule.
- Cap rate 5.1% vs local median 2.9% in Middlesex — top-decile yield for the area; either an underpriced asset or a hidden risk that comps aren't pricing in. Stress-test before assuming the spread holds.
Location & tenants
- Location reads 59/100 on livability (#551 in NC) — a working-class tenant base; expect higher turnover. Strengths: crime A+, cost of living A+, housing A; Watch: amenities F, commute F, employment F.
- Nash-Rocky Mount Schools (rural): math 20% / reading 32% proficiency, ranked #155 of 178 in NC (top 87%) — low school quality limits family demand, transient renter base, plan for 1-2y turnover.
- Zoned schools: Southern Nash Middle (math 20% / reading 35%, grade F, #368 of 475 statewide, top 78%, 798 students, 69% FRL); Southern Nash High (math 32% / reading 44%, grade F, #409 of 535 statewide, top 77%, 1,070 students, 56% FRL) — zoned schools at 63% FRL track the district average.
- Market conditions: 175 active listings in the ZIP; 500 units permitted in Nash County in 2024 (0 in 5+ unit buildings).
Forward outlook
- In year one you build about $23k of equity ($2k loan paydown + $21k appreciation (7.7% local appreciation)).
- Nash County population projected at -12% by 2050 — secular population decline; favor cash flow + early exit over multi-decade hold.
- By year 2, paydown + projected appreciation supports a ~$37k cash-out refi (75% LTV) — recoverable capital for the next deal without selling this one.
Negotiation context
- It's been on market 17 days — a 2% lower offer ($271k) is reasonable based on typical stale-listing flexibility.
- 4 sale attempts since 19y ago with the ask held roughly flat each time — persistent listings suggest the price (not the market) is what's stuck; bring a comps-based counter.
- Current owner paid $142k; list at $275k implies a 94% gain — meaningful room to come down on a strong offer.
Risks & watch-outs
- Climate carrying-cost: major wind risk, 72% chance of damaging wind over 30y; extreme-heat days projected 7→16/yr by 2055 (HVAC capex compounding) — expect insurance premiums to compound above CPI over the hold.
Questions for the listing agent
- What do current leases actually rent for vs. the listed asking? Can we see a recent rent roll and the last 12 months of T-12 income?
- Is there a deadline driving the sale (1031 exchange, divorce, estate, relocation)? That informs how much negotiation room exists.
- Schools are F-rated, which usually means shorter tenancies and higher turnover. Who's the typical renter profile here, and what's been the actual vacancy rate?
- The area grade is low — what's the realistic commute time and amenity access for the typical tenant pool here? Any planned neighborhood developments (good or bad) we should know about?
- What's the average days-on-market for RENTAL listings here right now (not sales)? A rising rental-DOM trend means longer vacancies and softer asking-rent achievability than the comps imply.
- What's the recent tenant-quality profile in this submarket — average credit score on applications, eviction rate, late-payment / NSF rate, and stable-employment percentage? A property-management company in the area should have these aggregated.
- How much new for-sale + rental construction is in the pipeline within 1–3 miles? Heavy new supply typically softens prices + rents 12–24 months out; constrained supply supports both.
Investment metrics
- 1% rule
- 0.68% ✗
- Cap rate
- 5.08%
- Cash-on-cash
- -4.32%
- DSCR
- 0.81
- GRM
- 12.2
CMA / ARV
- ARV (on-the-fly)
- $279,840
- Comps found
- 11
Show comp detail 11 sales within ~0.75 mi
| Address | Dist | Beds/Ba | Sqft | Sold | Price | $/sf | Match |
|---|---|---|---|---|---|---|---|
| 11764 W Finch Ave | 0.00mi | 3/2.0 | 1,321 (+0%) | 0mo | $280,000 | $212 | 100 |
| 11575 Rockside Rd | 0.11mi | 3/2.0 | 1,435 (+9%) | 3mo | $240,000 | $167 | 78 |
| 9964 N Chestnut St | 0.20mi | 3/2.0 | 1,489 (+13%) | 11mo | $273,000 | $183 | 60 |
| 12449 W Pamlico St | 0.45mi | 3/2.0 | 1,411 (+7%) | 11mo | $290,000 | $206 | 58 |
| 11754 Salers Loop | 0.59mi | 3/2.0 | 1,206 (-9%) | 1mo | $287,000 | $238 | 57 |
| 10393 S Spruce St | 0.58mi | 3/2.0 | 1,206 (-9%) | 4mo | $243,500 | $202 | 55 |
| 6726 Jersey Rd | 0.60mi | 3/2.0 | 1,206 (-9%) | 6mo | $280,990 | $233 | 53 |
| 11198 Salers Loop | 0.64mi | 3/2.0 | 1,206 (-9%) | 10mo | $299,990 | $249 | 48 |
| 11826 Salers Loop | 0.64mi | 3/2.0 | 1,206 (-9%) | 14mo | $299,890 | $249 | 45 |
| 10375 S Walnut St | 0.51mi | 3/2.0 | 1,476 (+12%) | 15mo | $235,000 | $159 | 44 |
| 6829 Galloway Dr | 0.61mi | 3/2.0 | 1,206 (-9%) | 17mo | $296,390 | $246 | 43 |
Match score weights: distance 35% · size 25% · config 20% · recency 20%. Top-matched comps best support the ARV.
Projected returns pro-forma
7.73% appreciation · 3.0% rent growth · sell at horizon
- IRR
- 16.1%
- Equity multiple
- 2.18×
- Total profit
- $90,886
- Equity at exit
- $203,932
- IRR
- 15.6%
- Equity multiple
- 4.59×
- Total profit
- $276,592
- Equity at exit
- $400,131
Cash invested: $77,000 (down + closing). Projections, not guarantees.
Landlord ↔ Tenant lean methodology
- Overall (STATE)
- 85 Strongly Landlord-Friendly
- State North Carolina
- 85 Strongly Landlord-Friendly · R+3
- County
- — inherits STATE
- City
- — inherits STATE
ZIP-level market 27557
- Home prices YoY
- 2.5%
- Active inventory
- 175
- Price-to-rent
- 12.2×
Monthly cashflow live
- Estimated rent
- $1,876 medium interval (Pro) →
- Mortgage (P&I)
- −$1,442
- Tax from tax record
- −$202 /mo · $2,430/yr
- Insurance
- −$115
- HOA
- −$0
- Vacancy / Maint / Mgmt
- −$394
- Net cashflow
- $-277
Break-even live
UW: 25.0% down · 7.5% · 30yr · 1.5% tax · 5.0% vac · 8.0% maint · 8.0% mgmt
Financing live
Cash to close
- Down payment
- $68,750
- Closing costs
- $8,250
- Reserves months
- —
- Total cash needed
- —
Loan-product check · same deal, 3 products live
Conventional
25% down · 7.5% · 30yr
- Down + closing
- —
- Monthly P&I
- —
- Monthly cashflow
- —
- DSCR
- —
- Eligible?
- —
Personal DTI + credit; lowest rate.
DSCR
20% down · 8.5% · 30yr
- Down + closing
- —
- Monthly P&I
- —
- Monthly cashflow
- —
- DSCR
- —
- Eligible?
- —
No personal income docs; deal must DSCR.
Hard money
10% down · 12.0% · 12mo
- Down + closing
- —
- Monthly P&I
- —
- Monthly cashflow
- —
- DSCR
- —
- Eligible?
- —
Short-term bridge; refi at stabilization.
Listing history 10 events
-
2026-05-03status Pending
-
2026-04-16$275,000 Active
-
2018-01-12soldstatus $141,900 478-char remark
Show marketing remark (478 chars)
Great location Min. from Mudcats stadium and super-walmart! Home has wide plank laminate in the living, dining and kitchen, tile backsplash in kitchen. Open floor plan with split bedrooms plan. Lots of windows light and bright. Tile flooring in laundry and bathrooms. Large walk-in closet in master and 3rd bedroom. Tons of storage in attic with room to stand up. Brick foundation all under 150,000. Large deck. PICTURES ARE OF HOME AT 11786 W FINCH THIS HOME IS NOT COMPLETED.
-
2018-01-12soldstatus $142,000
Show marketing remark (478 chars)
Great location Min. from Mudcats stadium and super-walmart! Home has wide plank laminate in the living, dining and kitchen, tile backsplash in kitchen. Open floor plan with split bedrooms plan. Lots of windows light and bright. Tile flooring in laundry and bathrooms. Large walk-in closet in master and 3rd bedroom. Tons of storage in attic with room to stand up. Brick foundation all under 150,000. Large deck. PICTURES ARE OF HOME AT 11786 W FINCH THIS HOME IS NOT COMPLETED.
-
2017-10-04$142,900 478-char remark
Show marketing remark (478 chars)
Great location Min. from Mudcats stadium and super-walmart! Home has wide plank laminate in the living, dining and kitchen, tile backsplash in kitchen. Open floor plan with split bedrooms plan. Lots of windows light and bright. Tile flooring in laundry and bathrooms. Large walk-in closet in master and 3rd bedroom. Tons of storage in attic with room to stand up. Brick foundation all under 150,000. Large deck. PICTURES ARE OF HOME AT 11786 W FINCH THIS HOME IS NOT COMPLETED.
-
2008-02-28historical
-
2007-09-17$17,000
-
2006-12-14soldstatus $13,500
ⓘ Source: listings_history table (triggers on properties + properties_extension) + one-shot
backfill from property_details.listing_events for pre-trigger history.
Tax reassessment forecast NC · Resets to sale price
- Current annual tax
- $2,430 · $202/mo
- Projected year-2 tax
- $2,430 · $202/mo
- Expected delta
- $0/yr ($0/mo · 0.0%)
ⓘ Screening estimate from a state-policy table — verify with the county assessor before closing.
Climate risk First Street
- Flood 1/10 Low FEMA zone X (unshaded) · 0% chance over 30 yrs
- Wildfire 3/10 Moderate
- Heat 7/10 Severe 7 d/yr ≥107°F today · 16 d/yr by 30 yrs out
- Wind 6/10 Major 72% chance of damaging wind over 30 yrs
- Air quality 2/10 Low 2 unhealthy d/yr today · 2 by 30 yrs out
Nearby sold comps map
Loading sold comps map…
Walkable amenities ~0.75 mi
Loading nearby amenities…
Taxation est. · year 1
- Rental income
- $22,514
- − Mortgage interest
- −$15,404
- − Property taxes
- −$2,430
- − Insurance
- −$1,375
- − Repairs & maintenance
- −$1,801
- − Management
- −$1,801
- − Depreciation
- −$8,000
- Taxable loss
- −$8,298
- Est. tax savings @ 24.0%
- +$1,991
- After-tax cash flow
- $-1,333/yr
For passive investors: Depreciation is non-cash, so a rental often shows a tax loss while cash-flowing — sheltering income. Rental losses are passive: they offset passive income freely, and up to $25,000/yr can offset ordinary (W-2) income if you actively participate and your MAGI is under $100k (phasing out to $0 by $150k); unused losses carry forward. On sale, claimed depreciation is recaptured at up to 25%, and gains may owe capital-gains tax (a 1031 exchange can defer both). Figures are a year-1 estimate at your 24.0% rate — not tax advice; consult a CPA.
Schools (NCES district)
- District
- Nash-Rocky Mount Schools
- NCES district ID
- 3703270
- Math proficiency
- 20% ▼ -3.00%
- Reading proficiency
- 32% ▲ 1.00%
- Median HH income
- $41,553
- Composite
- 22.04/100
- National rank
- #8198
- State rank
- #155 of 178 in NC
Livability — Middlesex
- Score
- 59/100
- State rank
- #551
- US rank
- #20308
Category grades
Schools grade is shown separately in the Schools card above.
Census & demographics
- Census place
- Middlesex, NC
- Population (ZIP)
- 8,407
Population outlook (Nash County) Hauer SSP2
- Today (2025)
- 91,107 people
- By 2030
- 89,193 · -2.1%
- By 2040
- 84,959 · -6.7%
- By 2050
- 80,517 · -11.6%
- By 2075
- 72,941 · -19.9%
- By 2100
- 63,602 · -30.2%
Race, ethnicity, and origin ACS 2023
- Neighborhood character
- Diverse neighborhood (Simpson 0.64)
- Race & ethnicity
- White 54% Hispanic / Latino 23% Black 13% Two or more races 13% Native American 3%
- Hispanic origin (detail)
- Mexican 13% Puerto Rican 4%
- Common ancestry
- Slovak 2% Romanian 2% Lithuanian 1%
- Foreign-born
- 10% · Canada
- Languages at home
- 77% English-only · Spanish 23%
Political lean MEDSL · Nash
- 2024 margin
- Toss-up / Even · D 48.7% · R 50.5%
- 2008→2024 swing
- -0.4pp no change · 2008: -1.3pp · 2024: -1.8pp
- All cycles
- 2024: R+1.8 2020: D+0.2 2016: R+0.2 2012: D+0.9 2008: R+1.3
Not yet ingested
- Civics
- —
Market trends
- HPI YoY
- ▲ 7.73%
- Current HPI
- 311.489
- Rent YoY
- —
- Metro
- —
- State GDP YoY
- ▲ 3.28%
- F500 in state
- 26
Industry mix (Fortune 500 HQ in NC)
| Industry | F500 HQs | Revenue |
|---|---|---|
| Financial Services | 2 | $213B |
|
||
| Retail | 2 | $95B |
|
||
| Industrial Conglomerate | 1 | $38B |
|
||
| Metals / Steel | 1 | $35B |
|
||
| Utilities | 1 | $30B |
|
||
| Industrial Machinery | 1 | $19B |
|
||
Price history
+1937.0% since first listed10 events — show timeline
- 2026-05-03 Pending — TMLS
- 2026-04-16 Listed $275,000 TMLS
- 2018-01-12 Sold (Public Records) $142,000 Public Records
- 2018-01-12 Sold (MLS) $141,900 AMLSNC
- 2018-01-12 Sold (MLS) $141,900 TMLS
- 2017-10-04 Listed $142,900 AMLSNC
- 2017-10-04 Listed $142,900 TMLS
- 2008-02-28 Listing Removed — TMLS
- 2007-09-17 Listed $17,000 TMLS
- 2006-12-14 Sold (Public Records) $13,500 Public Records
Property tax history
+38.9%/yrLatest (2025): $2,430 · +0.0% YoY. Source: county tax records.
Cash-flow waterfall
monthlySold comps — $/sqft
last 12 mo · ≤1 miLoading sold comps…