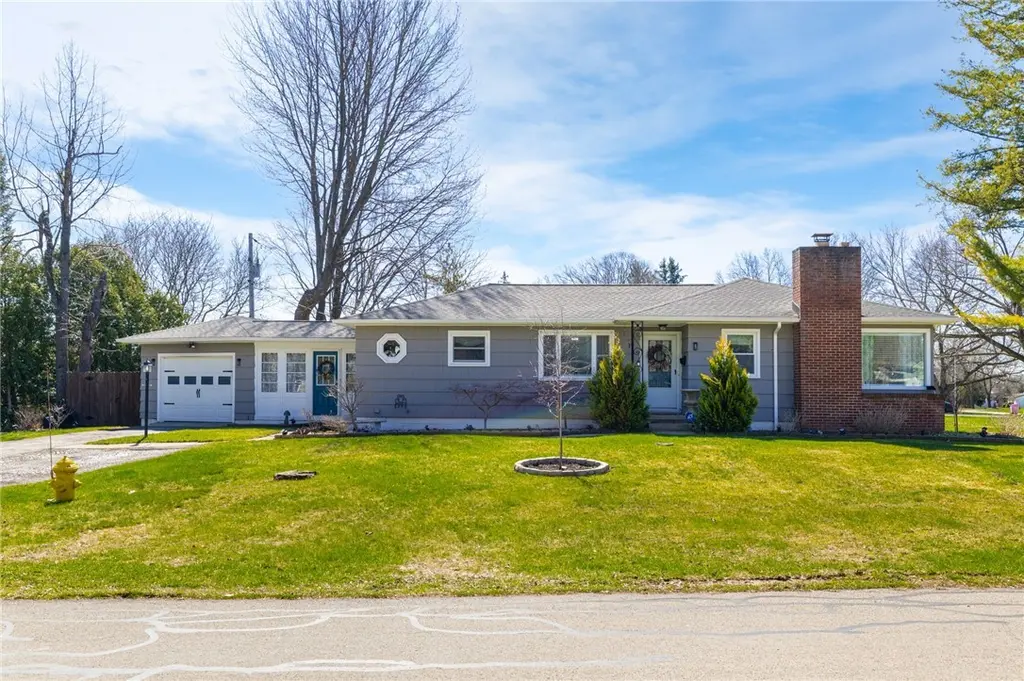
19 Earl Dr · Rochester, NY
Flood risk 1/10 · Minimal
- FEMA flood zone
- X (unshaded)
- Chance of flooding over 30 yrs
- 0.0%
- Est. flood insurance / yr
- $473 – $860
Fire risk 1/10 · Minimal
- Est. fire insurance / yr
- $691 – $1,283
Heat risk 2/10 · Minimal
- Hot days now (above 95°F)
- 7 days/yr
- Hot days in 30 yrs
- 15 days/yr
Wind risk 1/10 · Minimal
- Chance of severe wind over 30 yrs
- —
Air-quality risk 2/10 · Minimal
- Unhealthy air days now
- 1 days/yr
- Unhealthy air days in 30 yrs
- 1 days/yr
Risk factors via First Street. Map © Google.
Why this score? — see what drove the C- grade
The composite is a weighted blend of 9 inputs, each scored 0–100. Each bar is that input's sub-score; the figure is the points it added to the 100-point composite (weight × sub-score).
- ARV discount +15.0/15.0
- Cash flow +14.7/30.0
- 1% rule +5.4/10.0
- DSCR +4.5/10.0
- Livability +3.8/5.0
- Schools +3.6/10.0
- Rent growth +2.5/5.0
- Condition / age +2.5/5.0
- Appreciation +0.0/10.0
$189,900
🖨 Deal sheet (PDF) 📄 Offer letter ✓ Due diligence
Listing remarks MLS
Welcome to 19 Earl Drive!!! Wonderful open concept Ranch home, Some of the Many updates include a newly remodeled Kitchen with Edged counters, New tile backsplash and Crown molding, new light fixtures and tile flooring, you'll love the Custom built fireplace with granite hearth, New 6 panel doors and knobs, Freshly painted throughout, TONs of potential in the semi finished basement, newer Furnace and A/C, call today. .. .. ..
Key facts
- Open floor plan
- Spacious white kit
- Abundant cabinetry
Tags
Neighborhood map
What this means for you Summary
Snapshot
- This is a 2-bed/1.0-bath single-family listed at $190k.
Deal economics
- At list price, monthly cash flow is $48 ($573/yr) — positive.
- The deal already cash-flows at list — no discount required.
- Meets the 1% rule at list price ($2k rent vs $190k).
- Cap rate 6.6% vs local median 9.3% in Rochester — below-typical yield; the buyer is paying a premium for something (appreciation thesis, condition, location) that the cap rate doesn't capture.
Location & tenants
- Location reads 76/100 on livability (#222 in NY, #3,482 nationally) — a middle-class / working-renter tenant base. Strengths: commute A+, cost of living A+, housing A+; Watch: crime F, employment F.
- Gates-Chili Central School District (suburban): math 41% / reading 42% proficiency, ranked #491 of 590 in NY (top 83%) — families likely to look elsewhere, expect single-tenant / working-renter base with shorter leases.
- Zoned schools: Paul Road School (math 32% / reading 42%, grade F, #1,519 of 2,108 statewide, top 74%, 430 students, 42% FRL); Gates-Chili Middle School (math 25% / reading 40%, grade F, #504 of 729 statewide, top 70%, 854 students, 58% FRL); Gates-Chili High School (math 92% / reading 70%, grade A, #495 of 1,100 statewide, top 46%, 1,132 students, 55% FRL) — zoned schools average 52% FRL vs 31% district-wide (21 pts higher); higher-poverty schools than district average — tighter screening recommended.
- Market conditions: 127 active listings in the ZIP; 3 comparable units currently listed for rent nearby; rentals lingering (median 46d on market — plan ~5-8 weeks vacancy on turnover, expect pricing pressure); 67% of comp listings sitting > 30 days — soft ceiling on asking rent; solid renter incomes; 1,169 units permitted in Monroe County in 2024 (591 in 5+ unit buildings).
Forward outlook
- Local home prices are declining (-3.0%/yr); year-one equity from $1k of loan paydown is wiped out by about $6k of value loss. Plan a longer hold.
- Monroe County population projected to shrink 6% by 2050 — rents likely to lag national; underwrite the cash flow, not the appreciation.
Negotiation context
- Only 7 days on market — expect competitive offers; lowballing is unlikely to land.
- 3 sale attempts since 16y ago with the ask held roughly flat each time — persistent listings suggest the price (not the market) is what's stuck; bring a comps-based counter.
- Current owner paid $115k; list at $190k implies a 65% gain — meaningful room to come down on a strong offer.
Risks & watch-outs
- Watch-outs: property tax is 2.7% of price; built in 1935 — expect roof / HVAC / electrical / plumbing capex.
Questions for the listing agent
- Built in 1935 — when were the roof, HVAC, electrical panel, plumbing, and water heater last replaced?
- Property tax is high relative to price — has the assessment been appealed recently, and will the sale trigger a re-assessment?
- Is there a deadline driving the sale (1031 exchange, divorce, estate, relocation)? That informs how much negotiation room exists.
- Schools are D-rated, which usually means shorter tenancies and higher turnover. Who's the typical renter profile here, and what's been the actual vacancy rate?
- Crime grade is F in this area — have there been break-ins, vandalism, or insurance claims at this property in the last 3 years? What carrier currently insures it and at what premium?
- What's the average days-on-market for RENTAL listings here right now (not sales)? A rising rental-DOM trend means longer vacancies and softer asking-rent achievability than the comps imply.
- What's the recent tenant-quality profile in this submarket — average credit score on applications, eviction rate, late-payment / NSF rate, and stable-employment percentage? A property-management company in the area should have these aggregated.
- How much new for-sale + rental construction is in the pipeline within 1–3 miles? Heavy new supply typically softens prices + rents 12–24 months out; constrained supply supports both.
Investment metrics
- 1% rule
- 1.04% ✓
- Cap rate
- 6.59%
- Cash-on-cash
- 1.08%
- DSCR
- 1.05
- GRM
- 8.0
CMA / ARV
- ARV (on-the-fly)
- $241,042
- Comps found
- 12
Show comp detail 12 sales within ~0.75 mi
| Address | Dist | Beds/Ba | Sqft | Sold | Price | $/sf | Match |
|---|---|---|---|---|---|---|---|
| 19 Earl Dr | 0.00mi | 2/1.0 | 1,262 (0%) | 0mo | $285,000 | $226 | 100 |
| 24 Battle Green Dr | 0.33mi | 2/1.5 | 1,266 (+0%) | 9mo | $241,906 | $191 | 74 |
| 154 Westside Dr | 0.32mi | 3/1.5 (+1) | 1,222 (-3%) | 5mo | $285,000 | $233 | 69 |
| 142 Westside Dr | 0.32mi | 3/1.5 (+1) | 1,350 (+7%) | 8mo | $213,000 | $158 | 60 |
| 123 Rowley Dr | 0.54mi | 3/1.0 (+1) | 1,209 (-4%) | 5mo | $176,000 | $146 | 58 |
| 28 Berna Ln | 0.71mi | 3/1.5 (+1) | 1,258 (-0%) | 10mo | $190,000 | $151 | 51 |
| 151 Rowley Dr | 0.51mi | 3/2.0 (+1) | 1,380 (+9%) | 6mo | $210,000 | $152 | 46 |
| 751 Marshall Rd | 0.50mi | 3/2.5 (+1) | 1,391 (+10%) | 6mo | $349,900 | $252 | 44 |
| 2467 Chili Ave | 0.62mi | 3/1.0 (+1) | 1,410 (+12%) | 6mo | $220,000 | $156 | 42 |
| 19 Berna Ln | 0.69mi | 3/1.0 (+1) | 1,092 (-14%) | 1mo | $260,000 | $238 | 39 |
| 4 Entress Dr | 0.74mi | 2/1.0 | 1,090 (-14%) | 10mo | $210,000 | $193 | 34 |
| 20 Audabon Ter | 0.66mi | 3/1.5 (+1) | 1,090 (-14%) | 7mo | $165,000 | $151 | 34 |
Match score weights: distance 35% · size 25% · config 20% · recency 20%. Top-matched comps best support the ARV.
Projected returns pro-forma
-3.0% appreciation · 3.0% rent growth · sell at horizon
- IRR
- -14.5%
- Equity multiple
- 0.48×
- Total profit
- $-27,582
- Equity at exit
- $28,315
- IRR
- -5.6%
- Equity multiple
- 0.63×
- Total profit
- $-19,496
- Equity at exit
- $16,419
Cash invested: $53,172 (down + closing). Projections, not guarantees.
Landlord ↔ Tenant lean methodology
- Overall (STATE)
- 15 Strongly Tenant-Friendly
- State New York
- 15 Strongly Tenant-Friendly · D+10
- County
- — inherits STATE
- City
- — inherits STATE
ZIP-level market 14624
- Active inventory
- 127
- Price-to-rent
- 8.0×
Monthly cashflow live
- Estimated rent
- $1,968 medium interval (Pro) →
- Mortgage (P&I)
- −$996
- Tax from tax record
- −$432 /mo · $5,182/yr
- Insurance
- −$79
- HOA
- −$0
- Vacancy / Maint / Mgmt
- −$413
- Net cashflow
- $48
Break-even live
Sensitivity live
| Price | -10% $155 | -5% $101 | +0% $48 | +5% $-6 | +10% $-60 |
|---|---|---|---|---|---|
| Rent | -10% $-108 | -5% $-30 | +0% $48 | +5% $125 | +10% $203 |
| Rate | -1.0pp $143 | -0.5pp $96 | base $48 | +0.5pp $-1 | +1.0pp $-52 |
UW: 25.0% down · 7.5% · 30yr · 1.5% tax · 5.0% vac · 8.0% maint · 8.0% mgmt
Financing live
Cash to close
- Down payment
- $47,475
- Closing costs
- $5,697
- Reserves months
- —
- Total cash needed
- —
Loan-product check · same deal, 3 products live
Conventional
25% down · 7.5% · 30yr
- Down + closing
- —
- Monthly P&I
- —
- Monthly cashflow
- —
- DSCR
- —
- Eligible?
- —
Personal DTI + credit; lowest rate.
DSCR
20% down · 8.5% · 30yr
- Down + closing
- —
- Monthly P&I
- —
- Monthly cashflow
- —
- DSCR
- —
- Eligible?
- —
No personal income docs; deal must DSCR.
Hard money
10% down · 12.0% · 12mo
- Down + closing
- —
- Monthly P&I
- —
- Monthly cashflow
- —
- DSCR
- —
- Eligible?
- —
Short-term bridge; refi at stabilization.
Rent comps 3 comps
| Address | Beds | Baths | Sqft | Rent | $/sqft | DOM | Units | Dist |
|---|---|---|---|---|---|---|---|---|
| 456 Westside Dr Unit 6 Rochester, NY | 2.0 | 2.0 | 994 | $2,100 | $2.11 | 5d | 1 | 0.56mi |
| 254 Fisher Rd Rochester, NY | 2.0 | 1.0 | 1100 | $2,250 | $2.05 | 45d | 1 | 0.85mi |
| 266 Fisher Rd Rochester, NY | 2.0 | 2.0 | 1100 | $1,800 | $1.64 | 45d | 1 | 0.88mi |
Listing history 8 events
-
2026-04-22status Pending
-
2026-04-14$189,900 Active
-
2016-07-21soldstatus $114,900
-
2016-07-19soldstatus $114,900 Closed Sale or Rented 429-char remark
Show marketing remark (429 chars)
Welcome to 19 Earl Drive!!! Wonderful open concept Ranch home, Some of the Many updates include a newly remodeled Kitchen with Edged counters, New tile backsplash and Crown molding, new light fixtures and tile flooring, you'll love the Custom built fireplace with granite hearth, New 6 panel doors and knobs, Freshly painted throughout, TONs of potential in the semi finished basement, newer Furnace and A/C, call today. .. .. ..
-
2016-02-04$114,900 429-char remark
Show marketing remark (429 chars)
Welcome to 19 Earl Drive!!! Wonderful open concept Ranch home, Some of the Many updates include a newly remodeled Kitchen with Edged counters, New tile backsplash and Crown molding, new light fixtures and tile flooring, you'll love the Custom built fireplace with granite hearth, New 6 panel doors and knobs, Freshly painted throughout, TONs of potential in the semi finished basement, newer Furnace and A/C, call today. .. .. ..
-
2010-05-13soldstatus $84,000
-
2010-05-02soldstatus $84,000 129-char remark
Show marketing remark (129 chars)
Charming 2 bedroom with possible 3rd. Priced well below assessed value!!! Needs some TLC. Price reflects work needed to be done.
-
2010-02-22$79,900 129-char remark
Show marketing remark (129 chars)
Charming 2 bedroom with possible 3rd. Priced well below assessed value!!! Needs some TLC. Price reflects work needed to be done.
ⓘ Source: listings_history table (triggers on properties + properties_extension) + one-shot
backfill from property_details.listing_events for pre-trigger history.
Tax reassessment forecast NY · Partial reset (capped growth)
- Current annual tax
- $5,182 · $432/mo
- Projected year-2 tax
- $5,182 · $432/mo
- Expected delta
- $0/yr ($0/mo · 0.0%)
ⓘ Screening estimate from a state-policy table — verify with the county assessor before closing.
Climate risk First Street
- Flood 1/10 Low FEMA zone X (unshaded) · 0% chance over 30 yrs
- Wildfire 1/10 Low
- Heat 2/10 Low 7 d/yr ≥95°F today · 15 d/yr by 30 yrs out
- Wind 1/10 Low
- Air quality 2/10 Low 1 unhealthy d/yr today · 1 by 30 yrs out
Nearby sold comps map
Loading sold comps map…
Walkable amenities ~0.75 mi
Loading nearby amenities…
Taxation est. · year 1
- Rental income
- $23,614
- − Mortgage interest
- −$10,637
- − Property taxes
- −$5,182
- − Insurance
- −$950
- − Repairs & maintenance
- −$1,889
- − Management
- −$1,889
- − Depreciation
- −$5,524
- Taxable loss
- −$2,458
- Est. tax savings @ 24.0%
- +$590
- After-tax cash flow
- $1,163/yr
For passive investors: Depreciation is non-cash, so a rental often shows a tax loss while cash-flowing — sheltering income. Rental losses are passive: they offset passive income freely, and up to $25,000/yr can offset ordinary (W-2) income if you actively participate and your MAGI is under $100k (phasing out to $0 by $150k); unused losses carry forward. On sale, claimed depreciation is recaptured at up to 25%, and gains may owe capital-gains tax (a 1031 exchange can defer both). Figures are a year-1 estimate at your 24.0% rate — not tax advice; consult a CPA.
Schools (NCES district)
- District
- Gates-Chili Central School District
- NCES district ID
- 3611880
- Math proficiency
- 41% ▼ -12.00%
- Reading proficiency
- 42% ▼ -6.00%
- Median HH income
- $55,045
- Composite
- 36.23/100
- National rank
- #4719
- State rank
- #491 of 590 in NY
Livability — Rochester
- Score
- 76/100
- State rank
- #222
- US rank
- #3482
Category grades
Schools grade is shown separately in the Schools card above.
Census & demographics
- County
- Monroe County · 674,131 people
- City population
- 432,803
- Metro
- Rochester, NY
- Population (ZIP)
- 38,626
- Household income
- $87,989
- Rent vs Own
- Severe rent burden
- 584.0
Population outlook (Monroe County) Hauer SSP2
- Today (2025)
- 759,460 people
- By 2030
- 757,154 · -0.3%
- By 2040
- 740,644 · -2.5%
- By 2050
- 714,443 · -5.9%
- By 2075
- 645,883 · -15.0%
- By 2100
- 547,084 · -28.0%
Race, ethnicity, and origin ACS 2023
- Neighborhood character
- Predominantly White (78%)
- Race & ethnicity
- White 78% Black 9% Hispanic / Latino 6% Two or more races 5% Asian 3%
- Hispanic origin (detail)
- Puerto Rican 4%
- Common ancestry
- Romanian 6% Iranian 2% Lithuanian 2%
- Foreign-born
- 7% · Canada, China, India
- Languages at home
- 90% English-only · Spanish 3% Other Indo-European 3% Russian/Polish/Slavic 1%
Political lean MEDSL · Monroe
- 2024 margin
- D (+19.1) · D 59.5% · R 40.5%
- 2008→2024 swing
- +1.4pp toward D · 2008: 17.7pp · 2024: 19.1pp
- All cycles
- 2024: D+19.1 2020: D+21.0 2016: D+14.1 2012: D+17.4 2008: D+17.7
Not yet ingested
- Civics
- —
Market trends
- HPI YoY
- ▼ -151.26%
- Current HPI
- 267.356
- Rent YoY
- —
- Metro
- Rochester, NY
- State GDP YoY
- ▲ 2.60%
- F500 in state
- 92
Industry mix (Fortune 500 HQ in NY)
| Industry | F500 HQs | Revenue |
|---|---|---|
| Financial Services | 10 | $950B |
|
||
| Consumer Goods | 9 | $162B |
|
||
| Insurance | 4 | $225B |
|
||
| Telecommunications | 2 | $144B |
|
||
| Pharmaceuticals | 2 | $112B |
|
||
| Media / Entertainment | 2 | $69B |
|
||
Price history
+137.7% since first listed8 events — show timeline
- 2026-04-22 Pending — UNYREIS
- 2026-04-14 Listed $189,900 UNYREIS
- 2016-07-21 Sold (Public Records) $114,900 Public Records
- 2016-07-19 Sold (MLS) $114,900 UNYREIS
- 2016-02-04 Listed $114,900 UNYREIS
- 2010-05-13 Sold (Public Records) $84,000 Public Records
- 2010-05-02 Sold (MLS) $84,000 UNYREIS
- 2010-02-22 Listed $79,900 UNYREIS
Property tax history
+4.4%/yrLatest (2025): $5,182 · -7.5% YoY. Source: county tax records.
Cash-flow waterfall
monthlySold comps — $/sqft
last 12 mo · ≤1 miLoading sold comps…