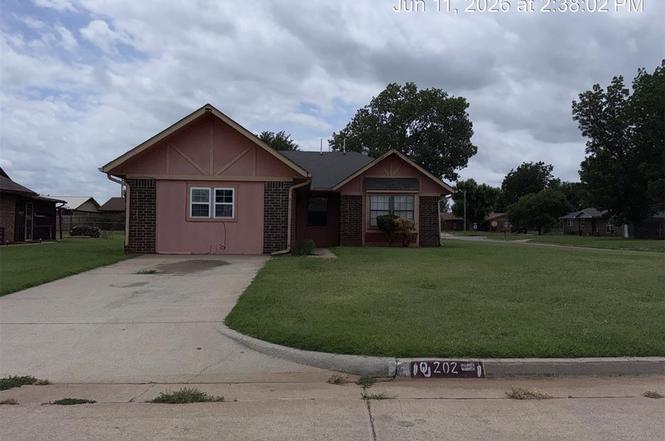
202 Redbud Dr · Anadarko, OK
Flood risk 1/10 · Minimal
- FEMA flood zone
- X (unshaded)
- Chance of flooding over 30 yrs
- 0.0%
- Est. flood insurance / yr
- $507 – $1,088
Fire risk 9/10 · Severe
- Est. fire insurance / yr
- $2,463 – $4,575
Heat risk 6/10 · Moderate
- Hot days now (above 107°F)
- 7 days/yr
- Hot days in 30 yrs
- 20 days/yr
Wind risk 2/10 · Minimal
- Chance of severe wind over 30 yrs
- 4.0%
Air-quality risk 2/10 · Minimal
- Unhealthy air days now
- 1 days/yr
- Unhealthy air days in 30 yrs
- 1 days/yr
Risk factors via First Street. Map © Google.
Why this score? — see what drove the B grade
The composite is a weighted blend of 9 inputs, each scored 0–100. Each bar is that input's sub-score; the figure is the points it added to the 100-point composite (weight × sub-score).
- Cash flow +30.0/30.0
- ARV discount +15.0/15.0
- DSCR +10.0/10.0
- 1% rule +7.7/10.0
- Livability +2.9/5.0
- Appreciation +2.8/10.0
- Rent growth +2.5/5.0
- Condition / age +2.5/5.0
- Schools +1.1/10.0
$64,400
🖨 Deal sheet 📄 Offer letter ✓ Due diligence
Listing remarks
Come check this house out! Large corner lot with brick/frame veneer, converted garage that has a closet so makes a 4th bedroom or 2nd living area. Kitchen has open pass-through window/ bar into living area. Kitchen has abundant cabinets with electrical and gas hook up present for a range. Inside utility room off of the kitchen and kitchen has side exterior door. Built in cabinets line the hallway from living area to the bedroom areas. Master bedroom has large half bathroom with lots of vanity space. Hall bathroom has large stand in shower and but no tub. Living area has a combination of living/dining space. Covered front porch. This home is ready for your imagination as it needs to be updat
Key facts
- Abundant cabinets
- Converted garage
- Inside utility room
Tags
Property features AI
Finance
- Other: Living area reported as 1,436 (assessor); Approximately 0.203 acre lot
- Financial info: Not assumable; Does not apply for loan qualification; REO / Bank owned; Not occupied; Home warranty not provided
- HOA & community: No mandatory association dues
Exterior
- Parking: Concrete parking
- Utilities: Electricity available; Natural gas available; Public utilities
- Home design: Single family residence; One story; Residential property; Located in Town & Country addition
- Construction: Brick & frame construction; Composition roof; Slab foundation; Built (existing)
- Exterior features: Outbuildings; Corner lot
Interior
- Bedrooms: Four bedrooms
- Bathrooms: One full bathroom; One half bathroom
- Interior features: Six living areas; One dining area; No fireplace
Neighborhood map
What this means for you Summary
Snapshot
- This is a 4-bed/1.5-bath single-family listed at $64k.
Deal economics
- At list price, monthly cash flow is $248 ($3k/yr) — positive.
- The deal already cash-flows at list — no discount required.
- Meets the 1% rule at list price ($820 rent vs $64k).
Location & tenants
- Location reads 57/100 on livability (#483 in OK) — a working-class tenant base; expect higher turnover. Strengths: cost of living A+, housing A+; Watch: crime F, amenities F, commute F.
- Anadarko (town): math 12% / reading 14% proficiency, ranked #245 of 270 in OK (top 91%) — low school quality limits family demand, transient renter base, plan for 1-2y turnover; 75% free/reduced lunch — lower-income household profile, screen leases tightly.
- Zoned schools: Anadarko East Es (math 27% / reading 17%, grade F, #413 of 845 statewide, top 54%, 306 students, 0% FRL); Anadarko Hs (math 12% / reading 12%, grade F, #359 of 447 statewide, top 80%, 409 students, 0% FRL) — zoned schools average 0% FRL vs 75% district-wide (75 pts lower); this property's tenant base skews higher-income than the district average.
- Market conditions: 30 active listings in the ZIP; 1 comparable units currently listed for rent nearby.
Forward outlook
- Local home prices are declining (-3.0%/yr); year-one equity from $445 of loan paydown is wiped out by about $2k of value loss. Plan a longer hold.
- Caddo County population projected to shrink 7% by 2050 — rents likely to lag national; underwrite the cash flow, not the appreciation.
- At projected returns (-3.0% appreciation + 3.0% rent growth), your $18k cash investment doubles in ~8 years — after that, you're playing with house money.
Negotiation context
- Only 3 days on market — expect competitive offers; lowballing is unlikely to land.
Risks & watch-outs
- Climate carrying-cost: severe wildfire risk; extreme-heat days projected 7→20/yr by 2055 (HVAC capex compounding) — expect insurance premiums to compound above CPI over the hold.
Questions for the listing agent
- Built in 1975 — when were the roof, HVAC, electrical panel, plumbing, and water heater last replaced?
- Is there a deadline driving the sale (1031 exchange, divorce, estate, relocation)? That informs how much negotiation room exists.
- Schools are F-rated, which usually means shorter tenancies and higher turnover. Who's the typical renter profile here, and what's been the actual vacancy rate?
- Crime grade is F in this area — have there been break-ins, vandalism, or insurance claims at this property in the last 3 years? What carrier currently insures it and at what premium?
- What's the average days-on-market for RENTAL listings here right now (not sales)? A rising rental-DOM trend means longer vacancies and softer asking-rent achievability than the comps imply.
- What's the recent tenant-quality profile in this submarket — average credit score on applications, eviction rate, late-payment / NSF rate, and stable-employment percentage? A property-management company in the area should have these aggregated.
- How much new for-sale + rental construction is in the pipeline within 1–3 miles? Heavy new supply typically softens prices + rents 12–24 months out; constrained supply supports both.
Investment metrics
- 1% rule
- 1.27% ✓
- Cap rate
- 10.92%
- Cash-on-cash
- 16.53%
- DSCR
- 1.74
- GRM
- 6.5
CMA / ARV
- ARV (on-the-fly)
- $114,880
- Comps found
- 2
Show comp detail 2 sales within ~0.75 mi
| Address | Dist | Beds/Ba | Sqft | Sold | Price | $/sf | Match |
|---|---|---|---|---|---|---|---|
| 105 Moran Dr | 0.09mi | 3/2.0 (-1) | 1,536 (+7%) | 12mo | $123,000 | $80 | 67 |
| 204 NE 7th St | 0.60mi | 3/1.0 (-1) | 1,561 (+9%) | 13mo | $15,000 | $10 | 40 |
Match score weights: distance 35% · size 25% · config 20% · recency 20%. Top-matched comps best support the ARV.
Projected returns pro-forma
-3.0% appreciation · 3.0% rent growth · sell at horizon
- IRR
- 7.6%
- Equity multiple
- 1.30×
- Total profit
- $5,365
- Equity at exit
- $9,602
- IRR
- 16.9%
- Equity multiple
- 2.38×
- Total profit
- $24,974
- Equity at exit
- $5,568
Cash invested: $18,032 (down + closing). Projections, not guarantees.
Landlord ↔ Tenant lean methodology
- Overall (STATE)
- 83 Strongly Landlord-Friendly
- State Oklahoma
- 83 Strongly Landlord-Friendly · R+20
- County
- — inherits STATE
- City
- — inherits STATE
ZIP-level market 73005
- Home prices YoY
- -3.2%
- Active inventory
- 30
- Price-to-rent
- 6.5×
Monthly cashflow live
- Estimated rent
- $820 medium interval (Pro) →
- Mortgage (P&I)
- −$338
- Tax from tax record
- −$35 /mo · $419/yr
- Insurance
- −$27
- HOA
- −$0
- Vacancy / Maint / Mgmt
- −$172
- Net cashflow
- $248
Break-even live
UW: 25.0% down · 7.5% · 30yr · 1.5% tax · 5.0% vac · 8.0% maint · 8.0% mgmt
Financing live
Cash to close
- Down payment
- $16,100
- Closing costs
- $1,932
- Reserves months
- —
- Total cash needed
- —
Loan-product check · same deal, 3 products live
Conventional
25% down · 7.5% · 30yr
- Down + closing
- —
- Monthly P&I
- —
- Monthly cashflow
- —
- DSCR
- —
- Eligible?
- —
Personal DTI + credit; lowest rate.
DSCR
20% down · 8.5% · 30yr
- Down + closing
- —
- Monthly P&I
- —
- Monthly cashflow
- —
- DSCR
- —
- Eligible?
- —
No personal income docs; deal must DSCR.
Hard money
10% down · 12.0% · 12mo
- Down + closing
- —
- Monthly P&I
- —
- Monthly cashflow
- —
- DSCR
- —
- Eligible?
- —
Short-term bridge; refi at stabilization.
Rent comps 1 comps
| Address | Beds | Baths | Sqft | Rent | $/sqft | DOM | Units | Dist |
|---|---|---|---|---|---|---|---|---|
| 404 E Texas Dr Anadarko, OK | 3.0 | 1.0 | 1023 | $820 | $0.80 | 1d | 1 | 1.04mi |
Listing history 15 events
-
2026-06-18days on market $64,400 Active 3 DOM
-
2026-06-17days on market $64,400 Active 2 DOM
-
2026-06-16days on market $64,400 Active 1 DOM
-
2026-06-15days on market $64,400 Active 150 DOM
-
2026-06-13days on market $64,400 Active 148 DOM
-
2026-06-12days on market $64,400 Active 147 DOM
-
2026-06-09days on market $64,400 Active 144 DOM
-
2026-06-08days on market $64,400 Active 143 DOM
-
2026-06-08days on market $64,400 Active 142 DOM
-
2026-06-07days on market $64,400 Active 141 DOM
-
2026-06-04days on market $64,400 Active 139 DOM
-
2026-05-31days on market $64,400 Active 138 DOM
-
2026-04-03price $64,400
-
2026-02-13price $67,700
-
2026-01-13$73,500 Active
ⓘ Source: listings_history table (triggers on properties + properties_extension) + one-shot
backfill from property_details.listing_events for pre-trigger history.
Tax reassessment forecast OK · Resets to sale price
- Current annual tax
- $419 · $35/mo
- Projected year-2 tax
- $580 · $48/mo
- Expected delta
- +$161/yr (+$13/mo · 38.3%)
ⓘ Screening estimate from a state-policy table — verify with the county assessor before closing.
Climate risk First Street
- Flood 1/10 Low FEMA zone X (unshaded) · 0% chance over 30 yrs
- Wildfire 9/10 Extreme
- Heat 6/10 Major 7 d/yr ≥107°F today · 20 d/yr by 30 yrs out
- Wind 2/10 Low 4% chance of damaging wind over 30 yrs
- Air quality 2/10 Low 1 unhealthy d/yr today · 1 by 30 yrs out
Nearby sold comps map
Loading sold comps map…
Walkable amenities ~0.75 mi
Loading nearby amenities…
Taxation est. · year 1
- Rental income
- $9,840
- − Mortgage interest
- −$3,607
- − Property taxes
- −$419
- − Insurance
- −$322
- − Repairs & maintenance
- −$787
- − Management
- −$787
- − Depreciation
- −$1,873
- Taxable income
- $2,044
- Est. tax owed @ 24.0%
- −$490
- After-tax cash flow
- $2,489/yr
For passive investors: Depreciation is non-cash, so a rental often shows a tax loss while cash-flowing — sheltering income. Rental losses are passive: they offset passive income freely, and up to $25,000/yr can offset ordinary (W-2) income if you actively participate and your MAGI is under $100k (phasing out to $0 by $150k); unused losses carry forward. On sale, claimed depreciation is recaptured at up to 25%, and gains may owe capital-gains tax (a 1031 exchange can defer both). Figures are a year-1 estimate at your 24.0% rate — not tax advice; consult a CPA.
Schools (NCES district)
- District
- Anadarko
- NCES district ID
- 4003000
- Math proficiency
- 12% ▼ -9.00%
- Reading proficiency
- 14% ▼ -11.00%
- Median HH income
- $34,887
- Composite
- 10.66/100
- National rank
- #9772
- State rank
- #245 of 270 in OK
Livability — Anadarko
- Score
- 57/100
- State rank
- #483
- US rank
- #22161
Category grades
Schools grade is shown separately in the Schools card above.
Census & demographics
- Census place
- Anadarko, OK
- Population (ZIP)
- 7,760
Population outlook (Caddo County) Hauer SSP2
- Today (2025)
- 28,391 people
- By 2030
- 27,844 · -1.9%
- By 2040
- 27,057 · -4.7%
- By 2050
- 26,484 · -6.7%
- By 2075
- 26,266 · -7.5%
- By 2100
- 26,077 · -8.2%
Race, ethnicity, and origin ACS 2023
- Neighborhood character
- Highly diverse neighborhood (Simpson 0.85)
- Race & ethnicity
- White 34% Native American 34% Two or more races 18% Hispanic / Latino 16% Black 6%
- Hispanic origin (detail)
- Mexican 13%
- Common ancestry
- Lithuanian 2% Iranian 2% Slovak 1%
- Foreign-born
- 3% · Canada
- Languages at home
- 92% English-only · Spanish 6%
Political lean MEDSL · Caddo
- 2024 margin
- Solid R (+47.1) · D 25.4% · R 72.5% · Other 2.1%
- 2008→2024 swing
- -16.4pp toward R · 2008: -30.7pp · 2024: -47.1pp
- All cycles
- 2024: R+47.1 2020: R+44.0 2016: R+43.4 2012: R+28.5 2008: R+30.7
Not yet ingested
- Civics
- —
Market trends
- HPI YoY
- ▼ -4.47%
- Current HPI
- 134.1528
- Rent YoY
- —
- Metro
- —
- State GDP YoY
- ▲ 1.55%
- F500 in state
- 6
Industry mix (Fortune 500 HQ in OK)
| Industry | F500 HQs | Revenue |
|---|---|---|
| Energy | 3 | $48B |
|
||
Price history
-12.4% since first listed3 events — show timeline
- 2026-04-03 Price Changed $64,400 MLSOK
- 2026-02-13 Price Changed $67,700 MLSOK
- 2026-01-13 Listed $73,500 MLSOK
Property tax history
+6.3%/yrLatest (2025): $419 · +33.4% YoY. Source: county tax records.
Cash-flow waterfall
monthlySold comps — $/sqft
last 12 mo · ≤1 miLoading sold comps…