300 N Center St · Marshall, AR
Flood risk No data
- FEMA flood zone
- —
- Chance of flooding over 30 yrs
- —
- Est. flood insurance / yr
- —
Fire risk No data
- Est. fire insurance / yr
- —
Heat risk No data
- Hot days now (above threshold)
- —
- Hot days in 30 yrs
- —
Wind risk No data
- Chance of severe wind over 30 yrs
- —
Air-quality risk No data
- Unhealthy air days now
- —
- Unhealthy air days in 30 yrs
- —
Risk factors via First Street. Map © Google.
Why this score? — see what drove the C+ grade
The composite is a weighted blend of 9 inputs, each scored 0–100. Each bar is that input's sub-score; the figure is the points it added to the 100-point composite (weight × sub-score).
- Cash flow +24.8/30.0
- ARV discount +10.3/15.0
- DSCR +8.0/10.0
- 1% rule +5.3/10.0
- Appreciation +5.0/10.0
- Livability +3.3/5.0
- Schools +3.2/10.0
- Rent growth +2.5/5.0
- Condition / age +2.5/5.0
$100,000
🖨 Deal sheet (PDF) 📄 Offer letter ✓ Due diligence
Listing remarks MLS
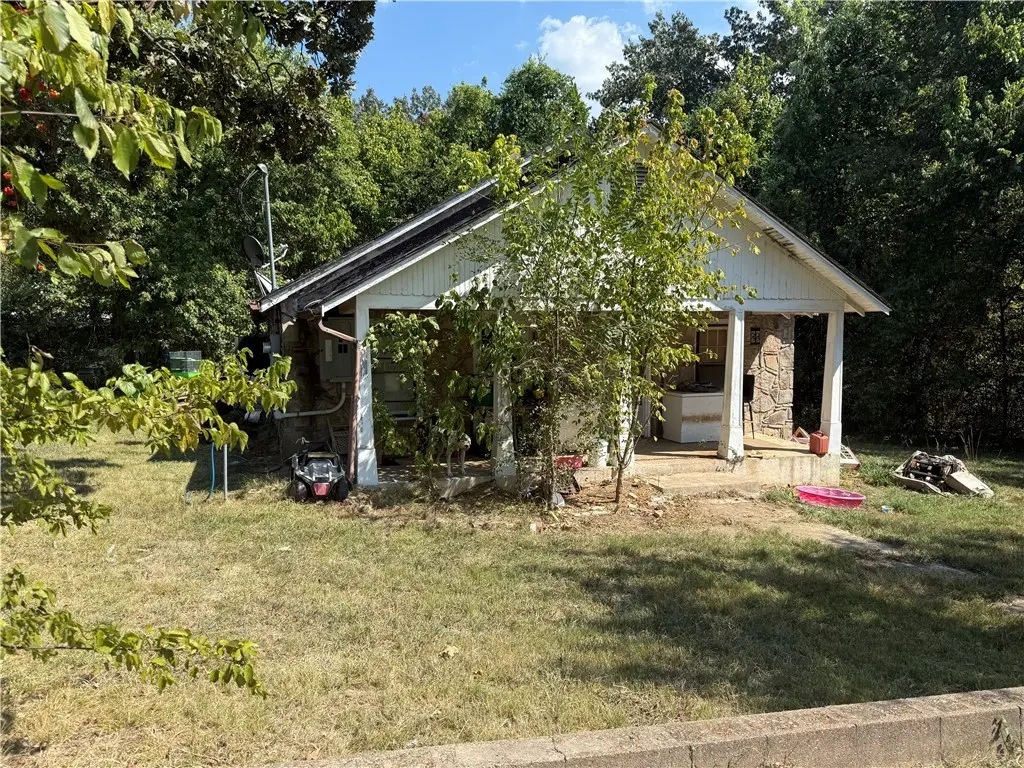
Charming stone exterior home with investment potential! This 3 bedroom, 1 bath property is currently being used as a rental and offers plenty of opportunity as a fixer upper. Features include central heat and air, spacious layout, and a classic stone façade. With updates and repairs, this home could make a comfortable residence or continue as a steady income-producing rental. Convenient location in Marshall close to schools, shopping, and downtown amenities.
Key facts
- Close to schools
- Central heat and air
- Classic stone façade
Tags
Neighborhood map
What this means for you Summary
Snapshot
- This is a 3-bed/1.0-bath single-family listed at $100k.
Deal economics
- At list price, monthly cash flow is $212 ($3k/yr) — positive.
- The deal already cash-flows at list — no discount required.
- Meets the 1% rule at list price ($1k rent vs $100k).
- Recommended offer: $88k (12.0% below list) — sets the bar for market timing.
- Cap rate 8.8% vs local median 3.5% in Marshall — top-decile yield for the area; either an underpriced asset or a hidden risk that comps aren't pricing in. Stress-test before assuming the spread holds.
Location & tenants
- Location reads 66/100 on livability (#115 in AR) — a middle-class / working-renter tenant base. Strengths: cost of living A+, housing A+, health & safety A+; Watch: crime D-, amenities F, commute F.
- Searcy County School District (rural): math 39% / reading 40% proficiency, ranked #82 of 238 in AR (top 34%) — families likely to look elsewhere, expect single-tenant / working-renter base with shorter leases.
- Zoned schools: Marshall Elementary School (math 64% / reading 34%, grade D, #93 of 454 statewide, top 23%, 293 students, 99% FRL); Leslie Elementary School (math 47% / reading 37%, grade D-, #78 of 201 statewide, top 40%, 190 students, 98% FRL); Marshall High School (math 28% / reading 43%, grade F, #85 of 292 statewide, top 30%, 358 students, 99% FRL) — zoned schools average 99% FRL vs 57% district-wide (42 pts higher); higher-poverty schools than district average — tighter screening recommended.
- Market conditions: 80 active listings in the ZIP.
Forward outlook
- In year one you build about $4k of equity ($691 loan paydown + $3k appreciation (3.0% local appreciation)).
- Searcy County population projected at -26% by 2050 — secular population decline; favor cash flow + early exit over multi-decade hold.
- At projected returns (3.0% appreciation + 3.0% rent growth), your $28k cash investment doubles in ~5 years — after that, you're playing with house money.
- By year 9, paydown + projected appreciation supports a ~$31k cash-out refi (75% LTV) — recoverable capital for the next deal without selling this one.
Negotiation context
- It's been on market 264 days — a 12% lower offer ($88k) is reasonable based on typical stale-listing flexibility.
- Current owner paid $28k; list at $100k implies a 257% gain — meaningful room to come down on a strong offer.
Questions for the listing agent
- It's been on market 264 days. Have you received any prior offers? Is the seller open to a 12% concession, seller financing, or rate buy-down credit?
- Why hasn't it sold? Are there any deal-killer items the seller is aware of (foundation, flood, title, zoning, code violations)?
- Is there a deadline driving the sale (1031 exchange, divorce, estate, relocation)? That informs how much negotiation room exists.
- Schools are D-rated, which usually means shorter tenancies and higher turnover. Who's the typical renter profile here, and what's been the actual vacancy rate?
- Crime grade is D in this area — have there been break-ins, vandalism, or insurance claims at this property in the last 3 years? What carrier currently insures it and at what premium?
- What's the average days-on-market for RENTAL listings here right now (not sales)? A rising rental-DOM trend means longer vacancies and softer asking-rent achievability than the comps imply.
- What's the recent tenant-quality profile in this submarket — average credit score on applications, eviction rate, late-payment / NSF rate, and stable-employment percentage? A property-management company in the area should have these aggregated.
- How much new for-sale + rental construction is in the pipeline within 1–3 miles? Heavy new supply typically softens prices + rents 12–24 months out; constrained supply supports both.
Investment metrics
- 1% rule
- 1.03% ✓
- Cap rate
- 8.84%
- Cash-on-cash
- 9.08%
- DSCR
- 1.40
- GRM
- 8.1
CMA / ARV
- ARV (median comp)
- $106,574
- List price
- $100,000
- Delta
- -6.17%
- Verdict
- FAIR
- Comps
- 20 within 1.0 mi
Show comp detail 4 sales within ~0.75 mi
| Address | Dist | Beds/Ba | Sqft | Sold | Price | $/sf | Match |
|---|---|---|---|---|---|---|---|
| 208 N Center St | 0.04mi | 2/1.0 (-1) | 1,120 (0%) | 19mo | $40,000 | $36 | 77 |
| 405 Walnut St | 0.59mi | 3/2.0 | 1,088 (-3%) | 9mo | $154,000 | $142 | 56 |
| 404 Walnut St | 0.57mi | 2/1.0 (-1) | 1,274 (+14%) | 3mo | $64,500 | $51 | 43 |
| 404 Cedar St | 0.57mi | 3/2.0 | 1,220 (+9%) | 17mo | $120,000 | $98 | 40 |
Match score weights: distance 35% · size 25% · config 20% · recency 20%. Top-matched comps best support the ARV.
Projected returns pro-forma
3.0% appreciation · 3.0% rent growth · sell at horizon
- IRR
- 16.0%
- Equity multiple
- 1.91×
- Total profit
- $25,503
- Equity at exit
- $44,964
- IRR
- 17.6%
- Equity multiple
- 3.57×
- Total profit
- $71,842
- Equity at exit
- $69,295
Cash invested: $28,000 (down + closing). Projections, not guarantees.
Landlord ↔ Tenant lean methodology
- Overall (STATE)
- 92 Strongly Landlord-Friendly
- State Arkansas
- 92 Strongly Landlord-Friendly · R+14
- County
- — inherits STATE
- City
- — inherits STATE
ZIP-level market 72650
- Active inventory
- 80
- Price-to-rent
- 8.1×
Monthly cashflow live
- Estimated rent
- $1,034 medium interval (Pro) →
- Mortgage (P&I)
- −$524
- Tax from tax record
- −$39 /mo · $466/yr
- Insurance
- −$42
- HOA
- −$0
- Vacancy / Maint / Mgmt
- −$217
- Net cashflow
- $212
Break-even live
Sensitivity live
| Price | -10% $268 | -5% $240 | +0% $212 | +5% $184 | +10% $155 |
|---|---|---|---|---|---|
| Rent | -10% $130 | -5% $171 | +0% $212 | +5% $253 | +10% $294 |
| Rate | -1.0pp $262 | -0.5pp $237 | base $212 | +0.5pp $186 | +1.0pp $160 |
UW: 25.0% down · 7.5% · 30yr · 1.5% tax · 5.0% vac · 8.0% maint · 8.0% mgmt
Financing live
Cash to close
- Down payment
- $25,000
- Closing costs
- $3,000
- Reserves months
- —
- Total cash needed
- —
Loan-product check · same deal, 3 products live
Conventional
25% down · 7.5% · 30yr
- Down + closing
- —
- Monthly P&I
- —
- Monthly cashflow
- —
- DSCR
- —
- Eligible?
- —
Personal DTI + credit; lowest rate.
DSCR
20% down · 8.5% · 30yr
- Down + closing
- —
- Monthly P&I
- —
- Monthly cashflow
- —
- DSCR
- —
- Eligible?
- —
No personal income docs; deal must DSCR.
Hard money
10% down · 12.0% · 12mo
- Down + closing
- —
- Monthly P&I
- —
- Monthly cashflow
- —
- DSCR
- —
- Eligible?
- —
Short-term bridge; refi at stabilization.
Listing history 19 events
-
2026-06-21days on market $100,000 Active 264 DOM
-
2026-06-19days on market $100,000 Active 262 DOM
-
2026-06-18days on market $100,000 Active 261 DOM
-
2026-06-17days on market $100,000 Active 260 DOM
-
2026-06-16days on market $100,000 Active 259 DOM
-
2026-06-15days on market $100,000 Active 258 DOM
-
2026-06-14days on market $100,000 Active 256 DOM
-
2026-06-12days on market $100,000 Active 255 DOM
-
2026-06-09days on market $100,000 Active 252 DOM
-
2026-06-08days on market $100,000 Active 251 DOM
-
2026-06-07days on market $100,000 Active 250 DOM
-
2026-06-07days on market $100,000 Active 249 DOM
-
2026-06-04days on market $100,000 Active 246 DOM
-
2026-06-02days on market $100,000 Active 245 DOM
-
2026-06-01days on market $100,000 Active 244 DOM
-
2026-05-31days on market $100,000 Active 243 DOM
-
2026-05-31days on market $100,000 Active 242 DOM
-
2025-09-30$100,000 Active 469-char remark
Show marketing remark (469 chars)
Charming stone exterior home with investment potential! This 3 bedroom, 1 bath property is currently being used as a rental and offers plenty of opportunity as a fixer upper. Features include central heat and air, spacious layout, and a classic stone façade. With updates and repairs, this home could make a comfortable residence or continue as a steady income-producing rental. Convenient location in Marshall close to schools, shopping, and downtown amenities.
-
2004-07-20soldstatus $28,000
ⓘ Source: listings_history table (triggers on properties + properties_extension) + one-shot
backfill from property_details.listing_events for pre-trigger history.
Tax reassessment forecast AR · Resets to sale price
- Current annual tax
- $466 · $39/mo
- Projected year-2 tax
- $640 · $53/mo
- Expected delta
- +$174/yr (+$15/mo · 37.5%)
ⓘ Screening estimate from a state-policy table — verify with the county assessor before closing.
Nearby sold comps map
Loading sold comps map…
Walkable amenities ~0.75 mi
Loading nearby amenities…
Taxation est. · year 1
- Rental income
- $12,406
- − Mortgage interest
- −$5,602
- − Property taxes
- −$466
- − Insurance
- −$500
- − Repairs & maintenance
- −$993
- − Management
- −$993
- − Depreciation
- −$2,909
- Taxable income
- $945
- Est. tax owed @ 24.0%
- −$227
- After-tax cash flow
- $2,316/yr
For passive investors: Depreciation is non-cash, so a rental often shows a tax loss while cash-flowing — sheltering income. Rental losses are passive: they offset passive income freely, and up to $25,000/yr can offset ordinary (W-2) income if you actively participate and your MAGI is under $100k (phasing out to $0 by $150k); unused losses carry forward. On sale, claimed depreciation is recaptured at up to 25%, and gains may owe capital-gains tax (a 1031 exchange can defer both). Figures are a year-1 estimate at your 24.0% rate — not tax advice; consult a CPA.
Schools (NCES district)
- District
- Searcy County School District
- NCES district ID
- 0509480
- Math proficiency
- 39% ▼ -16.00%
- Reading proficiency
- 40% ▼ -10.00%
- Median HH income
- $31,222
- Composite
- 32.28/100
- National rank
- #5751
- State rank
- #82 of 238 in AR
Livability — Marshall
- Score
- 66/100
- State rank
- #115
- US rank
- #11273
Category grades
Schools grade is shown separately in the Schools card above.
Census & demographics
- Census place
- Marshall, AR
- Population (ZIP)
- 4,462
Population outlook (Searcy County) Hauer SSP2
- Today (2025)
- 7,091 people
- By 2030
- 6,656 · -6.1%
- By 2040
- 5,868 · -17.2%
- By 2050
- 5,250 · -26.0%
- By 2075
- 4,407 · -37.9%
- By 2100
- 3,834 · -45.9%
Race, ethnicity, and origin ACS 2023
- Neighborhood character
- Predominantly White (88%)
- Race & ethnicity
- White 88% Two or more races 9% Hispanic / Latino 3% Native American 2%
- Common ancestry
- Iranian 4% Romanian 2% Italian 1%
- Foreign-born
- 1% · Canada
- Languages at home
- 97% English-only · Spanish 2%
Political lean MEDSL · Searcy
- 2024 margin
- Solid R (+72.2) · D 13.2% · R 85.4% · Other 1.4%
- 2008→2024 swing
- -26.3pp toward R · 2008: -45.9pp · 2024: -72.2pp
- All cycles
- 2024: R+72.2 2020: R+69.1 2016: R+63.7 2012: R+51.0 2008: R+45.9
Not yet ingested
- Civics
- —
Market trends
- HPI YoY
- —
- Current HPI
- —
- Rent YoY
- —
- Metro
- —
- State GDP YoY
- ▲ 3.80%
- F500 in state
- 10
Industry mix (Fortune 500 HQ in AR)
| Industry | F500 HQs | Revenue |
|---|---|---|
| Retail | 1 | $681B |
|
||
| Food / Agriculture | 1 | $53B |
|
||
| Retail / Energy | 1 | $22B |
|
||
| Transportation / Logistics | 1 | $12B |
|
||
| Energy | 1 | $4B |
|
||
Price history
+257.1% since first listed2 events — show timeline
- 2025-09-30 Listed $100,000 NWARMLS
- 2004-07-20 Sold (Public Records) $28,000 Public Records
Property tax history
+4.1%/yrLatest (2025): $466 · +8.3% YoY. Source: county tax records.
Cash-flow waterfall
monthlySold comps — $/sqft
last 12 mo · ≤1 miLoading sold comps…