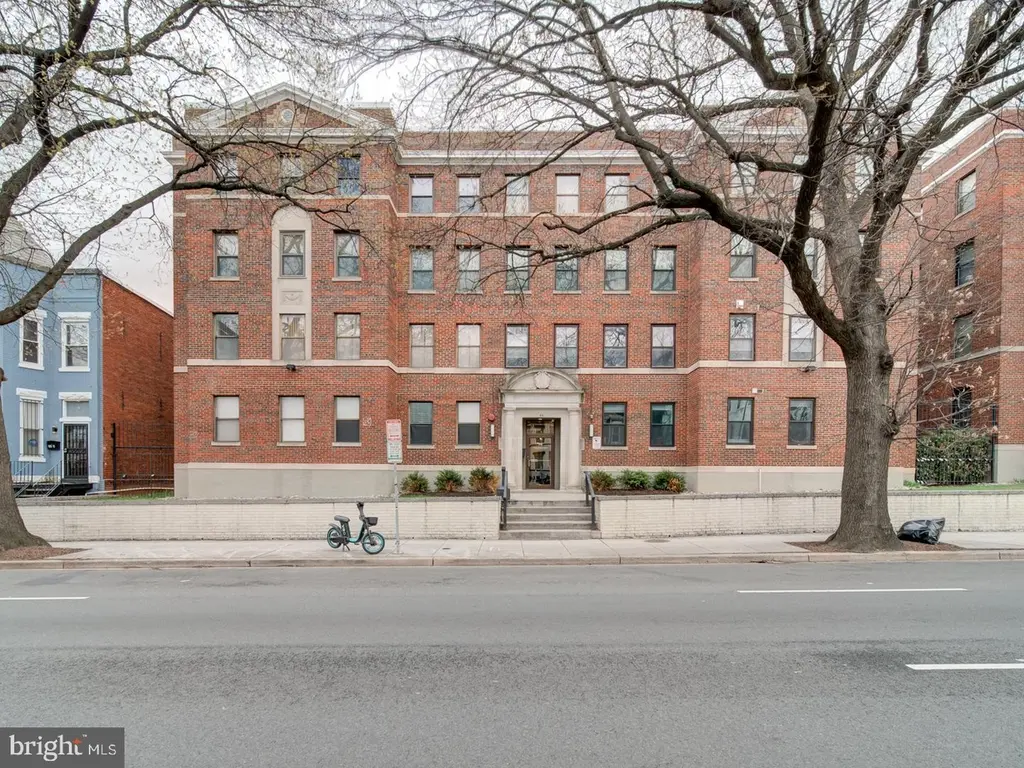
66 New York Ave NW #103 · Washington, DC
Flood risk 1/10 · Minimal
- FEMA flood zone
- X (unshaded)
- Chance of flooding over 30 yrs
- 0.0%
- Est. flood insurance / yr
- $507 – $1,088
Fire risk 1/10 · Minimal
- Est. fire insurance / yr
- $631 – $1,173
Heat risk 7/10 · Major
- Hot days now (above 106°F)
- 7 days/yr
- Hot days in 30 yrs
- 15 days/yr
Wind risk 4/10 · Minor
- Chance of severe wind over 30 yrs
- 18.0%
Air-quality risk 4/10 · Minor
- Unhealthy air days now
- 4 days/yr
- Unhealthy air days in 30 yrs
- 5 days/yr
Risk factors via First Street. Map © Google.
Why this score? — see what drove the D grade
The composite is a weighted blend of 9 inputs, each scored 0–100. Each bar is that input's sub-score; the figure is the points it added to the 100-point composite (weight × sub-score).
- Cash flow +14.1/30.0
- ARV discount +7.5/15.0
- 1% rule +6.2/10.0
- DSCR +4.3/10.0
- Livability +3.7/5.0
- Schools +3.6/10.0
- Condition / age +2.5/5.0
- Rent growth +2.3/5.0
- Appreciation +0.0/10.0
$205,000
🖨 Deal sheet (PDF) 📄 Offer letter ✓ Due diligence
Listing remarks
1BR/1BA condo in the heart of NOMA offering 689 sq ft and strong renovation potential. Located in a charming brick building built in 1925, this unit is full of character and ready for your vision. Property needs rehab and is being sold as a short sale. Conveniently located near shopping, dining, Metro, and all the amenities of this sought-after DC neighborhood. Great opportunity for investors or buyers looking to create value in a prime location.
Key facts
- $395 HOA
- Built 1925
- Listed 88 days
Tags
Property features AI
Finance
- Other: Property assessed as condominium; Property condition listed as below average; Year built and living area sourced from assessor
- HOA & community: Monthly condo fee of $395; Condo fee covers common area maintenance, exterior building maintenance, management, and snow removal; Pets allowed with no specific restrictions listed
Exterior
- Parking: On-street parking
- Utilities: Public water; Public sewer
- Home design: Garden-style building (1–4 floors); Unit/flat; Entry on level 1; Building name: Old City 2
- Construction: Brick construction; Above-grade finished living space per assessor
- Exterior features: Condominium in city limits; Common grounds
Interior
- Bedrooms: One bedroom on the main/entry level
- Bathrooms: One full bathroom on the main/entry level
- Interior features: No basement; Living area per assessor
- Laundry & utility: No in-unit washer/dryer or hookups
Neighborhood map
What this means for you Summary
Snapshot
- This is a 1-bed/1.0-bath condo listed at $205k.
Deal economics
- At list price, monthly cash flow is $29 ($343/yr) — positive.
- The deal already cash-flows at list — no discount required.
- Meets the 1% rule at list price ($2k rent vs $205k).
- Recommended offer: $193k (6.0% below list) — sets the bar for market timing.
- Cap rate 6.5% vs local median 2.5% in Washington — top-decile yield for the area; either an underpriced asset or a hidden risk that comps aren't pricing in. Stress-test before assuming the spread holds.
Location & tenants
- Location reads 73/100 on livability (#1 in DC) — a middle-class / working-renter tenant base. Strengths: amenities A+, commute A+, employment A+; Watch: crime F, cost of living F.
- District Of Columbia Public Schools (urban): math 33% / reading 40% proficiency, ranked #8 of 32 in DC (top 25%) — families likely to look elsewhere, expect single-tenant / working-renter base with shorter leases; 65% free/reduced lunch — lower-income household profile, screen leases tightly.
- Zoned schools: Walker-Jones Education Campus (337 students, 0% FRL); Dunbar Hs (868 students, 0% FRL) — zoned schools average 0% FRL vs 65% district-wide (65 pts lower); this property's tenant base skews higher-income than the district average.
- Market conditions: Rents soft (-0.8%/yr); 377 active listings in the ZIP; 40 comparable units currently listed for rent nearby; rentals leasing fast (median 10d on market — plan ~1-2 weeks tenant-placement turnaround); high-income renter base; 1,737 units permitted in District of Columbia in 2024 (1,506 in 5+ unit buildings).
Forward outlook
- Local home prices are declining (-3.0%/yr); year-one equity from $1k of loan paydown is wiped out by about $6k of value loss. Plan a longer hold.
- District of Columbia County population projected at +50% by 2050 — long-run rental-demand tailwind backs the buy-and-hold thesis.
Negotiation context
- It's been on market 88 days — a 6% lower offer ($193k) is reasonable based on typical stale-listing flexibility.
- 2 sale attempts since 6y ago with the ask held roughly flat each time — persistent listings suggest the price (not the market) is what's stuck; bring a comps-based counter.
- Current owner paid $35k; list at $205k implies a 481% gain — meaningful room to come down on a strong offer.
Risks & watch-outs
- Watch-outs: built in 1925 — expect roof / HVAC / electrical / plumbing capex.
- Climate carrying-cost: extreme-heat days projected 7→15/yr by 2055 (HVAC capex compounding) — expect insurance premiums to compound above CPI over the hold.
Questions for the listing agent
- It's been on market 88 days. Have you received any prior offers? Is the seller open to a 6% concession, seller financing, or rate buy-down credit?
- Built in 1925 — when were the roof, HVAC, electrical panel, plumbing, and water heater last replaced?
- What does the HOA fee cover, when was the last increase, and are there any pending special assessments or reserve-fund shortfalls?
- Any open or pending special assessments — roof, HVAC, plumbing, elevator, façade? What's the per-unit balance and payoff schedule, and is the seller paying it off at close or rolling it to the buyer?
- Why hasn't it sold? Are there any deal-killer items the seller is aware of (foundation, flood, title, zoning, code violations)?
- Is there a deadline driving the sale (1031 exchange, divorce, estate, relocation)? That informs how much negotiation room exists.
- Crime grade is F in this area — have there been break-ins, vandalism, or insurance claims at this property in the last 3 years? What carrier currently insures it and at what premium?
- The area grade is low — what's the realistic commute time and amenity access for the typical tenant pool here? Any planned neighborhood developments (good or bad) we should know about?
- What's the average days-on-market for RENTAL listings here right now (not sales)? A rising rental-DOM trend means longer vacancies and softer asking-rent achievability than the comps imply.
- What's the recent tenant-quality profile in this submarket — average credit score on applications, eviction rate, late-payment / NSF rate, and stable-employment percentage? A property-management company in the area should have these aggregated.
- How much new apartment / multifamily construction is in the pipeline within 1–3 miles? Heavy new supply (>2% of stock underway) typically softens rents 12–24 months out; light construction supports rent growth.
Investment metrics
- 1% rule
- 1.12% ✓
- Cap rate
- 6.46%
- Cash-on-cash
- 0.60%
- DSCR
- 1.03
- GRM
- 7.5
CMA / ARV
No comps found within radius.
Projected returns pro-forma
-3.0% appreciation · 0.0% rent growth · sell at horizon
- IRR
- -19.5%
- Equity multiple
- 0.34×
- Total profit
- $-37,857
- Equity at exit
- $30,566
- IRR
- -23.2%
- Equity multiple
- 0.03×
- Total profit
- $-55,533
- Equity at exit
- $17,725
Cash invested: $57,400 (down + closing). Projections, not guarantees.
Landlord ↔ Tenant lean methodology
- Overall (CITY)
- 0 Strongly Tenant-Friendly
- State District of Columbia
- 12 Strongly Tenant-Friendly · D+43
- County
- — inherits STATE
- City Washington
- 0 Strongly Tenant-Friendly · D+43
ZIP-level market 20001
- Rents YoY
- -0.8%
- Active inventory
- 377
- Price-to-rent
- 7.5×
Monthly cashflow live
- Estimated rent
- $2,293 high interval (Pro) →
- Mortgage (P&I)
- −$1,075
- Tax from tax record
- −$227 /mo · $2,727/yr
- Insurance
- −$85
- HOA
- −$395
- Vacancy / Maint / Mgmt
- −$481
- Net cashflow
- $29
Break-even live
Sensitivity live
| Price | -10% $145 | -5% $87 | +0% $29 | +5% $-29 | +10% $-87 |
|---|---|---|---|---|---|
| Rent | -10% $-153 | -5% $-62 | +0% $29 | +5% $119 | +10% $210 |
| Rate | -1.0pp $132 | -0.5pp $81 | base $29 | +0.5pp $-25 | +1.0pp $-79 |
UW: 25.0% down · 7.5% · 30yr · 1.5% tax · 5.0% vac · 8.0% maint · 8.0% mgmt
Financing live
Cash to close
- Down payment
- $51,250
- Closing costs
- $6,150
- Reserves months
- —
- Total cash needed
- —
Loan-product check · same deal, 3 products live
Conventional
25% down · 7.5% · 30yr
- Down + closing
- —
- Monthly P&I
- —
- Monthly cashflow
- —
- DSCR
- —
- Eligible?
- —
Personal DTI + credit; lowest rate.
DSCR
20% down · 8.5% · 30yr
- Down + closing
- —
- Monthly P&I
- —
- Monthly cashflow
- —
- DSCR
- —
- Eligible?
- —
No personal income docs; deal must DSCR.
Hard money
10% down · 12.0% · 12mo
- Down + closing
- —
- Monthly P&I
- —
- Monthly cashflow
- —
- DSCR
- —
- Eligible?
- —
Short-term bridge; refi at stabilization.
Rent comps 40 comps
| Address | Beds | Baths | Sqft | Rent | $/sqft | DOM | Units | Dist |
|---|---|---|---|---|---|---|---|---|
| 22 Banner Ln #854 Washington, DC | 1.0 | 1.0 | 732 | $2,450 | $3.35 | 18d | 1 | 0.10mi |
| 44 Banner Ln Washington, DC | 2.0 | 1.0–2.0 | 865 | $2,284 | $2.64 | 0d | 58 | 0.11mi |
| 2 M St NE Washington, DC | 2.0 | 1.0–2.0 | 832 | $2,658 | $3.19 | 0d | 39 | 0.12mi |
| 7 M St NE Washington, DC | 2.0 | 1.0–2.0 | 821 | $2,738 | $3.34 | 0d | 30 | 0.14mi |
| 22 M St NE Washington, DC | 2.0 | 1.0–2.0 | 815 | $2,941 | $3.61 | 1d | 6 | 0.16mi |
| 1324 N Capitol St NE Unit 005 Washington, DC | 1.0 | 1.0 | 531 | $1,699 | $3.20 | 26d | 1 | 0.17mi |
| 1324 N Capitol St NE Unit 309 Washington, DC | 1.0 | 1.0 | 611 | $2,199 | $3.60 | 26d | 1 | 0.17mi |
| 1324 N Capitol St NE Unit 107 Washington, DC | 1.0 | 1.0 | 560 | $1,899 | $3.39 | 26d | 1 | 0.17mi |
| 1324 N Capitol St NE Unit 105 Washington, DC | 1.0 | 1.0 | 519 | $1,799 | $3.47 | 26d | 1 | 0.17mi |
| 1324 N Capitol St NE Unit 210 Washington, DC | — | 1.0 | 461 | $1,599 | $3.47 | 26d | 1 | 0.17mi |
| 1324 N Capitol St NE Unit 203 Washington, DC | — | 1.0 | 389 | $1,499 | $3.85 | 26d | 1 | 0.17mi |
| 1324 N Capitol St NE Unit 205 Washington, DC | 1.0 | 1.0 | 569 | $2,099 | $3.69 | 9d | 1 | 0.17mi |
| 1324 N Capitol St NE Unit 601 Washington, DC | 1.0 | 1.0 | 610 | $2,799 | $4.59 | 26d | 1 | 0.17mi |
| 1324 N Capitol St NE Unit 206 Washington, DC | 1.0 | 1.0 | 569 | $2,099 | $3.69 | 26d | 1 | 0.17mi |
| 1324 N Capitol St NW Unit 211 Washington, DC | — | 1.0 | 438 | $1,549 | $3.54 | 26d | 1 | 0.17mi |
| 1324 N Capitol St NW #1 Washington, DC | 1.0 | 1.0 | 571 | $1,599 | $2.80 | 26d | 1 | 0.17mi |
| 1324 N Capitol St NW Washington, DC | 2.0 | 1.0–2.0 | 613 | $2,699 | $4.40 | 1d | 13 | 0.17mi |
| 2 L St NW Washington, DC | 1.0 | 1.0 | 680 | $2,125 | $3.12 | 1d | 2 | 0.18mi |
| 1001 1st St NW Washington, DC | 2.0 | 1.0–2.0 | 691 | $1,732 | $2.51 | 24d | 7 | 0.18mi |
| 7 New York Ave NE Washington, DC | 4.0 | 1.0–3.0 | 1096 | $3,349 | $3.05 | 4d | 11 | 0.19mi |
| 40 Patterson St NE Washington, DC | 2.0 | 1.0–2.0 | 779 | $2,756 | $3.54 | 1d | 11 | 0.19mi |
| 44 M St NE Washington, DC | 3.0 | 1.0–2.0 | 898 | $3,313 | $3.69 | 0d | 14 | 0.20mi |
| 27 O St NW Washington, DC | 1.0–2.0 | 1.0 | 771 | $1,299 | $1.68 | 9d | 19 | 0.20mi |
| 33 N St NE Washington, DC | 2.0 | 1.0–2.0 | 783 | $2,837 | $3.62 | 0d | 25 | 0.20mi |
| 61 Pierce St NE Washington, DC | 2.0 | 1.0–2.0 | 816 | $2,594 | $3.18 | 1d | 52 | 0.21mi |
| 43 K St NW Washington, DC | 2.0 | 1.0–2.0 | 728 | $2,058 | $2.83 | 5d | 10 | 0.22mi |
| 55 M St NE Washington, DC | 3.0 | 1.0–3.0 | 857 | $2,719 | $3.17 | 1d | 27 | 0.23mi |
| 40 N St NE Washington, DC | 1.0–2.0 | 1.0–2.0 | 967 | $2,167 | $2.24 | 0d | 12 | 0.24mi |
| 1160 First St NE Washington, DC | 3.0 | 1.0–3.0 | 1006 | $2,995 | $2.98 | 0d | 65 | 0.25mi |
| 1150 1st St NE Washington, DC | 2.0 | 1.0–2.0 | 702 | $2,925 | $4.16 | 0d | 38 | 0.26mi |
| 1201 4th St NW Unit B Washington, DC | 1.0 | 1.0 | 390 | $1,700 | $4.36 | 19d | 1 | 0.27mi |
| 318 M St NW Washington, DC | 1.0 | 1.0 | 750 | $2,750 | $3.67 | 6d | 1 | 0.27mi |
| 200 P St NW Unit 3 Washington, DC | 1.0 | 1.0 | 519 | $1,699 | $3.27 | 26d | 1 | 0.28mi |
| 1527 1st St NW Washington, DC | 2.0 | 1.0 | 700 | $1,850 | $2.64 | 26d | 1 | 0.32mi |
| 1011 4th St NW Washington, DC | 2.0 | 1.0–2.0 | 687 | $2,558 | $3.72 | 1d | 9 | 0.32mi |
| 130 M St NE Washington, DC | 2.0 | 1.0–2.0 | 841 | $2,720 | $3.23 | 0d | 22 | 0.32mi |
| 1 Florida Ave NE Washington, DC | 3.0 | 1.0–2.0 | 703 | $2,588 | $3.68 | 0d | 31 | 0.32mi |
| 437 New York Ave NW Washington, DC | 2.0 | 1.0–2.0 | 820 | $3,200 | $3.90 | 19d | 3 | 0.33mi |
| 437 New York Ave NW Washington, DC | 1.0–2.0 | 1.0–2.0 | 967 | $2,295 | $2.37 | 9d | 2 | 0.33mi |
| 307 K St NW Washington, DC | 2.0 | 1.0–2.0 | 555 | $1,196 | $2.15 | 12d | 12 | 0.33mi |
HOA detail condo
- Monthly dues
- $395 · $4,740/yr
- Assessments
- None detected in remarks — confirm with the listing agent.
Listing history 21 events
-
2026-06-21days on market $205,000 Active 88 DOM
-
2026-06-18days on market $205,000 Active 85 DOM
-
2026-06-17days on market $205,000 Active 84 DOM
-
2026-06-16days on market $205,000 Active 83 DOM
-
2026-06-15days on market $205,000 Active 82 DOM
-
2026-06-13days on market $205,000 Active 80 DOM
-
2026-06-09days on market $205,000 Active 76 DOM
-
2026-06-08days on market $205,000 Active 75 DOM
-
2026-06-07days on market $205,000 Active 74 DOM
-
2026-06-04days on market $205,000 Active 71 DOM
-
2026-06-03days on market $205,000 Active 70 DOM
-
2026-06-02days on market $205,000 Active 69 DOM
-
2026-06-01days on market $205,000 Active 68 DOM
-
2026-05-31days on market $205,000 Active 67 DOM
-
2026-05-07price $205,000
-
2026-03-25$210,000 Active
-
2021-03-30status Pending
-
2021-03-30historical
-
2021-01-15historical Active Under Contract
-
2020-11-20$269,990 Active
-
1980-12-31soldstatus $35,306
ⓘ Source: listings_history table (triggers on properties + properties_extension) + one-shot
backfill from property_details.listing_events for pre-trigger history.
Tax reassessment forecast DC · Partial reset (capped growth)
- Current annual tax
- $2,727 · $227/mo
- Projected year-2 tax
- $2,727 · $227/mo
- Expected delta
- $0/yr ($0/mo · 0.0%)
ⓘ Screening estimate from a state-policy table — verify with the county assessor before closing.
Climate risk First Street
- Flood 1/10 Low FEMA zone X (unshaded) · 0% chance over 30 yrs
- Wildfire 1/10 Low
- Heat 7/10 Severe 7 d/yr ≥106°F today · 15 d/yr by 30 yrs out
- Wind 4/10 Moderate 18% chance of damaging wind over 30 yrs
- Air quality 4/10 Moderate 4 unhealthy d/yr today · 5 by 30 yrs out
Nearby sold comps map
Loading sold comps map…
Walkable amenities ~0.75 mi
Loading nearby amenities…
Taxation est. · year 1
- Rental income
- $27,513
- − Mortgage interest
- −$11,483
- − Property taxes
- −$2,727
- − Insurance
- −$1,025
- − Repairs & maintenance
- −$2,201
- − Management
- −$2,201
- − HOA
- −$4,740
- − Depreciation
- −$5,964
- Taxable loss
- −$2,828
- Est. tax savings @ 24.0%
- +$679
- After-tax cash flow
- $1,022/yr
For passive investors: Depreciation is non-cash, so a rental often shows a tax loss while cash-flowing — sheltering income. Rental losses are passive: they offset passive income freely, and up to $25,000/yr can offset ordinary (W-2) income if you actively participate and your MAGI is under $100k (phasing out to $0 by $150k); unused losses carry forward. On sale, claimed depreciation is recaptured at up to 25%, and gains may owe capital-gains tax (a 1031 exchange can defer both). Figures are a year-1 estimate at your 24.0% rate — not tax advice; consult a CPA.
Schools (NCES district)
- District
- District Of Columbia Public Schools
- NCES district ID
- 1100030
- Math proficiency
- 33% ▲ 3.00%
- Reading proficiency
- 40% ▲ 5.00%
- Median HH income
- $67,671
- Composite
- 35.84/100
- National rank
- #9606
- State rank
- #8 of 32 in DC
Livability — Washington
- Score
- 73/100
- State rank
- #1
- US rank
- #5327
Category grades
Schools grade is shown separately in the Schools card above.
Census & demographics
- Census place
- Washington, DC
- County
- District of Columbia · 671,873 people
- City population
- 671,873
- Metro
- Washington-Arlington-Alexandria, DC-VA-MD-WV
- Population (ZIP)
- 44,616
- Household income
- $138,059
- Rent vs Own
- Severe rent burden
- 3130.0
Population outlook (District of Columbia County) Hauer SSP2
- Today (2025)
- 821,926 people
- By 2030
- 899,517 · +9.4%
- By 2040
- 1,061,162 · +29.1%
- By 2050
- 1,231,493 · +49.8%
- By 2075
- 1,603,312 · +95.1%
- By 2100
- 1,847,141 · +124.7%
Race, ethnicity, and origin ACS 2023
- Neighborhood character
- Diverse neighborhood (Simpson 0.67)
- Race & ethnicity
- White 47% Black 30% Hispanic / Latino 11% Two or more races 8% Asian 7%
- Hispanic origin (detail)
- Mexican 2%
- Common ancestry
- Romanian 3% Lithuanian 3% Italian 2%
- Foreign-born
- 15% · Canada, China, South Korea
- Languages at home
- 81% English-only · Spanish 7% Chinese 3% Other Indo-European 2%
Political lean MEDSL · District of Columbia
- 2024 margin
- Solid D (+86.1) · D 91.2% · R 5.1% · Other 3.8%
- 2008→2024 swing
- +0.1pp no change · 2008: 85.9pp · 2024: 86.1pp
- All cycles
- 2024: D+86.1 2020: D+86.8 2016: D+88.7 2012: D+84.2 2008: D+85.9
Not yet ingested
- Civics
- —
Market trends
- HPI YoY
- ▼ -859.30%
- Current HPI
- 400.1329
- Rent YoY
- ▼ -0.75%
- Metro
- Washington-Arlington-Alexandria, DC-VA-MD-WV
- State GDP YoY
- ▲ 1.33%
- F500 in state
- 6
Industry mix (Fortune 500 HQ in DC)
| Industry | F500 HQs | Revenue |
|---|---|---|
| Financial Services | 1 | $153B |
|
||
| Life Sciences / Industrials | 1 | $25B |
|
||
| Industrial Machinery | 1 | $8B |
|
||
Price history
+480.6% since first listed7 events — show timeline
- 2026-05-07 Price Changed $205,000 BRIGHT MLS
- 2026-03-25 Listed $210,000 BRIGHT MLS
- 2021-03-30 Pending — BRIGHT MLS
- 2021-03-30 Listing Removed — BRIGHT MLS
- 2021-01-15 Contingent — BRIGHT MLS
- 2020-11-20 Listed $269,990 BRIGHT MLS
- 1980-12-31 Sold (Public Records) $35,306 Public Records
Property tax history
+13.7%/yrLatest (2025): $2,727 · +1.6% YoY. Source: county tax records.
Cash-flow waterfall
monthlySold comps — $/sqft
last 12 mo · ≤1 miLoading sold comps…