 🌊 Lakefront
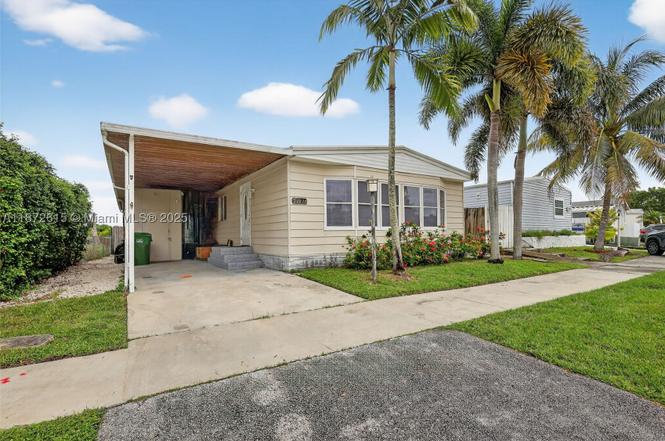
21831 S Heritage Cir · Pembroke Pines, FL
Flood risk 1/10 · Minimal
- FEMA flood zone
- X (shaded)
- Chance of flooding over 30 yrs
- 0.0%
- Est. flood insurance / yr
- $507 – $1,088
Fire risk 6/10 · Moderate
- Est. fire insurance / yr
- $947 – $1,759
Heat risk 9/10 · Severe
- Hot days now (above 108°F)
- 6 days/yr
- Hot days in 30 yrs
- 22 days/yr
Wind risk 10/10 · Severe
- Chance of severe wind over 30 yrs
- 99.0%
Air-quality risk 2/10 · Minimal
- Unhealthy air days now
- 1 days/yr
- Unhealthy air days in 30 yrs
- 2 days/yr
Risk factors via First Street. Map © Google.
Why this score? — see what drove the D+ grade
The composite is a weighted blend of 9 inputs, each scored 0–100. Each bar is that input's sub-score; the figure is the points it added to the 100-point composite (weight × sub-score).
- Cash flow +18.1/30.0
- ARV discount +6.8/15.0
- DSCR +5.7/10.0
- 1% rule +4.4/10.0
- Livability +4.2/5.0
- Schools +4.1/10.0
- Condition / age +2.5/5.0
- Rent growth +2.2/5.0
- Appreciation +0.0/10.0
$345,000
🖨 Deal sheet 📄 Offer letter ✓ Due diligence
Listing remarks MLS
WELL KEPT INTERIOR, NICELY LANDSCAPED FRONT AND BACK. THIS HOME SITS ON A LAKE LOT, WITH PEACEFUL LAKE VIEWS FROM MASTER BEDROOM AT THE REAR OF THE HOME. LARGE FLORIDA ROOM WITH STORM SHUTTERS. FIREPLACE IN THE FORMAL LIVING ROOM, INDOOR LAUNDRY ROOM. THI S MOBILE HOME COMMUNITY OFFERS MANY AMENITIES SUCH AS POOL, BASKETBALL, BASEBALL FIELD, GYM, CLUB HOUSE, SECURITY PATROL ETC. YOU OWN THE LAND.
Key facts
- Great condition park
- Expansive lake views
- Many renovations
Tags
Property features AI
Finance
- HOA & community: Monthly association fee ($103); Clubhouse; Maintained community; On-site property manager; Community pool
Exterior
- Parking: Attached covered carport; Driveway; 1 covered parking space; 1-car carport
- Utilities: Public water; Public sewer; Cable available
- Home design: Manufactured home; Resale; Faces south
- Construction: Manufactured construction; Roof over
- Exterior features: Fenced yard; Patio; Community pool; Lakefront with lake privileges
Interior
- Flooring: Laminate
- Bathrooms: 3 full bathrooms
- Heating & cooling: Central heating; Central air conditioning
- Interior features: First-floor entry; Laminate flooring; Laundry/utility room
- Laundry & utility: Washer and dryer included
Neighborhood map
What this means for you Summary
Snapshot
- This is a 2-bed/2.0-bath manufactured listed at $345k.
Deal economics
- At list price, monthly cash flow is $306 ($4k/yr) — positive.
- The deal already cash-flows at list — no discount required.
- To meet the 1% rule (rent ≥ 1% of price), the offer needs to be $323k (6.3% below list).
- Recommended offer: $304k (12.0% below list) — sets the bar for market timing.
- Cap rate 7.4% vs local median 4.0% in Pembroke Pines — top-decile yield for the area; either an underpriced asset or a hidden risk that comps aren't pricing in. Stress-test before assuming the spread holds.
Location & tenants
- Location reads 83/100 on livability (#54 in FL, #933 nationally) — a professional / high-income tenant draw. Strengths: housing A+, health & safety A+, schools A-; Watch: amenities D+, cost of living D+.
- Broward (suburban): math 42% / reading 53% proficiency, ranked #46 of 73 in FL (top 63%) — families likely to look elsewhere, expect single-tenant / working-renter base with shorter leases.
- Market conditions: Rents soft (-1.2%/yr); 240 active listings in the ZIP; 18 comparable units currently listed for rent nearby; rentals at typical pace (median 25d on market — plan ~3-4 weeks tenant-placement turnaround); high-income renter base; 2,111 units permitted in Broward County in 2024 (1,265 in 5+ unit buildings).
Forward outlook
- Local home prices are declining (-3.0%/yr); year-one equity from $2k of loan paydown is wiped out by about $10k of value loss. Plan a longer hold.
- Broward County population projected at +34% by 2050 — long-run rental-demand tailwind backs the buy-and-hold thesis.
Negotiation context
- It's been on market 272 days — a 12% lower offer ($304k) is reasonable based on typical stale-listing flexibility.
- 5 sale attempts since 18y ago with the ask held roughly flat each time — persistent listings suggest the price (not the market) is what's stuck; bring a comps-based counter.
- Current owner paid $159k; list at $345k implies a 117% gain — meaningful room to come down on a strong offer.
Risks & watch-outs
- Climate carrying-cost: severe wind risk, 99% chance of damaging wind over 30y; major wildfire risk; extreme-heat days projected 6→22/yr by 2055 (HVAC capex compounding) — expect insurance premiums to compound above CPI over the hold.
Questions for the listing agent
- It's been on market 272 days. Have you received any prior offers? Is the seller open to a 12% concession, seller financing, or rate buy-down credit?
- What does the HOA fee cover, when was the last increase, and are there any pending special assessments or reserve-fund shortfalls?
- Why hasn't it sold? Are there any deal-killer items the seller is aware of (foundation, flood, title, zoning, code violations)?
- Is there a deadline driving the sale (1031 exchange, divorce, estate, relocation)? That informs how much negotiation room exists.
- Schools are A-rated — typically a magnet for longer-tenancy family renters. What's the average tenant stay here, and is there a school-zone premium baked into asking?
- The area grade is low — what's the realistic commute time and amenity access for the typical tenant pool here? Any planned neighborhood developments (good or bad) we should know about?
- This sits on a lake — are riparian / water-frontage rights deeded with the parcel? Any dock permits, shoreline easements, or HOA water-use restrictions?
- What's the documented flood / surge / shoreline-erosion history here (FEMA AND non-FEMA — e.g., storm surge, creek backup, septic-field saturation)?
- Any water-quality or seasonal algae-bloom issues that affect tenant satisfaction or short-term-rental demand?
- What's the average days-on-market for RENTAL listings here right now (not sales)? A rising rental-DOM trend means longer vacancies and softer asking-rent achievability than the comps imply.
- What's the recent tenant-quality profile in this submarket — average credit score on applications, eviction rate, late-payment / NSF rate, and stable-employment percentage? A property-management company in the area should have these aggregated.
- How much new for-sale + rental construction is in the pipeline within 1–3 miles? Heavy new supply typically softens prices + rents 12–24 months out; constrained supply supports both.
Investment metrics
- 1% rule
- 0.94% ✗
- Cap rate
- 7.36%
- Cash-on-cash
- 3.80%
- DSCR
- 1.17
- GRM
- 8.9
CMA / ARV
- ARV (on-the-fly)
- $339,840
- Comps found
- 1
Show comp detail 1 sale within ~0.75 mi
| Address | Dist | Beds/Ba | Sqft | Sold | Price | $/sf | Match |
|---|---|---|---|---|---|---|---|
| 21661 NW 8th Ct | 0.32mi | 3/2.0 (+1) | 1,248 (-12%) | 4mo | $299,000 | $240 | 57 |
Match score weights: distance 35% · size 25% · config 20% · recency 20%. Top-matched comps best support the ARV.
Projected returns pro-forma
-3.0% appreciation · 0.0% rent growth · sell at horizon
- IRR
- -13.6%
- Equity multiple
- 0.52×
- Total profit
- $-45,912
- Equity at exit
- $51,441
- IRR
- -10.0%
- Equity multiple
- 0.47×
- Total profit
- $-51,633
- Equity at exit
- $29,829
Cash invested: $96,600 (down + closing). Projections, not guarantees.
Landlord ↔ Tenant lean methodology
- Overall (STATE)
- 87 Strongly Landlord-Friendly
- State Florida
- 87 Strongly Landlord-Friendly · R+3
- County
- — inherits STATE
- City
- — inherits STATE
ZIP-level market 33029
- Home prices YoY
- -18.3%
- Rents YoY
- -1.2%
- Active inventory
- 240
- Price-to-rent
- 8.9×
Monthly cashflow live
- Estimated rent
- $3,234 high interval (Pro) →
- Mortgage (P&I)
- −$1,809
- Tax from tax record
- −$193 /mo · $2,313/yr
- Insurance
- −$144
- HOA
- −$103
- Vacancy / Maint / Mgmt
- −$679
- Net cashflow
- $306
Break-even live
UW: 25.0% down · 7.5% · 30yr · 1.5% tax · 5.0% vac · 8.0% maint · 8.0% mgmt
Financing live
Cash to close
- Down payment
- $86,250
- Closing costs
- $10,350
- Reserves months
- —
- Total cash needed
- —
Loan-product check · same deal, 3 products live
Conventional
25% down · 7.5% · 30yr
- Down + closing
- —
- Monthly P&I
- —
- Monthly cashflow
- —
- DSCR
- —
- Eligible?
- —
Personal DTI + credit; lowest rate.
DSCR
20% down · 8.5% · 30yr
- Down + closing
- —
- Monthly P&I
- —
- Monthly cashflow
- —
- DSCR
- —
- Eligible?
- —
No personal income docs; deal must DSCR.
Hard money
10% down · 12.0% · 12mo
- Down + closing
- —
- Monthly P&I
- —
- Monthly cashflow
- —
- DSCR
- —
- Eligible?
- —
Short-term bridge; refi at stabilization.
Rent comps 18 comps
| Address | Beds | Baths | Sqft | Rent | $/sqft | DOM | Units | Dist |
|---|---|---|---|---|---|---|---|---|
| 21821 S Heritage Cir #1 Pembroke Pines, FL | 3.0 | 3.0 | 1475 | $2,550 | $1.73 | 24d | 1 | 0.02mi |
| 21821 S Heritage Cir #1 Pembroke Pines, FL | 3.0 | 3.0 | 1475 | $2,550 | $1.73 | 4d | 1 | 0.02mi |
| 20975 NW 1st Ct Pembroke Pines, FL | 3.0 | 2.5 | 1692 | $3,600 | $2.13 | 24d | 1 | 0.49mi |
| 20957 NW 1st Ct Unit 20957 Pembroke Pines, FL | 3.0 | 2.5 | 1749 | $2,900 | $1.66 | 24d | 1 | 0.51mi |
| 20930 NW 1st St Pembroke Pines, FL | 3.0 | 3.0 | 1617 | $3,600 | $2.23 | 8d | 1 | 0.58mi |
| 20919 NW 1st Dr Pembroke Pines, FL | 3.0 | 2.5 | 1749 | $3,600 | $2.06 | 12d | 1 | 0.59mi |
| 20919 NW 1st Dr Pembroke Pines, FL | 3.0 | 2.5 | 1749 | $3,600 | $2.06 | 24d | 1 | 0.59mi |
| 20908 NW 1st Dr Pembroke Pines, FL | 3.0 | 2.5 | 1692 | $3,500 | $2.07 | 24d | 1 | 0.61mi |
| 20901 NW 1st Dr Pembroke Pines, FL | 3.0 | 2.5 | 1692 | $3,300 | $1.95 | 24d | 1 | 0.61mi |
| 20901 NW 1st Dr Unit 1 Pembroke Pines, FL | 3.0 | 2.5 | 1692 | $3,200 | $1.89 | 24d | 1 | 0.61mi |
| 20875 NW 4th St Pembroke Pines, FL | 2.0 | 2.5 | 1361 | $2,500 | $1.84 | 24d | 1 | 0.63mi |
| 20861 NW 4th St Pembroke Pines, FL | 3.0 | 2.5 | 1361 | $4,000 | $2.94 | 24d | 1 | 0.66mi |
| 20841 NW 1st St Pembroke Pines, FL | 3.0 | 2.0 | 1225 | $3,500 | $2.86 | 24d | 1 | 0.71mi |
| 20807 NW 1st St #20807 Pembroke Pines, FL | 2.0 | 2.5 | 1361 | $2,650 | $1.95 | 17d | 1 | 0.79mi |
| 210 NW 207th Way Pembroke Pines, FL | 3.0 | 2.0 | 1620 | $3,450 | $2.13 | 3d | 1 | 0.84mi |
| 20541 SW 2nd St Pembroke Pines, FL | 3.0 | 3.0 | 1694 | $5,500 | $3.25 | 1d | 1 | 1.08mi |
| 387 SW 206th Ave Pembroke Pines, FL | 3.0 | 2.0 | 1453 | $3,500 | $2.41 | 12d | 1 | 1.09mi |
| 387 SW 206th Ave Pembroke Pines, FL | 3.0 | 2.0 | 1453 | $3,500 | $2.41 | 17d | 1 | 1.09mi |
HOA detail
- Monthly dues
- $103 · $1,236/yr
- Likely covers
- poolgymsecurity
Listing history 24 events
-
2026-06-18days on market $345,000 Active 272 DOM
-
2026-06-17days on market $345,000 Active 271 DOM
-
2026-06-16days on market $345,000 Active 270 DOM
-
2026-06-15days on market $345,000 Active 269 DOM
-
2026-06-13days on market $345,000 Active 267 DOM
-
2026-06-09days on market $345,000 Active 263 DOM
-
2026-06-07pricedays on market $345,000 Active 261 DOM
-
2026-06-04days on market $347,900 Active 258 DOM
-
2026-06-03days on market $347,900 Active 257 DOM
-
2026-06-02days on market $347,900 Active 256 DOM
-
2026-06-01days on market $347,900 Active 255 DOM
-
2026-05-31days on market $347,900 Active 254 DOM
-
2026-04-06price $347,900
-
2026-04-06status Active
-
2026-03-31status Active
-
2026-03-23status Active
-
2025-09-04$349,900 Active
-
2020-09-08soldstatus $159,000
-
2013-09-09soldstatus $56,000
-
2008-10-07soldstatus $132,000
-
2008-09-26soldstatus $132,000 399-char remark
Show marketing remark (399 chars)
WELL KEPT INTERIOR, NICELY LANDSCAPED FRONT AND BACK. THIS HOME SITS ON A LAKE LOT, WITH PEACEFUL LAKE VIEWS FROM MASTER BEDROOM AT THE REAR OF THE HOME. LARGE FLORIDA ROOM WITH STORM SHUTTERS. FIREPLACE IN THE FORMAL LIVING ROOM, INDOOR LAUNDRY ROOM. THI S MOBILE HOME COMMUNITY OFFERS MANY AMENITIES SUCH AS POOL, BASKETBALL, BASEBALL FIELD, GYM, CLUB HOUSE, SECURITY PATROL ETC. YOU OWN THE LAND.
-
2008-01-19$125,900 399-char remark
Show marketing remark (399 chars)
WELL KEPT INTERIOR, NICELY LANDSCAPED FRONT AND BACK. THIS HOME SITS ON A LAKE LOT, WITH PEACEFUL LAKE VIEWS FROM MASTER BEDROOM AT THE REAR OF THE HOME. LARGE FLORIDA ROOM WITH STORM SHUTTERS. FIREPLACE IN THE FORMAL LIVING ROOM, INDOOR LAUNDRY ROOM. THI S MOBILE HOME COMMUNITY OFFERS MANY AMENITIES SUCH AS POOL, BASKETBALL, BASEBALL FIELD, GYM, CLUB HOUSE, SECURITY PATROL ETC. YOU OWN THE LAND.
-
2007-01-09soldstatus $50,000
-
1992-12-02soldstatus $15,000
ⓘ Source: listings_history table (triggers on properties + properties_extension) + one-shot
backfill from property_details.listing_events for pre-trigger history.
Tax reassessment forecast FL · Resets to sale price
- Current annual tax
- $2,313 · $193/mo
- Projected year-2 tax
- $2,864 · $239/mo
- Expected delta
- +$550/yr (+$46/mo · 23.8%)
ⓘ Screening estimate from a state-policy table — verify with the county assessor before closing.
Climate risk First Street
- Flood 1/10 Low FEMA zone X (shaded) · 0% chance over 30 yrs
- Wildfire 6/10 Major
- Heat 9/10 Extreme 6 d/yr ≥108°F today · 22 d/yr by 30 yrs out
- Wind 10/10 Extreme 99% chance of damaging wind over 30 yrs
- Air quality 2/10 Low 1 unhealthy d/yr today · 2 by 30 yrs out
Nearby sold comps map
Loading sold comps map…
Walkable amenities ~0.75 mi
Loading nearby amenities…
Taxation est. · year 1
- Rental income
- $38,810
- − Mortgage interest
- −$19,325
- − Property taxes
- −$2,313
- − Insurance
- −$1,725
- − Repairs & maintenance
- −$3,105
- − Management
- −$3,105
- − HOA
- −$1,236
- − Depreciation
- −$10,036
- Taxable loss
- −$2,036
- Est. tax savings @ 24.0%
- +$489
- After-tax cash flow
- $4,164/yr
For passive investors: Depreciation is non-cash, so a rental often shows a tax loss while cash-flowing — sheltering income. Rental losses are passive: they offset passive income freely, and up to $25,000/yr can offset ordinary (W-2) income if you actively participate and your MAGI is under $100k (phasing out to $0 by $150k); unused losses carry forward. On sale, claimed depreciation is recaptured at up to 25%, and gains may owe capital-gains tax (a 1031 exchange can defer both). Figures are a year-1 estimate at your 24.0% rate — not tax advice; consult a CPA.
Schools (NCES district)
- District
- Broward
- NCES district ID
- 1200180
- Math proficiency
- 42% ▼ -18.00%
- Reading proficiency
- 53% ▼ -5.00%
- Median HH income
- $52,139
- Composite
- 40.88/100
- National rank
- #3621
- State rank
- #46 of 73 in FL
Livability — Pembroke Pines
- Score
- 83/100
- State rank
- #54
- US rank
- #933
Category grades
Schools grade is shown separately in the Schools card above.
Census & demographics
- Census place
- Pembroke Pines, FL
- County
- Broward County · 1,963,430 people
- City population
- 180,224
- Metro
- Miami-Fort Lauderdale-Pompano Beach, FL
- Population (ZIP)
- 44,070
- Household income
- $146,237
- Rent vs Own
- Severe rent burden
- 307.0
Population outlook (Broward County) Hauer SSP2
- Today (2025)
- 2,207,033 people
- By 2030
- 2,360,704 · +7.0%
- By 2040
- 2,661,208 · +20.6%
- By 2050
- 2,946,698 · +33.5%
- By 2075
- 3,602,273 · +63.2%
- By 2100
- 3,970,984 · +79.9%
Race, ethnicity, and origin ACS 2023
- Neighborhood character
- Highly diverse neighborhood (Simpson 0.70)
- Race & ethnicity
- Hispanic / Latino 43% Two or more races 29% White 27% Black 20% Asian 7%
- Hispanic origin (detail)
- Mexican 2% Puerto Rican 5% Cuban 14% Dominican 3%
- Common ancestry
- Hispanic 2% Russian 1% Estonian 1%
- Foreign-born
- 33% · Canada, Jamaica, China
- Languages at home
- 53% English-only · Spanish 38% Other Indo-European 4% French/Haitian/Cajun 2%
Political lean MEDSL · Broward
- 2024 margin
- D (+17.0) · D 58.0% · R 41.0%
- 2008→2024 swing
- -17.8pp toward R · 2008: 34.7pp · 2024: 17.0pp
- All cycles
- 2024: D+17.0 2020: D+29.8 2016: D+35.0 2012: D+34.9 2008: D+34.7
Not yet ingested
- Civics
- —
Market trends
- HPI YoY
- ▼ -83.68%
- Current HPI
- 373.7752
- Rent YoY
- ▼ -1.17%
- Metro
- Miami-Fort Lauderdale-Pompano Beach, FL
- State GDP YoY
- ▲ 3.28%
- F500 in state
- 36
Industry mix (Fortune 500 HQ in FL)
| Industry | F500 HQs | Revenue |
|---|---|---|
| Industrial Technology | 2 | $29B |
|
||
| Insurance | 2 | $17B |
|
||
| Retail | 1 | $60B |
|
||
| Technology Distribution | 1 | $58B |
|
||
| Homebuilding | 1 | $35B |
|
||
| Technology Manufacturing | 1 | $35B |
|
||
Price history
+2219.3% since first listed12 events — show timeline
- 2026-04-06 Price Changed $347,900 MARMLS
- 2026-04-06 Relisted — MARMLS
- 2026-03-31 Relisted — MARMLS
- 2026-03-23 Relisted — MARMLS
- 2025-09-04 Listed $349,900 MARMLS
- 2020-09-08 Sold (Public Records) $159,000 Public Records
- 2013-09-09 Sold (Public Records) $56,000 Public Records
- 2008-10-07 Sold (Public Records) $132,000 Public Records
- 2008-09-26 Sold (MLS) $132,000 Beaches MLS
- 2008-01-19 Listed $125,900 Beaches MLS
- 2007-01-09 Sold (Public Records) $50,000 Public Records
- 1992-12-02 Sold (Public Records) $15,000 Public Records
Property tax history
+3.6%/yrLatest (2025): $2,313 · +2.9% YoY. Source: county tax records.
Cash-flow waterfall
monthlySold comps — $/sqft
last 12 mo · ≤1 miLoading sold comps…