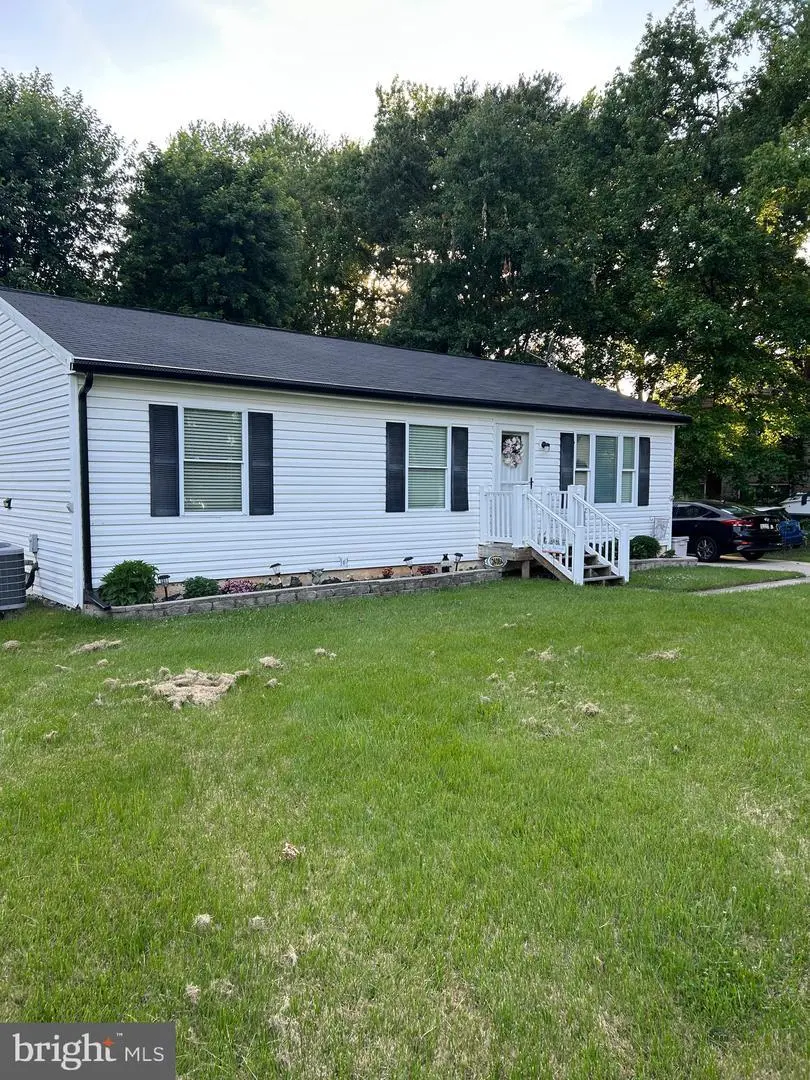
2408-A Willoughby Beach Rd · Edgewood, MD
Flood risk 1/10 · Minimal
- FEMA flood zone
- X (unshaded)
- Chance of flooding over 30 yrs
- 0.0%
- Est. flood insurance / yr
- $473 – $860
Fire risk 1/10 · Minimal
- Est. fire insurance / yr
- $755 – $1,403
Heat risk 8/10 · Major
- Hot days now (above 104°F)
- 7 days/yr
- Hot days in 30 yrs
- 16 days/yr
Wind risk 6/10 · Moderate
- Chance of severe wind over 30 yrs
- 27.0%
Air-quality risk 4/10 · Minor
- Unhealthy air days now
- 4 days/yr
- Unhealthy air days in 30 yrs
- 6 days/yr
Risk factors via First Street. Map © Google.
Why this score? — see what drove the D+ grade
The composite is a weighted blend of 9 inputs, each scored 0–100. Each bar is that input's sub-score; the figure is the points it added to the 100-point composite (weight × sub-score).
- ARV discount +15.0/15.0
- Cash flow +12.7/30.0
- DSCR +3.8/10.0
- Rent growth +3.7/5.0
- Livability +3.7/5.0
- 1% rule +2.9/10.0
- Schools +2.9/10.0
- Condition / age +2.5/5.0
- Appreciation +0.0/10.0
$299,000
🖨 Deal sheet (PDF) 📄 Offer letter ✓ Due diligence
Listing remarks MLS
Are you looking for an EXTREMELY affordable single family home with TONS of off-street parking, close to APG!? Look no further! This home is move-in ready with enough bells and whistles to check all of the boxes, but could be upgraded over time as you see fit. Fireplace? Check. 4 bedrooms? Check. Beautiful kitchen? Check. Large deck? Check. Great yard? Check. Come see this large split-foyer today in Edgemead Subdivision with limited inventory! Call this house your home.
Key facts
- Newer roof
- Retractable awning
- Parking for 5 cars
Tags
Property features AI
Exterior
- Parking: Attached garage with one space and additional storage area; Driveway
- Utilities: Public water; Public sewer; Electric hot water
- Home design: Manufactured home; Above-grade finished living space (1,600); Fee simple ownership
- Construction: Built with concrete, stick-built elements, tile and vinyl siding; Above-grade and below-grade structures noted
- Exterior features: Property located within city limits
Interior
- Kitchen: Built-in microwave; Dishwasher; Disposal; Electric oven/range; Refrigerator; Icemaker; Electric water heater
- Bedrooms: Four bedrooms on the main level
- Bathrooms: Two full bathrooms
- Heating & cooling: Heat pump heating; Central air conditioning; Electric heating and cooling
- Interior features: No basement; Multiple access exits (2+)
- Laundry & utility: Washer; Dryer (electric)
Neighborhood map
What this means for you Summary
Snapshot
- This is a 4-bed/2.0-bath single-family listed at $299k.
Deal economics
- At list price, monthly cash flow is $-35 ($-417/yr) — negative.
- To cash-flow at today's rent, offer at most $293k (2.1% below list).
- To meet the 1% rule (rent ≥ 1% of price), the offer needs to be $235k (21.3% below list).
- Recommended offer: $235k (21.3% below list) — sets the bar for 1% rule.
Location & tenants
- Location reads 73/100 on livability (#118 in MD, #4,991 nationally) — a middle-class / working-renter tenant base. Strengths: commute A+, housing A+, health & safety A+; Watch: amenities D, crime F.
- Harford County Public Schools (suburban): math 22% / reading 39% proficiency, ranked #9 of 24 in MD (top 38%) — families likely to look elsewhere, expect single-tenant / working-renter base with shorter leases.
- Zoned schools: Deerfield Elementary (math 7% / reading 17%, grade F, #550 of 860 statewide, top 66%, 728 students, 78% FRL); Edgewood Middle (math 7% / reading 31%, grade F, #155 of 225 statewide, top 70%, 999 students, 72% FRL); Edgewood High (math 43% / reading 54%, grade D, #111 of 222 statewide, top 50%, 1,415 students, 62% FRL) — zoned schools average 71% FRL vs 24% district-wide (46 pts higher); higher-poverty schools than district average — tighter screening recommended.
- Market conditions: Rents rising fast (+4.9%/yr); 95 active listings in the ZIP; 10 comparable units currently listed for rent nearby; rentals lingering (median 46d on market — plan ~5-8 weeks vacancy on turnover, expect pricing pressure); 50% of comp listings sitting > 30 days — soft ceiling on asking rent; solid renter incomes; 803 units permitted in Harford County in 2024 (26 in 5+ unit buildings).
- This rent runs 35% of the median local income ($82k/yr) — at the standard rent-burdened threshold; future hikes will face affordability resistance.
Forward outlook
- Local home prices are declining (-3.0%/yr); year-one equity from $2k of loan paydown is wiped out by about $9k of value loss. Plan a longer hold.
Negotiation context
- Only 12 days on market — expect competitive offers; lowballing is unlikely to land.
- 6 sale attempts since 14y ago with the ask held roughly flat each time — persistent listings suggest the price (not the market) is what's stuck; bring a comps-based counter.
- Current owner paid $215k; 39% above their basis — modest negotiation headroom, anchor on the comps not their cost.
Risks & watch-outs
- Climate carrying-cost: major wind risk, 27% chance of damaging wind over 30y; extreme-heat days projected 7→16/yr by 2055 (HVAC capex compounding) — expect insurance premiums to compound above CPI over the hold.
Questions for the listing agent
- What do current leases actually rent for vs. the listed asking? Can we see a recent rent roll and the last 12 months of T-12 income?
- Is there a deadline driving the sale (1031 exchange, divorce, estate, relocation)? That informs how much negotiation room exists.
- Schools are D-rated, which usually means shorter tenancies and higher turnover. Who's the typical renter profile here, and what's been the actual vacancy rate?
- Crime grade is F in this area — have there been break-ins, vandalism, or insurance claims at this property in the last 3 years? What carrier currently insures it and at what premium?
- The area grade is low — what's the realistic commute time and amenity access for the typical tenant pool here? Any planned neighborhood developments (good or bad) we should know about?
- What's the average days-on-market for RENTAL listings here right now (not sales)? A rising rental-DOM trend means longer vacancies and softer asking-rent achievability than the comps imply.
- What's the recent tenant-quality profile in this submarket — average credit score on applications, eviction rate, late-payment / NSF rate, and stable-employment percentage? A property-management company in the area should have these aggregated.
- How much new for-sale + rental construction is in the pipeline within 1–3 miles? Heavy new supply typically softens prices + rents 12–24 months out; constrained supply supports both.
Investment metrics
- 1% rule
- 0.79% ✗
- Cap rate
- 6.15%
- Cash-on-cash
- -0.50%
- DSCR
- 0.98
- GRM
- 10.6
CMA / ARV
- ARV (on-the-fly)
- $364,384
- Comps found
- 12
Show comp detail 12 sales within ~0.75 mi
| Address | Dist | Beds/Ba | Sqft | Sold | Price | $/sf | Match |
|---|---|---|---|---|---|---|---|
| 2425 Sycamore Ln | 0.20mi | 5/2.0 (+1) | 1,843 (-2%) | 3mo | $279,000 | $151 | 79 |
| 503 Catalpa Ln | 0.18mi | 4/2.5 | 2,006 (+6%) | 2mo | $330,000 | $165 | 78 |
| 2405 Papaya Rd | 0.20mi | 3/2.5 (-1) | 1,826 (-3%) | 13mo | $310,900 | $170 | 67 |
| 2314 Rosewood Dr | 0.37mi | 3/2.5 (-1) | 1,970 (+4%) | 2mo | $315,000 | $160 | 67 |
| 2407 Sycamore Ln | 0.10mi | 4/2.0 | 1,683 (-11%) | 13mo | $325,000 | $193 | 67 |
| 605 Banyan Ct | 0.39mi | 4/2.0 | 1,720 (-9%) | 8mo | $332,300 | $193 | 60 |
| 2313 Hanson Rd | 0.43mi | 4/2.5 | 2,050 (+9%) | 7mo | $315,000 | $154 | 58 |
| 2810 Todkill Trce | 0.67mi | 4/3.5 | 1,960 (+4%) | 10mo | $464,999 | $237 | 48 |
| 1925 Southridge Dr | 0.68mi | 5/3.0 (+1) | 1,932 (+2%) | 10mo | $375,000 | $194 | 47 |
| 128 King James Cir | 0.70mi | 4/3.5 | 1,644 (-13%) | 0mo | $345,000 | $210 | 40 |
| 207 Heritage Throne Way | 0.53mi | 3/2.5 (-1) | 1,680 (-11%) | 13mo | $360,000 | $214 | 39 |
| 302 Lord Willoughby Way | 0.56mi | 3/2.5 (-1) | 1,694 (-10%) | 15mo | $325,000 | $192 | 38 |
Match score weights: distance 35% · size 25% · config 20% · recency 20%. Top-matched comps best support the ARV.
Projected returns pro-forma
-3.0% appreciation · 4.92% rent growth · sell at horizon
- IRR
- -15.2%
- Equity multiple
- 0.45×
- Total profit
- $-46,098
- Equity at exit
- $44,582
- IRR
- -3.9%
- Equity multiple
- 0.72×
- Total profit
- $-23,494
- Equity at exit
- $25,852
Cash invested: $83,720 (down + closing). Projections, not guarantees.
Landlord ↔ Tenant lean methodology
- Overall (STATE)
- 27 Tenant-Leaning
- State Maryland
- 27 Tenant-Leaning · D+14
- County
- — inherits STATE
- City
- — inherits STATE
ZIP-level market 21040
- Home prices YoY
- -29.4%
- Rents YoY
- 4.9%
- Active inventory
- 95
- Price-to-rent
- 10.6×
Monthly cashflow live
- Estimated rent
- $2,354 high interval (Pro) →
- Mortgage (P&I)
- −$1,568
- Tax from tax record
- −$202 /mo · $2,423/yr
- Insurance
- −$125
- HOA
- −$0
- Vacancy / Maint / Mgmt
- −$494
- Net cashflow
- $-35
Break-even live
Sensitivity live
| Price | -10% $135 | -5% $50 | +0% $-35 | +5% $-119 | +10% $-204 |
|---|---|---|---|---|---|
| Rent | -10% $-221 | -5% $-128 | +0% $-35 | +5% $58 | +10% $151 |
| Rate | -1.0pp $116 | -0.5pp $41 | base $-35 | +0.5pp $-112 | +1.0pp $-191 |
UW: 25.0% down · 7.5% · 30yr · 1.5% tax · 5.0% vac · 8.0% maint · 8.0% mgmt
Financing live
Cash to close
- Down payment
- $74,750
- Closing costs
- $8,970
- Reserves months
- —
- Total cash needed
- —
Loan-product check · same deal, 3 products live
Conventional
25% down · 7.5% · 30yr
- Down + closing
- —
- Monthly P&I
- —
- Monthly cashflow
- —
- DSCR
- —
- Eligible?
- —
Personal DTI + credit; lowest rate.
DSCR
20% down · 8.5% · 30yr
- Down + closing
- —
- Monthly P&I
- —
- Monthly cashflow
- —
- DSCR
- —
- Eligible?
- —
No personal income docs; deal must DSCR.
Hard money
10% down · 12.0% · 12mo
- Down + closing
- —
- Monthly P&I
- —
- Monthly cashflow
- —
- DSCR
- —
- Eligible?
- —
Short-term bridge; refi at stabilization.
Rent comps 10 comps
| Address | Beds | Baths | Sqft | Rent | $/sqft | DOM | Units | Dist |
|---|---|---|---|---|---|---|---|---|
| 619 Hartwood Ln Edgewood, MD | 4.0 | 1.5 | 1716 | $2,300 | $1.34 | 45d | 1 | 0.36mi |
| 2033 Armstrong St Edgewood, MD | 1.0–4.0 | 1.0–2.0 | 1000 | $1,974 | $1.97 | 0d | 8 | 0.64mi |
| 2816 Profitt Path Edgewood, MD | 4.0 | 3.0 | 1660 | $2,900 | $1.75 | 45d | 1 | 0.73mi |
| 705 Bayberry Rd Edgewood, MD | 3.0 | 1.5 | 1657 | $2,600 | $1.57 | 19d | 1 | 0.94mi |
| 313 Winterberry Dr Edgewood, MD | 3.0 | 2.5 | 1798 | $2,095 | $1.17 | 22d | 1 | 1.03mi |
| 1046 Agate Dr Unit 1 Edgewood, MD | 4.0 | 2.5 | 1440 | $2,150 | $1.49 | 19d | 1 | 1.20mi |
| 2828 Beckon Dr Edgewood, MD | 3.0 | 2.5 | 1764 | $2,300 | $1.30 | 45d | 1 | 1.31mi |
| 2842 Beckon Dr Unit 1 Edgewood, MD | 4.0 | 1.5 | 1296 | $2,100 | $1.62 | 45d | 1 | 1.34mi |
| 1857 Simons Ct Edgewood, MD | 3.0 | 1.5 | 1240 | $1,700 | $1.37 | 45d | 1 | 1.41mi |
| 8 Lasonia Ct Edgewood, MD | 3.0 | 3.0 | 1468 | $2,224 | $1.51 | 17d | 1 | 1.43mi |
Listing history 8 events
-
2026-06-21days on market $299,000 Active 12 DOM
-
2026-06-18days on market $299,000 Active 9 DOM
-
2026-06-17days on market $299,000 Active 8 DOM
-
2026-06-16days on market $299,000 Active 7 DOM
-
2026-06-15days on market $299,000 Active 6 DOM
-
2026-06-13days on market $299,000 Active 4 DOM
-
2026-06-10remarks 685-char remark
-
2026-06-10$299,000 Active 1 DOM
ⓘ Source: listings_history table (triggers on properties + properties_extension) + one-shot
backfill from property_details.listing_events for pre-trigger history.
Tax reassessment forecast MD · Partial reset (capped growth)
- Current annual tax
- $2,423 · $202/mo
- Projected year-2 tax
- $2,841 · $237/mo
- Expected delta
- +$418/yr (+$35/mo · 17.2%)
ⓘ Screening estimate from a state-policy table — verify with the county assessor before closing.
Climate risk First Street
- Flood 1/10 Low FEMA zone X (unshaded) · 0% chance over 30 yrs
- Wildfire 1/10 Low
- Heat 8/10 Severe 7 d/yr ≥104°F today · 16 d/yr by 30 yrs out
- Wind 6/10 Major 27% chance of damaging wind over 30 yrs
- Air quality 4/10 Moderate 4 unhealthy d/yr today · 6 by 30 yrs out
Nearby sold comps map
Loading sold comps map…
Walkable amenities ~0.75 mi
Loading nearby amenities…
Taxation est. · year 1
- Rental income
- $28,250
- − Mortgage interest
- −$16,749
- − Property taxes
- −$2,423
- − Insurance
- −$1,495
- − Repairs & maintenance
- −$2,260
- − Management
- −$2,260
- − Depreciation
- −$8,698
- Taxable loss
- −$5,635
- Est. tax savings @ 24.0%
- +$1,352
- After-tax cash flow
- $936/yr
For passive investors: Depreciation is non-cash, so a rental often shows a tax loss while cash-flowing — sheltering income. Rental losses are passive: they offset passive income freely, and up to $25,000/yr can offset ordinary (W-2) income if you actively participate and your MAGI is under $100k (phasing out to $0 by $150k); unused losses carry forward. On sale, claimed depreciation is recaptured at up to 25%, and gains may owe capital-gains tax (a 1031 exchange can defer both). Figures are a year-1 estimate at your 24.0% rate — not tax advice; consult a CPA.
Schools (NCES district)
- District
- Harford County Public Schools
- NCES district ID
- 2400390
- Math proficiency
- 22% ▼ -23.00%
- Reading proficiency
- 39% ▼ -12.00%
- Median HH income
- $79,569
- Composite
- 29.38/100
- National rank
- #6527
- State rank
- #9 of 24 in MD
Livability — Edgewood
- Score
- 73/100
- State rank
- #118
- US rank
- #4991
Category grades
Schools grade is shown separately in the Schools card above.
Census & demographics
- Census place
- Edgewood, MD
- County
- Harford County · 198,512 people
- City population
- 24,960
- Metro
- Baltimore-Columbia-Towson, MD
- Population (ZIP)
- 24,960
- Household income
- $81,704
- Rent vs Own
- Severe rent burden
- 859.0
Population outlook (Harford County) Hauer SSP2
- Today (2025)
- 262,292 people
- By 2030
- 266,437 · +1.6%
- By 2040
- 269,954 · +2.9%
- By 2050
- 265,659 · +1.3%
- By 2075
- 252,886 · -3.6%
- By 2100
- 224,014 · -14.6%
Race, ethnicity, and origin ACS 2023
- Neighborhood character
- Diverse neighborhood (Simpson 0.66)
- Race & ethnicity
- Black 45% White 36% Two or more races 11% Hispanic / Latino 10% Asian 2%
- Hispanic origin (detail)
- Mexican 1% Puerto Rican 2%
- Common ancestry
- Romanian 4% Slovak 1% Italian 1%
- Foreign-born
- 8% · Canada, South Korea
- Languages at home
- 89% English-only · Spanish 5% Russian/Polish/Slavic 2% German/W. Germanic 1%
Political lean MEDSL · Harford
- 2024 margin
- R (+13.8) · D 41.9% · R 55.7% · Other 2.4%
- 2008→2024 swing
- +5.0pp toward D · 2008: -18.8pp · 2024: -13.8pp
- All cycles
- 2024: R+13.8 2020: R+12.0 2016: R+24.5 2012: R+19.5 2008: R+18.8
Not yet ingested
- Civics
- —
Market trends
- HPI YoY
- ▼ -106.14%
- Current HPI
- 254.2305
- Rent YoY
- ▲ 4.92%
- Metro
- Baltimore-Columbia-Towson, MD
- State GDP YoY
- ▲ 2.97%
- F500 in state
- 12
Industry mix (Fortune 500 HQ in MD)
| Industry | F500 HQs | Revenue |
|---|---|---|
| Aerospace / Defense | 1 | $71B |
|
||
| Utilities | 1 | $25B |
|
||
| Hotels | 1 | $24B |
|
||
| Consumer Goods | 1 | $7B |
|
||
| Real Estate | 1 | $6B |
|
||
| Chemicals | 1 | $2B |
|
||
Price history
+398.3% since first listed24 events — show timeline
- 2026-06-09 Listed $299,000 BRIGHT MLS
- 2019-05-30 Sold (Public Records) $214,900 Public Records
- 2019-04-29 Sold (MLS) $214,900 BRIGHT MLS
- 2019-03-14 Pending — BRIGHT MLS
- 2019-03-14 Listing Removed — BRIGHT MLS
- 2019-03-08 Relisted — BRIGHT MLS
- 2019-03-08 Listed $214,900 BRIGHT MLS
- 2019-03-08 Listing Removed — BRIGHT MLS
- 2014-06-23 Sold (Public Records) $170,000 Public Records
- 2014-05-14 Sold (MLS) $170,000 BRIGHT MLS
- 2014-05-14 Sold (MLS) $170,000 MRIS
- 2014-05-07 Price Changed $180,000 MRIS
- 2014-03-28 Pending — MRIS
- 2014-03-27 Listing Removed — BRIGHT MLS
- 2014-03-24 Delisted — MRIS
- 2013-04-01 Pending — MRIS
- 2013-03-29 Listed $150,000 MRIS
- 2013-03-29 Listed $180,000 BRIGHT MLS
- 2013-02-05 Delisted — MRIS
- 2012-03-16 Pending — MRIS
- 2012-01-04 Listed — MRIS
- 2007-03-05 Sold (Public Records) $240,000 Public Records
- 2007-03-05 Sold (Public Records) $240,000 Public Records
- 1985-11-18 Sold (Public Records) $60,000 Public Records
Property tax history
-0.0%/yrLatest (2025): $2,423 · +5.9% YoY. Source: county tax records.
Cash-flow waterfall
monthlySold comps — $/sqft
last 12 mo · ≤1 miLoading sold comps…