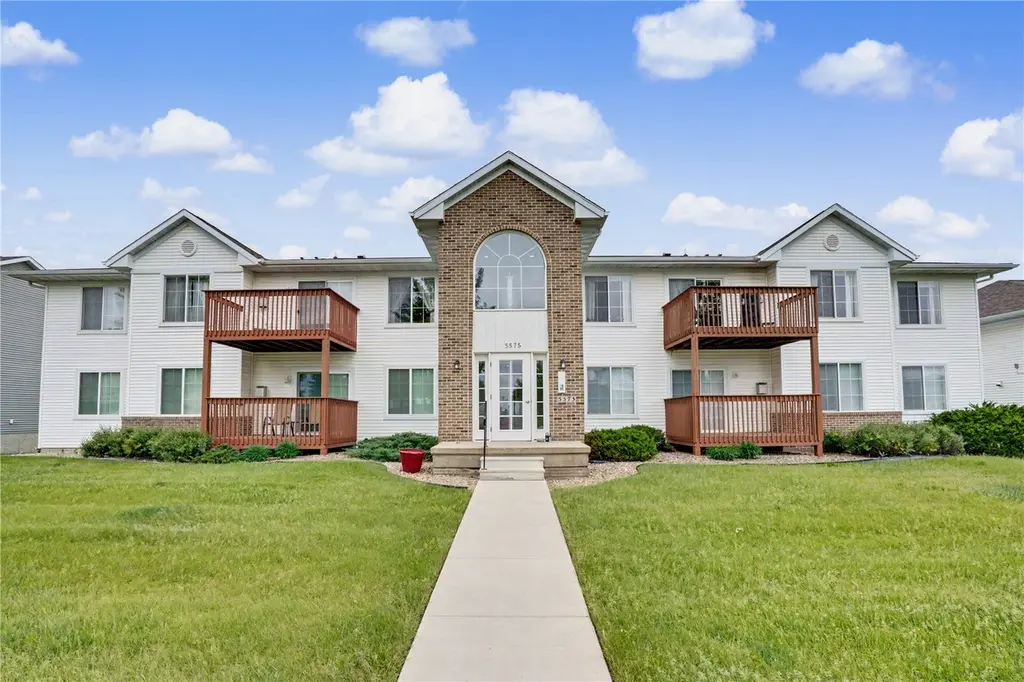
5575 Kacena Ave #6 · Marion, IA
Flood risk 1/10 · Minimal
- FEMA flood zone
- X (unshaded)
- Chance of flooding over 30 yrs
- 0.0%
- Est. flood insurance / yr
- $473 – $860
Fire risk 1/10 · Minimal
- Est. fire insurance / yr
- $902 – $1,676
Heat risk 3/10 · Minor
- Hot days now (above 103°F)
- 7 days/yr
- Hot days in 30 yrs
- 15 days/yr
Wind risk 2/10 · Minimal
- Chance of severe wind over 30 yrs
- —
Air-quality risk 2/10 · Minimal
- Unhealthy air days now
- 1 days/yr
- Unhealthy air days in 30 yrs
- 2 days/yr
Risk factors via First Street. Map © Google.
Why this score? — see what drove the B- grade
The composite is a weighted blend of 9 inputs, each scored 0–100. Each bar is that input's sub-score; the figure is the points it added to the 100-point composite (weight × sub-score).
- Cash flow +24.4/30.0
- 1% rule +8.6/10.0
- DSCR +7.9/10.0
- ARV discount +7.5/15.0
- Schools +6.6/10.0
- Rent growth +4.6/5.0
- Livability +4.2/5.0
- Condition / age +2.5/5.0
- Appreciation +0.0/10.0
$122,500
🖨 Deal sheet (PDF) 📄 Offer letter ✓ Due diligence
Listing remarks MLS
Move-in ready condo offering 1,016 sqft with 2 bedrooms and 1 full bathroom! This inviting home features newer carpeting, a bright and airy feel with plenty of natural light, and a spacious kitchen with great cabinet and counter space. The attached 2-car tandem garage offers tons of extra storage and convenience. Association allows up to 2 cats, no dogs, and no rentals. Easy, low-maintenance living in a great setting!
Key facts
- $195 HOA
- Garage
- Built 1997
Property features AI
Finance
- HOA & community: Homeowners association with annual fee of $2,340 (about $195/month); HOA covers trash, grounds maintenance, and structure maintenance
Exterior
- Parking: 2 parking spaces (tandem, attached garage)
- Security: Smoke detectors
- Utilities: Public water; Public sewer
- Home design: Residential condominium; Condominium common interest
- Construction: Vinyl siding and frame construction
- Exterior features: Deck; Sidewalks; Street lights
Interior
- Kitchen: Dishwasher; Microwave
- Flooring: Carpet; Laminate
- Bathrooms: 1 full bathroom
- Heating & cooling: Forced air heating (natural gas); Central air conditioning
- Interior features: Vaulted ceilings; Breakfast bar; Pantry; Factory-built gas fireplace in the living room
- Laundry & utility: Washer; Dryer; Laundry located in hall in a laundry closet
Neighborhood map
What this means for you Summary
Snapshot
- This is a 2-bed/1.0-bath condo listed at $122k.
Deal economics
- At list price, monthly cash flow is $248 ($3k/yr) — positive.
- The deal already cash-flows at list — no discount required.
- Meets the 1% rule at list price ($2k rent vs $122k).
- Cap rate 8.7% vs local median 2.7% in Marion — top-decile yield for the area; either an underpriced asset or a hidden risk that comps aren't pricing in. Stress-test before assuming the spread holds.
Location & tenants
- Location reads 84/100 on livability (#19 in IA, #633 nationally) — a professional / high-income tenant draw. Strengths: crime A+, cost of living A+, housing A+; Watch: amenities D-, commute F.
- Linn-Mar Community School District (suburban): math 75% / reading 76% proficiency, ranked #44 of 289 in IA (top 15%) — strong family-tenant draw, lease renewals of 3-5y typical; only 16% free/reduced lunch — higher-income household profile.
- Zoned schools: Excelsior Middle School (math 71% / reading 72%, grade A, #106 of 246 statewide, top 44%, 617 students, 28% FRL).
- Market conditions: Rents rising fast (+8.4%/yr); 457 active listings in the ZIP; 3 comparable units currently listed for rent nearby; rentals at typical pace (median 15d on market — plan ~3-4 weeks tenant-placement turnaround); solid renter incomes; 1,023 units permitted in Linn County in 2024 (456 in 5+ unit buildings).
Forward outlook
- Local home prices are declining (-3.0%/yr); year-one equity from $847 of loan paydown is wiped out by about $4k of value loss. Plan a longer hold.
- Linn County population projected at +16% by 2050 — long-run rental-demand tailwind backs the buy-and-hold thesis.
- At projected returns (-3.0% appreciation + 8.0% rent growth), your $34k cash investment doubles in ~8 years — after that, you're playing with house money.
Negotiation context
- Only 7 days on market — expect competitive offers; lowballing is unlikely to land.
- 2 sale attempts with the ask held roughly flat each time — persistent listings suggest the price (not the market) is what's stuck; bring a comps-based counter.
- Current owner paid $73k; list at $122k implies a 68% gain — meaningful room to come down on a strong offer.
Questions for the listing agent
- What does the HOA fee cover, when was the last increase, and are there any pending special assessments or reserve-fund shortfalls?
- Any open or pending special assessments — roof, HVAC, plumbing, elevator, façade? What's the per-unit balance and payoff schedule, and is the seller paying it off at close or rolling it to the buyer?
- Is there a deadline driving the sale (1031 exchange, divorce, estate, relocation)? That informs how much negotiation room exists.
- Schools are A-rated — typically a magnet for longer-tenancy family renters. What's the average tenant stay here, and is there a school-zone premium baked into asking?
- What's the average days-on-market for RENTAL listings here right now (not sales)? A rising rental-DOM trend means longer vacancies and softer asking-rent achievability than the comps imply.
- What's the recent tenant-quality profile in this submarket — average credit score on applications, eviction rate, late-payment / NSF rate, and stable-employment percentage? A property-management company in the area should have these aggregated.
- How much new apartment / multifamily construction is in the pipeline within 1–3 miles? Heavy new supply (>2% of stock underway) typically softens rents 12–24 months out; light construction supports rent growth.
Investment metrics
- 1% rule
- 1.36% ✓
- Cap rate
- 8.73%
- Cash-on-cash
- 8.69%
- DSCR
- 1.39
- GRM
- 6.1
CMA / ARV
No comps found within radius.
Projected returns pro-forma
-3.0% appreciation · 8.0% rent growth · sell at horizon
- IRR
- 3.5%
- Equity multiple
- 1.14×
- Total profit
- $4,918
- Equity at exit
- $18,265
- IRR
- 18.0%
- Equity multiple
- 2.90×
- Total profit
- $65,325
- Equity at exit
- $10,592
Cash invested: $34,300 (down + closing). Projections, not guarantees.
Landlord ↔ Tenant lean methodology
- Overall (STATE)
- 83 Strongly Landlord-Friendly
- State Iowa
- 83 Strongly Landlord-Friendly · R+6
- County
- — inherits STATE
- City
- — inherits STATE
ZIP-level market 52302
- Rents YoY
- 8.4%
- Active inventory
- 457
- Price-to-rent
- 6.1×
Monthly cashflow live
- Estimated rent
- $1,664 medium interval (Pro) →
- Mortgage (P&I)
- −$642
- Tax from tax record
- −$178 /mo · $2,136/yr
- Insurance
- −$51
- HOA
- −$195
- Vacancy / Maint / Mgmt
- −$349
- Net cashflow
- $248
Break-even live
Sensitivity live
| Price | -10% $318 | -5% $283 | +0% $248 | +5% $214 | +10% $179 |
|---|---|---|---|---|---|
| Rent | -10% $117 | -5% $183 | +0% $248 | +5% $314 | +10% $380 |
| Rate | -1.0pp $310 | -0.5pp $279 | base $248 | +0.5pp $217 | +1.0pp $184 |
UW: 25.0% down · 7.5% · 30yr · 1.5% tax · 5.0% vac · 8.0% maint · 8.0% mgmt
Financing live
Cash to close
- Down payment
- $30,625
- Closing costs
- $3,675
- Reserves months
- —
- Total cash needed
- —
Loan-product check · same deal, 3 products live
Conventional
25% down · 7.5% · 30yr
- Down + closing
- —
- Monthly P&I
- —
- Monthly cashflow
- —
- DSCR
- —
- Eligible?
- —
Personal DTI + credit; lowest rate.
DSCR
20% down · 8.5% · 30yr
- Down + closing
- —
- Monthly P&I
- —
- Monthly cashflow
- —
- DSCR
- —
- Eligible?
- —
No personal income docs; deal must DSCR.
Hard money
10% down · 12.0% · 12mo
- Down + closing
- —
- Monthly P&I
- —
- Monthly cashflow
- —
- DSCR
- —
- Eligible?
- —
Short-term bridge; refi at stabilization.
Rent comps 3 comps
| Address | Beds | Baths | Sqft | Rent | $/sqft | DOM | Units | Dist |
|---|---|---|---|---|---|---|---|---|
| 1975 49th St Marion, IA | 3.0 | 2.0 | 1449 | $2,175 | $1.50 | 14d | 1 | 0.25mi |
| 6156 Carlson Way Marion, IA | 1.0–3.0 | 1.0–2.0 | 882 | $1,550 | $1.76 | 14d | 5 | 0.50mi |
| 700 35th St Marion, IA | 2.0 | 1.0–2.0 | 896 | $1,224 | $1.37 | 14d | 1 | 1.02mi |
HOA detail condo
- Monthly dues
- $195 · $2,340/yr
- Assessments
- None detected in remarks — confirm with the listing agent.
Listing history 5 events
-
2026-05-20$122,500 Active 421-char remark
Show marketing remark (421 chars)
Move-in ready condo offering 1,016 sqft with 2 bedrooms and 1 full bathroom! This inviting home features newer carpeting, a bright and airy feel with plenty of natural light, and a spacious kitchen with great cabinet and counter space. The attached 2-car tandem garage offers tons of extra storage and convenience. Association allows up to 2 cats, no dogs, and no rentals. Easy, low-maintenance living in a great setting!
-
2026-05-20$122,500 Active
Show marketing remark (421 chars)
Move-in ready condo offering 1,016 sqft with 2 bedrooms and 1 full bathroom! This inviting home features newer carpeting, a bright and airy feel with plenty of natural light, and a spacious kitchen with great cabinet and counter space. The attached 2-car tandem garage offers tons of extra storage and convenience. Association allows up to 2 cats, no dogs, and no rentals. Easy, low-maintenance living in a great setting!
-
2012-10-26soldstatus $73,000
-
2007-05-31soldstatus $82,000
-
2003-04-25soldstatus $76,777
ⓘ Source: listings_history table (triggers on properties + properties_extension) + one-shot
backfill from property_details.listing_events for pre-trigger history.
Tax reassessment forecast IA · Partial reset (capped growth)
- Current annual tax
- $2,136 · $178/mo
- Projected year-2 tax
- $2,136 · $178/mo
- Expected delta
- $0/yr ($0/mo · 0.0%)
ⓘ Screening estimate from a state-policy table — verify with the county assessor before closing.
Climate risk First Street
- Flood 1/10 Low FEMA zone X (unshaded) · 0% chance over 30 yrs
- Wildfire 1/10 Low
- Heat 3/10 Moderate 7 d/yr ≥103°F today · 15 d/yr by 30 yrs out
- Wind 2/10 Low
- Air quality 2/10 Low 1 unhealthy d/yr today · 2 by 30 yrs out
Nearby sold comps map
Loading sold comps map…
Walkable amenities ~0.75 mi
Loading nearby amenities…
Taxation est. · year 1
- Rental income
- $19,971
- − Mortgage interest
- −$6,862
- − Property taxes
- −$2,136
- − Insurance
- −$612
- − Repairs & maintenance
- −$1,598
- − Management
- −$1,598
- − HOA
- −$2,340
- − Depreciation
- −$3,564
- Taxable income
- $1,261
- Est. tax owed @ 24.0%
- −$303
- After-tax cash flow
- $2,677/yr
For passive investors: Depreciation is non-cash, so a rental often shows a tax loss while cash-flowing — sheltering income. Rental losses are passive: they offset passive income freely, and up to $25,000/yr can offset ordinary (W-2) income if you actively participate and your MAGI is under $100k (phasing out to $0 by $150k); unused losses carry forward. On sale, claimed depreciation is recaptured at up to 25%, and gains may owe capital-gains tax (a 1031 exchange can defer both). Figures are a year-1 estimate at your 24.0% rate — not tax advice; consult a CPA.
Schools (NCES district)
- District
- Linn-Mar Community School District
- NCES district ID
- 1917220
- Math proficiency
- 75% ▼ -7.00%
- Reading proficiency
- 76% ▼ -5.00%
- Median HH income
- $72,473
- Composite
- 66.08/100
- National rank
- #440
- State rank
- #44 of 289 in IA
Livability — Marion
- Score
- 84/100
- State rank
- #19
- US rank
- #633
Category grades
Schools grade is shown separately in the Schools card above.
Census & demographics
- Census place
- Marion, IA
- County
- Linn County · 179,860 people
- City population
- 42,706
- Metro
- Cedar Rapids, IA
- Population (ZIP)
- 42,706
- Household income
- $87,983
- Rent vs Own
- Severe rent burden
- 940.0
Population outlook (Linn County) Hauer SSP2
- Today (2025)
- 239,589 people
- By 2030
- 248,587 · +3.8%
- By 2040
- 264,817 · +10.5%
- By 2050
- 278,685 · +16.3%
- By 2075
- 311,754 · +30.1%
- By 2100
- 336,773 · +40.6%
Race, ethnicity, and origin ACS 2023
- Neighborhood character
- Predominantly White (89%)
- Race & ethnicity
- White 89% Two or more races 4% Hispanic / Latino 3% Black 3% Asian 2%
- Common ancestry
- Portuguese 6% Iranian 3% Slovak 2%
- Foreign-born
- 3% · Canada
- Languages at home
- 96% English-only · Spanish 1% Other Indo-European 1%
Political lean MEDSL · Linn
- 2024 margin
- Lean D (+9.9) · D 54.2% · R 44.3% · Other 1.4%
- 2008→2024 swing
- -11.6pp toward R · 2008: 21.5pp · 2024: 9.9pp
- All cycles
- 2024: D+9.9 2020: D+13.7 2016: D+9.0 2012: D+17.6 2008: D+21.5
Not yet ingested
- Civics
- —
Market trends
- HPI YoY
- ▼ -144.98%
- Current HPI
- 199.2949
- Rent YoY
- ▲ 8.37%
- Metro
- Cedar Rapids, IA
- State GDP YoY
- ▲ 2.48%
- F500 in state
- 4
Industry mix (Fortune 500 HQ in IA)
| Industry | F500 HQs | Revenue |
|---|---|---|
| Financial Services | 1 | $16B |
|
||
| Retail / Convenience | 1 | $15B |
|
||
Price history
+59.6% since first listed5 events — show timeline
- 2026-05-20 Listed $122,500 ICAARMLS
- 2026-05-20 Listed $122,500 CRAAR, CDRMLS
- 2012-10-26 Sold (Public Records) $73,000 Public Records
- 2007-05-31 Sold (Public Records) $82,000 Public Records
- 2003-04-25 Sold (Public Records) $76,777 Public Records
Property tax history
+3.6%/yrLatest (2025): $2,136 · +2.6% YoY. Source: county tax records.
Cash-flow waterfall
monthlySold comps — $/sqft
last 12 mo · ≤1 miLoading sold comps…