 Duplex
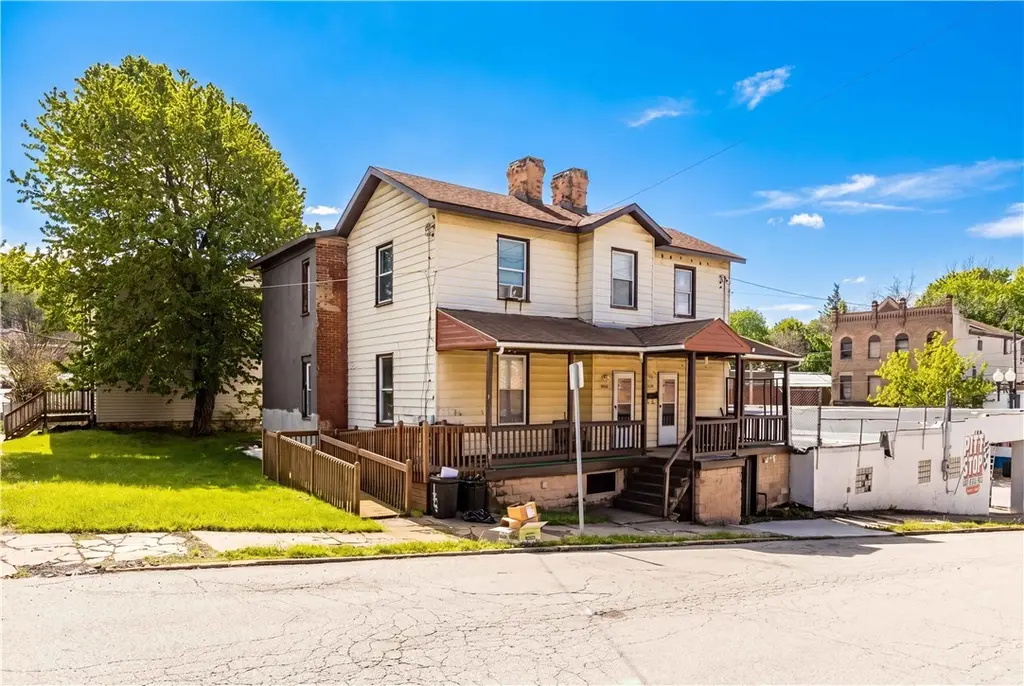
1004-1006 Coal St · Wilkinsburg, PA
Flood risk 8/10 · Major
- FEMA flood zone
- X (unshaded)
- Chance of flooding over 30 yrs
- 0.99%
- Est. flood insurance / yr
- $473 – $860
Fire risk 1/10 · Minimal
- Est. fire insurance / yr
- $511 – $949
Heat risk 4/10 · Minor
- Hot days now (above 96°F)
- 7 days/yr
- Hot days in 30 yrs
- 18 days/yr
Wind risk 2/10 · Minimal
- Chance of severe wind over 30 yrs
- 0.0%
Air-quality risk 4/10 · Minor
- Unhealthy air days now
- 4 days/yr
- Unhealthy air days in 30 yrs
- 5 days/yr
Risk factors via First Street. Map © Google.
Why this score? — see what drove the C+ grade
The composite is a weighted blend of 9 inputs, each scored 0–100. Each bar is that input's sub-score; the figure is the points it added to the 100-point composite (weight × sub-score).
- Cash flow +28.4/30.0
- DSCR +10.0/10.0
- 1% rule +7.8/10.0
- ARV discount +7.5/15.0
- Livability +3.8/5.0
- Rent growth +3.5/5.0
- Condition / age +2.2/5.0
- Schools +1.5/10.0
- Appreciation +0.0/10.0
$175,000
🖨 Deal sheet 📄 Offer letter ✓ Due diligence
Multi-family units
County records classify this as Multi-Family (2-4 Unit). Listing-text estimate: 2 units. confirmed
Listing remarks
This property is currently positioned as a high potential investment opportunity, specifically fo4r those looking for a 2 unit. Each unit has 2 bedrooms and 1 bath. Easy on-street parking. The rear vacant lot parcel #0233-A-00084 is an added bonus with the purchase of the duplex. Must be sold with parcel 0233-A-00080, 0233-A-00083, and 0233-A-00084. "Buyer is purchasing the property "AS IS" means buyer agrees to purchase a property in it's current condition, without any exception of repairs or improvements from the seller with or without all faults whether or not immediately apparent.
Key facts
- 2,770 sq ft lot
- Listed 13 days
Tags
Property features AI
Finance
- Financial info: Gross income reported at $23,400; Maintenance expense reported at $500; Insurance expense reported at $1,250; Unit rents: one unit at $900, one unit at $1,050
- HOA & community: Public transportation nearby
Exterior
- Parking: On-street parking
- Utilities: Electricity available; Natural gas available; Public water available; Sewer available
- Home design: Multi-family property with 2 total units
- Construction: Frame construction; Asphalt roof
- Exterior features: On-street parking; Lot dimensions approximately 50 x 66 x 38 x 66; Zoned Res-d
Interior
- Bedrooms: Two 2-bedroom units
- Bathrooms: Each unit has 1 full bathroom
- Interior features: Unfinished basement
Neighborhood map
What this means for you Summary
Snapshot
- This is a 2 × 2-bed/1.0-bath units multifamily listed at $175k. Condition is rated fair.
Deal economics
- At list price, monthly cash flow is $510 ($6k/yr) — positive. Per door: $255/mo.
- The deal already cash-flows at list — no discount required.
- Meets the 1% rule at list price ($2k rent vs $175k).
Location & tenants
- Location reads 76/100 on livability (#411 in PA, #3,754 nationally) — a middle-class / working-renter tenant base. Strengths: commute A+, cost of living A+, housing A+; Watch: schools D+, health & safety D+, crime F.
- Wilkinsburg Borough SD (suburban): math 14% / reading 23% proficiency, ranked #503 of 539 in PA (top 93%) — low school quality limits family demand, transient renter base, plan for 1-2y turnover; 96% free/reduced lunch — lower-income household profile, screen leases tightly.
- Market conditions: Rents rising (+3.9%/yr); 118 active listings in the ZIP; 25 comparable units currently listed for rent nearby; rentals at typical pace (median 24d on market — plan ~3-4 weeks tenant-placement turnaround); 44% of comp listings sitting > 30 days — soft ceiling on asking rent; 2,996 units permitted in Allegheny County in 2024 (1,588 in 5+ unit buildings).
- At $2,247/mo this rent would consume 49% of the median local household income ($55k/yr) (locally 1933% of renters already pay >50% of income on rent) — very limited rent-growth headroom before tenants either downsize or default.
Forward outlook
- Local home prices are declining (-3.0%/yr); year-one equity from $1k of loan paydown is wiped out by about $5k of value loss. Plan a longer hold.
- At projected returns (-3.0% appreciation + 3.9% rent growth), your $49k cash investment doubles in ~9 years — after that, you're playing with house money.
Negotiation context
- Only 13 days on market — expect competitive offers; lowballing is unlikely to land.
Risks & watch-outs
- Watch-outs: flood insurance adds $56/mo.
- Climate carrying-cost: severe flood risk — expect insurance premiums to compound above CPI over the hold.
Questions for the listing agent
- Can we see the unit-by-unit rent roll, current vacancy, and any below-market leases? What's the average tenancy length?
- What capital expenditures (roof, boiler, parking lot, exteriors) have been made in the last 5 years, and what's planned in the next 2?
- Have any recent inspections been done? Can we get a copy of the seller's disclosures and any deferred-maintenance estimates?
- What's the actual annual flood-insurance premium (NFIP or private), and is the property in a SFHA with mandatory coverage?
- Is there a deadline driving the sale (1031 exchange, divorce, estate, relocation)? That informs how much negotiation room exists.
- Schools are D-rated, which usually means shorter tenancies and higher turnover. Who's the typical renter profile here, and what's been the actual vacancy rate?
- Crime grade is F in this area — have there been break-ins, vandalism, or insurance claims at this property in the last 3 years? What carrier currently insures it and at what premium?
- What's the average days-on-market for RENTAL listings here right now (not sales)? A rising rental-DOM trend means longer vacancies and softer asking-rent achievability than the comps imply.
- What's the recent tenant-quality profile in this submarket — average credit score on applications, eviction rate, late-payment / NSF rate, and stable-employment percentage? A property-management company in the area should have these aggregated.
- How much new apartment / multifamily construction is in the pipeline within 1–3 miles? Heavy new supply (>2% of stock underway) typically softens rents 12–24 months out; light construction supports rent growth.
Investment metrics
- 1% rule
- 1.28% ✓
- Cap rate
- 10.17%
- Cash-on-cash
- 13.85%
- DSCR
- 1.62
- GRM
- 6.5
CMA / ARV
No comps found within radius.
Show comp detail 12 sales within ~0.75 mi
| Address | Dist | Beds/Ba | Sqft | Sold | Price | $/sf | Match |
|---|---|---|---|---|---|---|---|
| 849 Rebecca Ave | 0.25mi | 4/2.0 | — | 4mo | $65,000 | — | 72 |
| 1400 Hill Ave | 0.33mi | 4/2.0 | — | 0mo | $96,000 | — | 72 |
| 539-541 Campbell St | 0.36mi | 4/2.0 | — | 2mo | $40,000 | — | 69 |
| 1142 South Ave | 0.24mi | 4/3.0 | — | 5mo | $42,000 | — | 68 |
| 920-922 Belmont St | 0.21mi | 4/2.0 | — | 16mo | $44,500 | — | 64 |
| 834 Ramsey St | 0.40mi | 4/2.0 | — | 11mo | $180,000 | — | 60 |
| 1400 Marlboro Ave | 0.52mi | 4/2.0 | — | 11mo | $129,900 | — | 54 |
| 315 Barnes St | 0.68mi | 4/3.0 | — | 1mo | $366,000 | — | 51 |
| 436 Ross Ave | 0.50mi | 5/2.0 (+1) | — | 10mo | $250,000 | — | 51 |
| 507 S Trenton Ave | 0.69mi | 4/2.0 | — | 5mo | $230,000 | — | 51 |
| 407 Hampton Ave | 0.64mi | 4/3.0 | — | 7mo | $198,000 | — | 48 |
| 507 Holmes St | 0.50mi | 5/2.5 (+1) | — | 14mo | $159,000 | — | 46 |
Match score weights: distance 35% · size 25% · config 20% · recency 20%. Top-matched comps best support the ARV.
Projected returns pro-forma
-3.0% appreciation · 3.86% rent growth · sell at horizon
- IRR
- 3.2%
- Equity multiple
- 1.13×
- Total profit
- $6,166
- Equity at exit
- $26,093
- IRR
- 13.6%
- Equity multiple
- 2.14×
- Total profit
- $55,677
- Equity at exit
- $15,131
Cash invested: $49,000 (down + closing). Projections, not guarantees.
Landlord ↔ Tenant lean methodology
- Overall (STATE)
- 62 Landlord-Friendly
- State Pennsylvania
- 62 Landlord-Friendly · EVEN
- County
- — inherits STATE
- City
- — inherits STATE
ZIP-level market 15221
- Home prices YoY
- -32.3%
- Rents YoY
- 3.9%
- Active inventory
- 118
- Price-to-rent
- 13.0×
Monthly cashflow live
- Estimated rent
- $2,247 high interval (Pro) →
- Mortgage (P&I)
- −$918
- Tax est. 1.5%
- −$219 /mo · $2,625/yr
- Insurance
- −$73
- Flood insurance flood zone
- −$56 /mo · $666/yr
- HOA
- −$0
- Vacancy / Maint / Mgmt
- −$472
- Net cashflow
- $510
Break-even live
2-unit breakdown (identical units grouped — click to expand)
| Units | Beds | Baths | Est. rent |
|---|---|---|---|
| 2× units | 2 | 1 | $2,246 |
| #1 | 2 | 1 | $1,123 |
| #2 | 2 | 1 | $1,123 |
| Total (2 units) | $2,247 | ||
UW: 25.0% down · 7.5% · 30yr · 1.5% tax · 5.0% vac · 8.0% maint · 8.0% mgmt
Financing live
Cash to close
- Down payment
- $43,750
- Closing costs
- $5,250
- Reserves months
- —
- Total cash needed
- —
Loan-product check · same deal, 3 products live
Conventional
25% down · 7.5% · 30yr
- Down + closing
- —
- Monthly P&I
- —
- Monthly cashflow
- —
- DSCR
- —
- Eligible?
- —
Personal DTI + credit; lowest rate.
DSCR
20% down · 8.5% · 30yr
- Down + closing
- —
- Monthly P&I
- —
- Monthly cashflow
- —
- DSCR
- —
- Eligible?
- —
No personal income docs; deal must DSCR.
Hard money
10% down · 12.0% · 12mo
- Down + closing
- —
- Monthly P&I
- —
- Monthly cashflow
- —
- DSCR
- —
- Eligible?
- —
Short-term bridge; refi at stabilization.
Rent comps 25 comps
| Address | Beds | Baths | Sqft | Rent | $/sqft | DOM | Units | Dist |
|---|---|---|---|---|---|---|---|---|
| 1030 Ross Ave Pittsburgh, PA | 4.0 | 3.5 | 2856 | $2,200 | $0.77 | 1d | 1 | 0.11mi |
| 745 Franklin Ave Pittsburgh, PA | 4.0 | 2.0 | 1948 | $1,599 | $0.82 | 43d | 1 | 0.28mi |
| 1148 East St Pittsburgh, PA | 3.0 | 3.0 | 1738 | $1,700 | $0.98 | 43d | 1 | 0.29mi |
| 734 Franklin Ave Pittsburgh, PA | 3.0 | 1.0 | — | $995 | — | 43d | 1 | 0.31mi |
| 1400 Hill Ave Unit 2 Pittsburgh, PA | 3.0 | 1.0 | — | $950 | — | 43d | 1 | 0.32mi |
| 515 Hill Ave Pittsburgh, PA | 4.0 | 1.0 | 1628 | $1,300 | $0.80 | 43d | 1 | 0.46mi |
| 501 North Ave Wilkinsburg, PA | 4.0 | 2.0 | — | $1,200 | — | 43d | 1 | 0.48mi |
| 565 Ardmore Blvd Pittsburgh, PA | 4.0 | 1.0 | 1368 | $1,450 | $1.06 | 10d | 1 | 0.51mi |
| 1716 Montier St Unit 1718 Pittsburgh, PA | 3.0 | 1.0 | — | $1,300 | — | 43d | 1 | 0.59mi |
| 519-521 S Trenton Ave Pittsburgh, PA | 3.0 | 1.5 | 1360 | $2,600 | $1.91 | 16d | 1 | 0.69mi |
| 407 Biddle Ave #3 Pittsburgh, PA | 3.0 | 1.0 | 1200 | $1,700 | $1.42 | 43d | 1 | 0.72mi |
| 1962 McNary Blvd Pittsburgh, PA | 3.0 | 1.0 | 1517 | $1,545 | $1.02 | 7d | 1 | 0.95mi |
| 2031 Chalfant St Pittsburgh, PA | 3.0 | 1.5 | 1150 | $1,950 | $1.70 | 43d | 1 | 1.05mi |
| 2210 Hampton St Pittsburgh, PA | 3.0 | 1.5 | 1512 | $1,650 | $1.09 | 23d | 1 | 1.20mi |
| 1250 Blackadore Ave Pittsburgh, PA | 3.0 | 1.0 | 1440 | $1,750 | $1.22 | 23d | 1 | 1.32mi |
| 8527 Westwood Rd Pittsburgh, PA | 3.0 | 1.5 | — | $1,900 | — | 7d | 1 | 1.33mi |
| 8606 Westwood Rd Pittsburgh, PA | 4.0 | 1.0 | 1596 | $1,425 | $0.89 | 43d | 1 | 1.33mi |
| 2323 Patterson Ave Pittsburgh, PA | 3.0 | 1.0 | 1440 | $1,800 | $1.25 | 43d | 1 | 1.37mi |
| 2323 Patterson Ave Unit NA Pittsburgh, PA | 3.0 | 1.0 | 1440 | $1,500 | $1.04 | 23d | 1 | 1.37mi |
| 8918 Frankstown Rd Pittsburgh, PA | 3.0 | 1.0 | 1400 | $1,907 | $1.36 | 14d | 1 | 1.40mi |
| 8918 Frankstown Rd Pittsburgh, PA | 3.0 | 1.0 | — | $1,505 | — | 23d | 1 | 1.40mi |
| 2219 Manor Ave Pittsburgh, PA | 3.0 | 1.0 | 1638 | $1,600 | $0.98 | 23d | 1 | 1.46mi |
| 508 S Lang Ave Pittsburgh, PA | 4.0 | 3.0 | — | $4,000 | — | 14d | 1 | 1.47mi |
| 7138 Race St Pittsburgh, PA | 5.0 | 2.0 | 2500 | $2,500 | $1.00 | 1d | 1 | 1.49mi |
| 7225 Whipple St Unit 72255 Pittsburgh, PA | 3.0 | 1.5 | 1440 | $1,695 | $1.18 | 2d | 1 | 1.49mi |
Listing history 9 events
-
2026-06-18days on market $175,000 Active 13 DOM
-
2026-06-17days on market $175,000 Active 12 DOM
-
2026-06-16days on market $175,000 Active 11 DOM
-
2026-06-15days on market $175,000 Active 10 DOM
-
2026-06-13days on market $175,000 Active 8 DOM
-
2026-06-09days on market $175,000 Active 4 DOM
-
2026-06-08days on market $175,000 Active 3 DOM
-
2026-06-07remarks 591-char remark
-
2026-06-07$175,000 Active 2 DOM
ⓘ Source: listings_history table (triggers on properties + properties_extension) + one-shot
backfill from property_details.listing_events for pre-trigger history.
Climate risk First Street
- Flood 8/10 Severe FEMA zone X (unshaded) · 99% chance over 30 yrs
- Wildfire 1/10 Low
- Heat 4/10 Moderate 7 d/yr ≥96°F today · 18 d/yr by 30 yrs out
- Wind 2/10 Low 0% chance of damaging wind over 30 yrs
- Air quality 4/10 Moderate 4 unhealthy d/yr today · 5 by 30 yrs out
Nearby sold comps map
Loading sold comps map…
Walkable amenities ~0.75 mi
Loading nearby amenities…
Taxation est. · year 1
- Rental income
- $26,964
- − Mortgage interest
- −$9,803
- − Property taxes
- −$2,625
- − Insurance
- −$1,542
- − Repairs & maintenance
- −$2,157
- − Management
- −$2,157
- − Depreciation
- −$5,091
- Taxable income
- $3,590
- Est. tax owed @ 24.0%
- −$862
- After-tax cash flow
- $5,261/yr
For passive investors: Depreciation is non-cash, so a rental often shows a tax loss while cash-flowing — sheltering income. Rental losses are passive: they offset passive income freely, and up to $25,000/yr can offset ordinary (W-2) income if you actively participate and your MAGI is under $100k (phasing out to $0 by $150k); unused losses carry forward. On sale, claimed depreciation is recaptured at up to 25%, and gains may owe capital-gains tax (a 1031 exchange can defer both). Figures are a year-1 estimate at your 24.0% rate — not tax advice; consult a CPA.
Condition & rehab AI · 5 photos
This multi-family property requires extensive repairs and updates to improve its condition and increase its value.
Repairs flagged
- Major roof — The roof is visibly in poor condition and requires immediate attention.
- Major exterior siding — The siding is peeling and needs repainting.
- Major front porch — The porch has missing or damaged railings, which need repair.
- Major flooring — The flooring is old and in need of replacement.
- Major interior walls — The walls show signs of wear and potential water damage.
- Major bathrooms — The bathrooms are outdated and in need of updates.
- Major kitchen — The kitchen is outdated and in need of updates.
- Major HVAC system — The HVAC system appears old and may need replacement.
Value-add opportunities
- Both repair roof — A new roof will improve the home's appearance and increase its value.
- Both repair and paint exterior siding — A fresh coat of paint will improve the home's curb appeal and increase its value.
- Both repair and update front porch — A repaired and updated porch will enhance the home's appeal and increase its value.
- Both replace flooring — New flooring will improve the home's appearance and increase its value.
- Both repair and update interior walls — A repaired and updated interior will improve the home's appearance and increase its value.
- Both update bathrooms — Updated bathrooms will improve the home's appearance and increase its value.
- Both update kitchen — A new kitchen will improve the home's appearance and increase its value.
- Both replace HVAC system — A new HVAC system will improve the home's comfort and increase its value.
Renovation cost estimate screening
| Repair item | Severity | Est. cost |
|---|---|---|
| roof · The roof is visibly in poor condition and requires immediate attention. | Major | $15,000–50,000 |
| exterior siding · The siding is peeling and needs repainting. | Major | $15,000–50,000 |
| front porch · The porch has missing or damaged railings, which need repair. | Major | $15,000–50,000 |
| flooring · The flooring is old and in need of replacement. | Major | $15,000–50,000 |
| interior walls · The walls show signs of wear and potential water damage. | Major | $15,000–50,000 |
| bathrooms · The bathrooms are outdated and in need of updates. | Major | $15,000–50,000 |
| kitchen · The kitchen is outdated and in need of updates. | Major | $15,000–50,000 |
| HVAC system · The HVAC system appears old and may need replacement. | Major | $15,000–50,000 |
| Total estimated repair cost · 8 items | $120,000–400,000 |
Value-add ROI direction
- Both repair roof — A new roof will improve the home's appearance and increase its value. ↑
- Both repair and paint exterior siding — A fresh coat of paint will improve the home's curb appeal and increase its value. ↑
- Both repair and update front porch — A repaired and updated porch will enhance the home's appeal and increase its value. ↑
- Both replace flooring — New flooring will improve the home's appearance and increase its value. ↑
- Both repair and update interior walls — A repaired and updated interior will improve the home's appearance and increase its value. ↑
- Both update bathrooms — Updated bathrooms will improve the home's appearance and increase its value. ↑
- Both update kitchen — A new kitchen will improve the home's appearance and increase its value. ↑
- Both replace HVAC system — A new HVAC system will improve the home's comfort and increase its value. ↑
ⓘ Cost ranges are severity-bucket heuristics (US national rule-of-thumb). Get contractor quotes + a written scope before underwriting a rehab budget.
Schools (NCES district)
- District
- Wilkinsburg Borough SD
- NCES district ID
- 4226370
- Math proficiency
- 14% ▼ -8.00%
- Reading proficiency
- 23% ▼ -9.00%
- Median HH income
- $32,204
- Composite
- 14.94/100
- National rank
- #9368
- State rank
- #503 of 539 in PA
Livability — Wilkinsburg
- Score
- 76/100
- State rank
- #411
- US rank
- #3754
Category grades
Schools grade is shown separately in the Schools card above.
Census & demographics
- Census place
- Wilkinsburg, PA
- County
- Allegheny County · 1,022,028 people
- City population
- 29,513
- Metro
- Pittsburgh, PA
- Population (ZIP)
- 29,374
- Household income
- $55,028
- Rent vs Own
- Severe rent burden
- 1933.0
Population outlook (Allegheny County) Hauer SSP2
- Today (2025)
- 1,250,282 people
- By 2030
- 1,256,482 · +0.5%
- By 2040
- 1,256,318 · +0.5%
- By 2050
- 1,244,169 · -0.5%
- By 2075
- 1,197,693 · -4.2%
- By 2100
- 1,093,187 · -12.6%
Race, ethnicity, and origin ACS 2023
- Neighborhood character
- Diverse neighborhood (Simpson 0.60)
- Race & ethnicity
- White 47% Black 43% Two or more races 7% Hispanic / Latino 4% Asian 1%
- Common ancestry
- Romanian 4% Lithuanian 2% Serbian 1%
- Foreign-born
- 4% · Canada, South Korea, China
- Languages at home
- 93% English-only · Spanish 2% French/Haitian/Cajun 1% Other Indo-European 1%
Political lean MEDSL · Allegheny
- 2024 margin
- Strong D (+20.3) · D 59.7% · R 39.4%
- 2008→2024 swing
- +4.8pp toward D · 2008: 15.5pp · 2024: 20.3pp
- All cycles
- 2024: D+20.3 2020: D+20.4 2016: D+16.4 2012: D+14.4 2008: D+15.5
Not yet ingested
- Civics
- —
Market trends
- HPI YoY
- ▼ -109.77%
- Current HPI
- 230.0486
- Rent YoY
- ▲ 3.86%
- Metro
- Pittsburgh, PA
- State GDP YoY
- ▲ 1.68%
- F500 in state
- 34
Industry mix (Fortune 500 HQ in PA)
| Industry | F500 HQs | Revenue |
|---|---|---|
| Healthcare | 2 | $309B |
|
||
| Insurance | 2 | $27B |
|
||
| Telecommunications / Media | 1 | $124B |
|
||
| Industrial Distribution | 1 | $22B |
|
||
| Financial Services | 1 | $20B |
|
||
| Chemicals / Materials | 1 | $18B |
|
||
Price history
1 event — show timeline
- 2026-06-05 Listed $175,000 West Penn MLS
Cash-flow waterfall
monthlySold comps — $/sqft
last 12 mo · ≤1 miLoading sold comps…