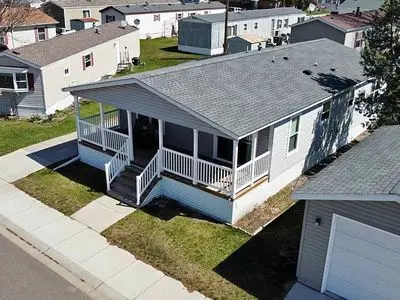
10487 Pierce St NE · Blaine, MN
Flood risk 1/10 · Minimal
- FEMA flood zone
- X (unshaded)
- Chance of flooding over 30 yrs
- 0.0%
- Est. flood insurance / yr
- $507 – $1,088
Fire risk 1/10 · Minimal
- Est. fire insurance / yr
- $888 – $1,650
Heat risk 2/10 · Minimal
- Hot days now (above 100°F)
- 7 days/yr
- Hot days in 30 yrs
- 14 days/yr
Wind risk 2/10 · Minimal
- Chance of severe wind over 30 yrs
- —
Air-quality risk 2/10 · Minimal
- Unhealthy air days now
- 2 days/yr
- Unhealthy air days in 30 yrs
- 2 days/yr
Risk factors via First Street. Map © Google.
Why this score? — see what drove the B grade
The composite is a weighted blend of 9 inputs, each scored 0–100. Each bar is that input's sub-score; the figure is the points it added to the 100-point composite (weight × sub-score).
- Cash flow +30.0/30.0
- DSCR +10.0/10.0
- 1% rule +9.9/10.0
- ARV discount +7.5/15.0
- Schools +4.7/10.0
- Condition / age +3.8/5.0
- Rent growth +3.7/5.0
- Livability +3.6/5.0
- Appreciation +0.0/10.0
$129,900
🖨 Deal sheet 📄 Offer letter ✓ Due diligence
Listing remarks
Welcome home to this beautifully maintained 2014 Schult 28x56 doublewide in Blaine International Village. This 3 bedroom, 2 full bathroom home is move-in ready and has been exceptionally cared for, showing true pride of ownership throughout. Located directly across from a park in a quiet, family-friendly community with welcoming neighbors and a safe atmosphere, this home is perfect for families or anyone looking for comfortable, affordable living in Blaine. Inside, you & acirc; & euro; & trade; ll find a spacious open layout with upgraded finishes, a large kitchen and living area ideal for gathering, plus all appliances included. The home also features central air, off-street pa
Key facts
- Utility shed
- Across from a park
- Large kitchen
Tags
Neighborhood map
What this means for you Summary
Snapshot
- This is a 3-bed/2.0-bath manufactured listed at $130k. Condition is rated good.
Deal economics
- At list price, monthly cash flow is $730 ($9k/yr) — positive.
- The deal already cash-flows at list — no discount required.
- Meets the 1% rule at list price ($2k rent vs $130k).
- Recommended offer: $128k (1.5% below list) — sets the bar for market timing.
- Cap rate 13.0% vs local median 3.9% in Blaine — top-decile yield for the area; either an underpriced asset or a hidden risk that comps aren't pricing in. Stress-test before assuming the spread holds.
Location & tenants
- Location reads 71/100 on livability (#315 in MN) — a middle-class / working-renter tenant base. Strengths: employment A+, housing A+, crime A; Watch: amenities F, commute F.
- Anoka-Hennepin Public School District (suburban): math 49% / reading 55% proficiency, ranked #71 of 301 in MN (top 24%) — acceptable for families but not a draw, mixed tenant base, ~2y average lease.
- Market conditions: Rents rising fast (+4.8%/yr); 109 active listings in the ZIP; 5 comparable units currently listed for rent nearby; rentals at typical pace (median 20d on market — plan ~3-4 weeks tenant-placement turnaround); 40% of comp listings sitting > 30 days — soft ceiling on asking rent; solid renter incomes; 1,083 units permitted in Anoka County in 2024 (134 in 5+ unit buildings).
Forward outlook
- Local home prices are declining (-3.0%/yr); year-one equity from $898 of loan paydown is wiped out by about $4k of value loss. Plan a longer hold.
- Anoka County population projected at +11% by 2050 — modest demand growth; plan on rents tracking national, not racing it.
- At projected returns (-3.0% appreciation + 4.8% rent growth), your $36k cash investment doubles in ~5 years — after that, you're playing with house money.
Negotiation context
- It's been on market 21 days — a 2% lower offer ($128k) is reasonable based on typical stale-listing flexibility.
Questions for the listing agent
- Is there a deadline driving the sale (1031 exchange, divorce, estate, relocation)? That informs how much negotiation room exists.
- Schools are B-rated — typically a magnet for longer-tenancy family renters. What's the average tenant stay here, and is there a school-zone premium baked into asking?
- What's the average days-on-market for RENTAL listings here right now (not sales)? A rising rental-DOM trend means longer vacancies and softer asking-rent achievability than the comps imply.
- What's the recent tenant-quality profile in this submarket — average credit score on applications, eviction rate, late-payment / NSF rate, and stable-employment percentage? A property-management company in the area should have these aggregated.
- How much new for-sale + rental construction is in the pipeline within 1–3 miles? Heavy new supply typically softens prices + rents 12–24 months out; constrained supply supports both.
Investment metrics
- 1% rule
- 1.49% ✓
- Cap rate
- 13.04%
- Cash-on-cash
- 24.10%
- DSCR
- 2.07
- GRM
- 5.6
CMA / ARV
No comps found within radius.
Projected returns pro-forma
-3.0% appreciation · 4.79% rent growth · sell at horizon
- IRR
- 19.2%
- Equity multiple
- 1.80×
- Total profit
- $28,985
- Equity at exit
- $19,369
- IRR
- 28.7%
- Equity multiple
- 3.75×
- Total profit
- $100,094
- Equity at exit
- $11,231
Cash invested: $36,372 (down + closing). Projections, not guarantees.
Landlord ↔ Tenant lean methodology
- Overall (STATE)
- 46 Balanced
- State Minnesota
- 46 Balanced · D+2
- County
- — inherits STATE
- City
- — inherits STATE
ZIP-level market 55434
- Rents YoY
- 4.8%
- Active inventory
- 109
- Price-to-rent
- 5.6×
Monthly cashflow live
- Estimated rent
- $1,933 high interval (Pro) →
- Mortgage (P&I)
- −$681
- Tax from tax record
- −$61 /mo · $734/yr
- Insurance
- −$54
- HOA
- −$0
- Vacancy / Maint / Mgmt
- −$406
- Net cashflow
- $730
Break-even live
UW: 25.0% down · 7.5% · 30yr · 1.5% tax · 5.0% vac · 8.0% maint · 8.0% mgmt
Financing live
Cash to close
- Down payment
- $32,475
- Closing costs
- $3,897
- Reserves months
- —
- Total cash needed
- —
Loan-product check · same deal, 3 products live
Conventional
25% down · 7.5% · 30yr
- Down + closing
- —
- Monthly P&I
- —
- Monthly cashflow
- —
- DSCR
- —
- Eligible?
- —
Personal DTI + credit; lowest rate.
DSCR
20% down · 8.5% · 30yr
- Down + closing
- —
- Monthly P&I
- —
- Monthly cashflow
- —
- DSCR
- —
- Eligible?
- —
No personal income docs; deal must DSCR.
Hard money
10% down · 12.0% · 12mo
- Down + closing
- —
- Monthly P&I
- —
- Monthly cashflow
- —
- DSCR
- —
- Eligible?
- —
Short-term bridge; refi at stabilization.
Rent comps 5 comps
| Address | Beds | Baths | Sqft | Rent | $/sqft | DOM | Units | Dist |
|---|---|---|---|---|---|---|---|---|
| 249 99th Ave NE Unit 241-307 Blaine, MN | 2.0 | 1.0 | 875 | $1,445 | $1.65 | 19d | 1 | 1.20mi |
| 249 99th Ave NE Unit 249-308 Blaine, MN | 2.0 | 1.0 | 875 | $1,430 | $1.63 | 43d | 1 | 1.20mi |
| 249 99th Ave NE Unit 241-107 Blaine, MN | 2.0 | 1.0 | 875 | $1,445 | $1.65 | 43d | 1 | 1.20mi |
| 9436 Ulysses St NE Minneapolis, MN | 2.0 | 1.0–2.0 | 775 | $2,095 | $2.70 | 1d | 10 | 1.22mi |
| 9460 Ulysses St NE Blaine, MN | 2.0 | 1.0–2.0 | 846 | $2,294 | $2.71 | 1d | 6 | 1.23mi |
Listing history 15 events
-
2026-06-18days on market $129,900 Active 21 DOM
-
2026-06-17days on market $129,900 Active 20 DOM
-
2026-06-16days on market $129,900 Active 19 DOM
-
2026-06-15days on market $129,900 Active 18 DOM
-
2026-06-13days on market $129,900 Active 16 DOM
-
2026-06-13days on market $129,900 Active 15 DOM
-
2026-06-09days on market $129,900 Active 12 DOM
-
2026-06-08days on market $129,900 Active 11 DOM
-
2026-06-07days on market $129,900 Active 10 DOM
-
2026-06-04days on market $129,900 Active 7 DOM
-
2026-06-03days on market $129,900 Active 6 DOM
-
2026-06-02days on market $129,900 Active 5 DOM
-
2026-06-01days on market $129,900 Active 4 DOM
-
2026-05-31days on market $129,900 Active 3 DOM
-
2026-05-29$129,900 Active
ⓘ Source: listings_history table (triggers on properties + properties_extension) + one-shot
backfill from property_details.listing_events for pre-trigger history.
Tax reassessment forecast MN · Partial reset (capped growth)
- Current annual tax
- $734 · $61/mo
- Projected year-2 tax
- $1,094 · $91/mo
- Expected delta
- +$361/yr (+$30/mo · 49.2%)
ⓘ Screening estimate from a state-policy table — verify with the county assessor before closing.
Climate risk First Street
- Flood 1/10 Low FEMA zone X (unshaded) · 0% chance over 30 yrs
- Wildfire 1/10 Low
- Heat 2/10 Low 7 d/yr ≥100°F today · 14 d/yr by 30 yrs out
- Wind 2/10 Low
- Air quality 2/10 Low 2 unhealthy d/yr today · 2 by 30 yrs out
Nearby sold comps map
Loading sold comps map…
Walkable amenities ~0.75 mi
Loading nearby amenities…
Taxation est. · year 1
- Rental income
- $23,194
- − Mortgage interest
- −$7,276
- − Property taxes
- −$734
- − Insurance
- −$650
- − Repairs & maintenance
- −$1,856
- − Management
- −$1,856
- − Depreciation
- −$3,779
- Taxable income
- $7,045
- Est. tax owed @ 24.0%
- −$1,691
- After-tax cash flow
- $7,075/yr
For passive investors: Depreciation is non-cash, so a rental often shows a tax loss while cash-flowing — sheltering income. Rental losses are passive: they offset passive income freely, and up to $25,000/yr can offset ordinary (W-2) income if you actively participate and your MAGI is under $100k (phasing out to $0 by $150k); unused losses carry forward. On sale, claimed depreciation is recaptured at up to 25%, and gains may owe capital-gains tax (a 1031 exchange can defer both). Figures are a year-1 estimate at your 24.0% rate — not tax advice; consult a CPA.
Condition & rehab AI · 1 photo
This 2014 Schult 28x56 doublewide is move-in ready and exceptionally cared for, showing true pride of ownership. It offers a spacious open layout with upgraded finishes and is located in a quiet, family-friendly community.
Value-add opportunities
- Both Painting exterior and interior — Enhances curb appeal and interior aesthetics
- Both Landscaping improvements — Enhances curb appeal and adds value
- Both New roof inspection — Ensures durability and adds value
Renovation cost estimate screening
Value-add ROI direction
- Both Painting exterior and interior — Enhances curb appeal and interior aesthetics ↑
- Both Landscaping improvements — Enhances curb appeal and adds value ↑
- Both New roof inspection — Ensures durability and adds value ↑
ⓘ Cost ranges are severity-bucket heuristics (US national rule-of-thumb). Get contractor quotes + a written scope before underwriting a rehab budget.
Schools (NCES district)
- District
- Anoka-Hennepin Public School District
- NCES district ID
- 2703180
- Math proficiency
- 49% ▼ -14.00%
- Reading proficiency
- 55% ▼ -10.00%
- Median HH income
- $73,837
- Composite
- 46.7/100
- National rank
- #2400
- State rank
- #71 of 301 in MN
Livability — Blaine
- Score
- 71/100
- State rank
- #315
- US rank
- #7073
Category grades
Schools grade is shown separately in the Schools card above.
Census & demographics
- Census place
- Blaine, MN
- County
- Anoka County · 277,116 people
- City population
- 67,472
- Metro
- Minneapolis-St. Paul-Bloomington, MN-WI
- Population (ZIP)
- 33,029
- Household income
- $90,336
- Rent vs Own
- Severe rent burden
- 526.0
Population outlook (Anoka County) Hauer SSP2
- Today (2025)
- 375,223 people
- By 2030
- 387,850 · +3.4%
- By 2040
- 407,239 · +8.5%
- By 2050
- 417,541 · +11.3%
- By 2075
- 448,447 · +19.5%
- By 2100
- 464,954 · +23.9%
Race, ethnicity, and origin ACS 2023
- Neighborhood character
- Predominantly White (69%)
- Race & ethnicity
- White 69% Asian 10% Black 9% Two or more races 8% Hispanic / Latino 6%
- Hispanic origin (detail)
- Mexican 4%
- Common ancestry
- Portuguese 10% Romanian 5% Italian 2%
- Foreign-born
- 15% · Canada, Vietnam, China
- Languages at home
- 79% English-only · Spanish 5% Other Asian/Pacific 2% Vietnamese 2%
Political lean MEDSL · Anoka
- 2024 margin
- Toss-up / Even · D 46.6% · R 51.0% · Other 2.4%
- 2008→2024 swing
- -2.0pp toward R · 2008: -2.4pp · 2024: -4.4pp
- All cycles
- 2024: R+4.4 2020: R+1.9 2016: R+9.7 2012: R+2.6 2008: R+2.4
Not yet ingested
- Civics
- —
Market trends
- HPI YoY
- ▼ -230.62%
- Current HPI
- 254.0422
- Rent YoY
- ▲ 4.79%
- Metro
- Minneapolis-St. Paul-Bloomington, MN-WI
- State GDP YoY
- ▲ 2.41%
- F500 in state
- 34
Industry mix (Fortune 500 HQ in MN)
| Industry | F500 HQs | Revenue |
|---|---|---|
| Healthcare | 2 | $407B |
|
||
| Retail | 2 | $150B |
|
||
| Consumer Goods | 2 | $32B |
|
||
| Industrial Machinery | 2 | $6B |
|
||
| Agriculture | 1 | $40B |
|
||
| Healthcare / Medical Devices | 1 | $32B |
|
||
Price history
1 event — show timeline
- 2026-05-29 Listed $129,900 FSBO.com
Property tax history
+10.3%/yrLatest (2026): $734 · +5.3% YoY. Source: county tax records.
Cash-flow waterfall
monthlySold comps — $/sqft
last 12 mo · ≤1 miLoading sold comps…