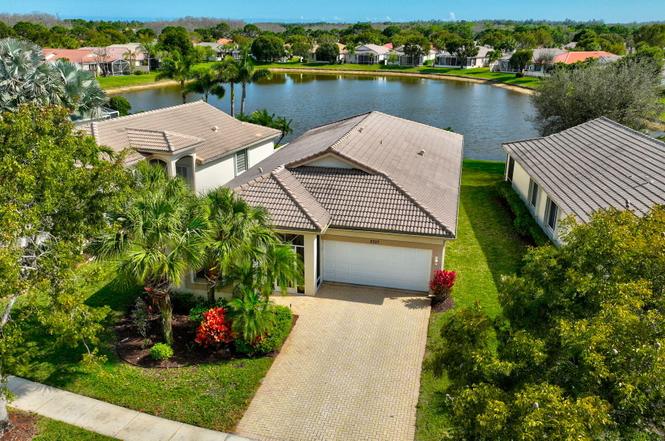
2707 Clipper Cir · West Palm Beach, FL
Flood risk 1/10 · Minimal
- FEMA flood zone
- X (unshaded)
- Chance of flooding over 30 yrs
- 0.0%
- Est. flood insurance / yr
- $507 – $1,088
Fire risk 7/10 · Major
- Est. fire insurance / yr
- $947 – $1,759
Heat risk 9/10 · Severe
- Hot days now (above 107°F)
- 7 days/yr
- Hot days in 30 yrs
- 25 days/yr
Wind risk 10/10 · Severe
- Chance of severe wind over 30 yrs
- 99.0%
Air-quality risk 2/10 · Minimal
- Unhealthy air days now
- 0 days/yr
- Unhealthy air days in 30 yrs
- 1 days/yr
Risk factors via First Street. Map © Google.
Why this score? — see what drove the D- grade
The composite is a weighted blend of 9 inputs, each scored 0–100. Each bar is that input's sub-score; the figure is the points it added to the 100-point composite (weight × sub-score).
- Appreciation +10.0/10.0
- ARV discount +7.5/15.0
- Cash flow +5.4/30.0
- Schools +4.3/10.0
- Livability +4.1/5.0
- Rent growth +2.7/5.0
- 1% rule +2.6/10.0
- Condition / age +2.5/5.0
- DSCR +0.0/10.0
$424,900
🖨 Deal sheet (PDF) 📄 Offer letter ✓ Due diligence
Listing remarks
SPECTACULAR LAKE VIEWS. 3/2, Extended Lanai over Lake in this Nantucket Model in Baywinds, Prestigious 55+ Pet-Friendly Resort Style Community. Dramatic Entry Foyer & Long Hall Lead to Open Plan Living, LR, DR, Family Rm w Triple Sliders to Enclosed Lanai. EIK w Black Granite Counters, Pantry. Chef's Island, Café Area, En-Suite PBR Huge Walkin Tpl Mirrored Drs, Addl Closet, PBA has Dual Vanities, Sep Upd Stall Shower, Jacuzzi Jetted Tub, Block Glass Window for Natural Light. Vaulted Ceilings, All Furn Can Be Inc. Accordion Shutters 1 yr. Too Many Features to Name. Must be Seen. Maint incl Cable w Prem Channels, 3 Boxes, DVR, Hi-Speed Internet, Landline + ADT. Country Club Livin
Key facts
- Chef's island
- Lake views
- Open plan living
Tags
Property features AI
Finance
- Other: Private maintained road; Senior community
- Financial info: Pets allowed with possible restrictions (breed and number limits may apply)
- HOA & community: Association managed by CMC Property Management; Monthly HOA fee (approx.) $649; HOA includes cable TV, grounds maintenance, security, trash, common areas, common real estate tax, and recreation facility; Community amenities: clubhouse, pool, fitness center, sauna, spa/hot tub, tennis courts, pickleball courts, bocce ball, billiard room, jogging path, sidewalks, library, manager on site, internet included
Exterior
- Parking: Attached 2-car garage with garage door opener; Two covered parking spaces (total parking for 4)
- Security: Gated community with guard
- Utilities: Public water; Public sewer; Cable available; Water and sewer available
- Home design: Single-family residence; One story; Resale condition; Faces northwest
- Construction: CBS construction; Spanish tile roof
- Exterior features: Screened patio; Patio; Room for a pool; Waterfront
Interior
- Kitchen: Disposal; Dishwasher; Electric range; Microwave; Kitchen island
- Bedrooms: Three main-level bedrooms
- Flooring: Carpet; Ceramic tile
- Bathrooms: Two full bathrooms (both on main level)
- Heating & cooling: Central electric heating; Central air; Ceiling fans
- Interior features: Cathedral ceilings; Vaulted ceilings; Entrance foyer; Kitchen island; Walk-in closets; Split bedroom layout; Roman tub
- Laundry & utility: Indoor laundry; Laundry tub
Neighborhood map
What this means for you Summary
Snapshot
- This is a 3-bed/2.0-bath single-family listed at $425k.
Deal economics
- At list price, monthly cash flow is $-926 ($-11k/yr) — negative.
- To cash-flow at today's rent, offer at most $261k (38.5% below list).
- To meet the 1% rule (rent ≥ 1% of price), the offer needs to be $321k (24.4% below list).
- Recommended offer: $261k (38.5% below list) — sets the bar for cash-flow.
Location & tenants
- Location reads 82/100 on livability (#75 in FL, #1,255 nationally) — a professional / high-income tenant draw. Strengths: commute A+, housing A+, health & safety A+; Watch: employment C-, crime F.
- Palm Beach (suburban): math 46% / reading 53% proficiency, ranked #34 of 73 in FL (top 47%) — families likely to look elsewhere, expect single-tenant / working-renter base with shorter leases.
- Zoned schools: Benoist Farms Elementary School (math 22% / reading 28%, grade F, #2,030 of 2,144 statewide, top 95%, 421 students, 80% FRL); Jeaga Middle School (math 18% / reading 30%, grade F, #532 of 571 statewide, top 94%, 941 students, 78% FRL); Palm Beach Lakes High School (math 17% / reading 26%, grade F, #546 of 667 statewide, top 82%, 2,688 students, 70% FRL) — zoned schools average 76% FRL vs 52% district-wide (24 pts higher); higher-poverty schools than district average — tighter screening recommended.
- Zoned-school proficiency averages 24% at this address vs 50% district-wide (-26 pts) — the specific schools serving this property underperform the Palm Beach average; the district grade overstates school quality for this exact location.
- Market conditions: Rents flat; 583 active listings in the ZIP; 23 comparable units currently listed for rent nearby; rentals at typical pace (median 27d on market — plan ~3-4 weeks tenant-placement turnaround); solid renter incomes; 3,974 units permitted in Palm Beach County in 2024 (1,012 in 5+ unit buildings).
- This rent runs 42% of the median local income ($93k/yr) — at the standard rent-burdened threshold; future hikes will face affordability resistance.
Forward outlook
- In year one you build about $45k of equity ($3k loan paydown + $42k appreciation (10.0% local appreciation)).
- Palm Beach County population projected at +30% by 2050 — long-run rental-demand tailwind backs the buy-and-hold thesis.
- By year 2, paydown + projected appreciation supports a ~$73k cash-out refi (75% LTV) — recoverable capital for the next deal without selling this one.
Negotiation context
- It's been on market 89 days — a 6% lower offer ($399k) is reasonable based on typical stale-listing flexibility.
Risks & watch-outs
- Watch-outs: HOA is 20% of rent.
- Climate carrying-cost: severe wind risk, 99% chance of damaging wind over 30y; major wildfire risk; extreme-heat days projected 7→25/yr by 2055 (HVAC capex compounding) — expect insurance premiums to compound above CPI over the hold.
Questions for the listing agent
- What do current leases actually rent for vs. the listed asking? Can we see a recent rent roll and the last 12 months of T-12 income?
- It's been on market 89 days. Have you received any prior offers? Is the seller open to a 38% concession, seller financing, or rate buy-down credit?
- What does the HOA fee cover, when was the last increase, and are there any pending special assessments or reserve-fund shortfalls?
- Why hasn't it sold? Are there any deal-killer items the seller is aware of (foundation, flood, title, zoning, code violations)?
- Is there a deadline driving the sale (1031 exchange, divorce, estate, relocation)? That informs how much negotiation room exists.
- Crime grade is F in this area — have there been break-ins, vandalism, or insurance claims at this property in the last 3 years? What carrier currently insures it and at what premium?
- The area grade is low — what's the realistic commute time and amenity access for the typical tenant pool here? Any planned neighborhood developments (good or bad) we should know about?
- What's the average days-on-market for RENTAL listings here right now (not sales)? A rising rental-DOM trend means longer vacancies and softer asking-rent achievability than the comps imply.
- What's the recent tenant-quality profile in this submarket — average credit score on applications, eviction rate, late-payment / NSF rate, and stable-employment percentage? A property-management company in the area should have these aggregated.
- How much new for-sale + rental construction is in the pipeline within 1–3 miles? Heavy new supply typically softens prices + rents 12–24 months out; constrained supply supports both.
Investment metrics
- 1% rule
- 0.76% ✗
- Cap rate
- 3.68%
- Cash-on-cash
- -9.34%
- DSCR
- 0.58
- GRM
- 11.0
CMA / ARV
No comps found within radius.
Projected returns pro-forma
10.0% appreciation · 0.85% rent growth · sell at horizon
- IRR
- 17.1%
- Equity multiple
- 2.40×
- Total profit
- $166,021
- Equity at exit
- $382,784
- IRR
- 15.8%
- Equity multiple
- 5.40×
- Total profit
- $523,382
- Equity at exit
- $825,487
Cash invested: $118,972 (down + closing). Projections, not guarantees.
Landlord ↔ Tenant lean methodology
- Overall (STATE)
- 87 Strongly Landlord-Friendly
- State Florida
- 87 Strongly Landlord-Friendly · R+3
- County
- — inherits STATE
- City
- — inherits STATE
ZIP-level market 33411
- Home prices YoY
- 1.9%
- Rents YoY
- 0.8%
- Active inventory
- 583
- Price-to-rent
- 11.0×
Monthly cashflow live
- Estimated rent
- $3,213 high interval (Pro) →
- Mortgage (P&I)
- −$2,228
- Tax from tax record
- −$409 /mo · $4,912/yr
- Insurance
- −$177
- HOA
- −$649
- Vacancy / Maint / Mgmt
- −$675
- Net cashflow
- $-926
Break-even live
Sensitivity live
| Price | -10% $-685 | -5% $-805 | +0% $-926 | +5% $-1,046 | +10% $-1,166 |
|---|---|---|---|---|---|
| Rent | -10% $-1,180 | -5% $-1,053 | +0% $-926 | +5% $-799 | +10% $-672 |
| Rate | -1.0pp $-712 | -0.5pp $-818 | base $-926 | +0.5pp $-1,036 | +1.0pp $-1,148 |
UW: 25.0% down · 7.5% · 30yr · 1.5% tax · 5.0% vac · 8.0% maint · 8.0% mgmt
Financing live
Cash to close
- Down payment
- $106,225
- Closing costs
- $12,747
- Reserves months
- —
- Total cash needed
- —
Loan-product check · same deal, 3 products live
Conventional
25% down · 7.5% · 30yr
- Down + closing
- —
- Monthly P&I
- —
- Monthly cashflow
- —
- DSCR
- —
- Eligible?
- —
Personal DTI + credit; lowest rate.
DSCR
20% down · 8.5% · 30yr
- Down + closing
- —
- Monthly P&I
- —
- Monthly cashflow
- —
- DSCR
- —
- Eligible?
- —
No personal income docs; deal must DSCR.
Hard money
10% down · 12.0% · 12mo
- Down + closing
- —
- Monthly P&I
- —
- Monthly cashflow
- —
- DSCR
- —
- Eligible?
- —
Short-term bridge; refi at stabilization.
Rent comps 23 comps
| Address | Beds | Baths | Sqft | Rent | $/sqft | DOM | Units | Dist |
|---|---|---|---|---|---|---|---|---|
| 2675 Clipper Cir West Palm Beach, FL | 3.0 | 2.0 | 1984 | $3,500 | $1.76 | 10d | 1 | 0.06mi |
| 9041 Bay Harbour Cir West Palm Beach, FL | 3.0 | 2.0 | 2018 | $3,400 | $1.68 | 19d | 1 | 0.42mi |
| 9041 Bay Harbour Cir West Palm Beach, FL | 3.0 | 2.0 | 2018 | $3,400 | $1.68 | 5d | 1 | 0.42mi |
| 9315 Bridgeport Dr West Palm Beach, FL | 2.0 | 2.0 | 1368 | $2,600 | $1.90 | 26d | 1 | 0.57mi |
| 2312 Curley Cut West Palm Beach, FL | 3.0 | 2.5 | 1972 | $5,000 | $2.54 | 26d | 1 | 0.57mi |
| 9363 Bridgeport Dr West Palm Beach, FL | 2.0 | 2.0 | 1368 | $2,750 | $2.01 | 7d | 1 | 0.57mi |
| 9391 Bridgeport Dr West Palm Beach, FL | 3.0 | 2.0 | 1508 | $4,200 | $2.79 | 26d | 1 | 0.57mi |
| 2325 Sailfish Cove Dr West Palm Beach, FL | 2.0 | 2.0 | 2008 | $3,600 | $1.79 | 26d | 1 | 0.57mi |
| 9766 Galleon Dr West Palm Beach, FL | 2.0 | 2.0 | 1259 | $2,240 | $1.78 | 5d | 1 | 0.66mi |
| 2616 San Andros West Palm Beach, FL | 3.0 | 2.0 | 2288 | $3,600 | $1.57 | 26d | 1 | 0.67mi |
| 2425 Pigeon Cay West Palm Beach, FL | 3.0 | 2.0 | 1762 | $3,540 | $2.01 | 26d | 1 | 0.70mi |
| 9825 Baywinds Dr West Palm Beach, FL | 2.0 | 2.0 | 1199 | $2,110 | $1.76 | 26d | 2 | 0.82mi |
| 9825 Baywinds Blvd Unit 1125 West Palm Beach, FL | 2.0 | 2.0 | 1258 | $1,925 | $1.53 | 22d | 1 | 0.82mi |
| 9662 Sandpiper Ln West Palm Beach, FL | 3.0 | 2.0 | 1961 | $3,200 | $1.63 | 26d | 1 | 0.84mi |
| 9901 Baywinds Dr #3202 West Palm Beach, FL | 3.0 | 2.0 | 1310 | $1,200 | $0.92 | 17d | 1 | 0.88mi |
| 9901 Baywinds Dr #3202 West Palm Beach, FL | 3.0 | 2.0 | 1310 | $2,500 | $1.91 | 26d | 1 | 0.88mi |
| 2564 Sandy Cay West Palm Beach, FL | 3.0 | 2.0 | 1974 | $4,000 | $2.03 | 26d | 1 | 0.92mi |
| 9873 Baywinds Dr #5212 West Palm Beach, FL | 3.0 | 2.0 | 1310 | $2,450 | $1.87 | 26d | 1 | 0.93mi |
| 8410 Cargill Pt West Palm Beach, FL | 3.0 | 2.0 | 1421 | $3,350 | $2.36 | 26d | 1 | 0.94mi |
| 3910 Sandy Cay West Palm Beach, FL | 3.0 | 2.0 | 1280 | $2,140 | $1.67 | 5d | 1 | 0.96mi |
| 1990 Augustine Rd West Palm Beach, FL | 1.0–2.0 | 1.0–2.0 | 1019 | $2,567 | $2.52 | 1d | 15 | 1.21mi |
| 2830 Bellarosa Cir West Palm Beach, FL | 3.0 | 2.5 | 2046 | $3,300 | $1.61 | 26d | 1 | 1.29mi |
| 2106 Belcara Ct West Palm Beach, FL | 3.0 | 2.0 | 1891 | $3,400 | $1.80 | 26d | 1 | 1.48mi |
HOA detail
- Monthly dues
- $649 · $7,788/yr
- Likely covers
- internetcable
Listing history 11 events
-
2026-06-07statusdays on market $424,900 Pending 89 DOM
-
2026-06-04days on market $424,900 Active 87 DOM
-
2026-06-03days on market $424,900 Active 86 DOM
-
2026-06-02days on market $424,900 Active 85 DOM
-
2026-06-01days on market $424,900 Active 84 DOM
-
2026-05-31days on market $424,900 Active 83 DOM
-
2026-05-06price $424,900
-
2026-05-06price $434,900
-
2026-04-24price $449,000
-
2026-03-08$459,000 Active
-
2002-02-12soldstatus $797,900
ⓘ Source: listings_history table (triggers on properties + properties_extension) + one-shot
backfill from property_details.listing_events for pre-trigger history.
Tax reassessment forecast FL · Resets to sale price
- Current annual tax
- $4,912 · $409/mo
- Projected year-2 tax
- $4,912 · $409/mo
- Expected delta
- $0/yr ($0/mo · 0.0%)
ⓘ Screening estimate from a state-policy table — verify with the county assessor before closing.
Climate risk First Street
- Flood 1/10 Low FEMA zone X (unshaded) · 0% chance over 30 yrs
- Wildfire 7/10 Severe
- Heat 9/10 Extreme 7 d/yr ≥107°F today · 25 d/yr by 30 yrs out
- Wind 10/10 Extreme 99% chance of damaging wind over 30 yrs
- Air quality 2/10 Low 0 unhealthy d/yr today · 1 by 30 yrs out
Nearby sold comps map
Loading sold comps map…
Walkable amenities ~0.75 mi
Loading nearby amenities…
Taxation est. · year 1
- Rental income
- $38,550
- − Mortgage interest
- −$23,801
- − Property taxes
- −$4,912
- − Insurance
- −$2,124
- − Repairs & maintenance
- −$3,084
- − Management
- −$3,084
- − HOA
- −$7,788
- − Depreciation
- −$12,361
- Taxable loss
- −$18,604
- Est. tax savings @ 24.0%
- +$4,465
- After-tax cash flow
- $-6,644/yr
For passive investors: Depreciation is non-cash, so a rental often shows a tax loss while cash-flowing — sheltering income. Rental losses are passive: they offset passive income freely, and up to $25,000/yr can offset ordinary (W-2) income if you actively participate and your MAGI is under $100k (phasing out to $0 by $150k); unused losses carry forward. On sale, claimed depreciation is recaptured at up to 25%, and gains may owe capital-gains tax (a 1031 exchange can defer both). Figures are a year-1 estimate at your 24.0% rate — not tax advice; consult a CPA.
Schools (NCES district)
- District
- Palm Beach
- NCES district ID
- 1201500
- Math proficiency
- 46% ▼ -16.00%
- Reading proficiency
- 53% ▼ -4.00%
- Median HH income
- $53,943
- Composite
- 42.72/100
- National rank
- #3160
- State rank
- #34 of 73 in FL
Livability — West Palm Beach
- Score
- 82/100
- State rank
- #75
- US rank
- #1255
Category grades
Schools grade is shown separately in the Schools card above.
Census & demographics
- Census place
- West Palm Beach, FL
- County
- Palm Beach County · 1,438,312 people
- City population
- 222,012
- Metro
- Miami-Fort Lauderdale-Pompano Beach, FL
- Population (ZIP)
- 76,863
- Household income
- $92,591
- Rent vs Own
- Severe rent burden
- 1870.0
Population outlook (Palm Beach County) Hauer SSP2
- Today (2025)
- 1,637,487 people
- By 2030
- 1,743,255 · +6.5%
- By 2040
- 1,948,712 · +19.0%
- By 2050
- 2,132,979 · +30.3%
- By 2075
- 2,530,027 · +54.5%
- By 2100
- 2,706,979 · +65.3%
Race, ethnicity, and origin ACS 2023
- Neighborhood character
- Diverse neighborhood (Simpson 0.70)
- Race & ethnicity
- White 44% Hispanic / Latino 24% Black 23% Two or more races 16% Asian 5%
- Hispanic origin (detail)
- Mexican 2% Puerto Rican 5% Cuban 4% Dominican 2%
- Common ancestry
- Hispanic 6% Romanian 2% Italian 1%
- Foreign-born
- 26% · Canada, Jamaica, China
- Languages at home
- 73% English-only · Spanish 17% French/Haitian/Cajun 4% Other Indo-European 2%
Political lean MEDSL · Palm Beach
- 2024 margin
- Toss-up / Even · D 50.0% · R 49.2%
- 2008→2024 swing
- -22.1pp toward R · 2008: 22.9pp · 2024: 0.8pp
- All cycles
- 2024: D+0.8 2020: D+12.8 2016: D+15.3 2012: D+17.0 2008: D+22.9
Not yet ingested
- Civics
- —
Market trends
- HPI YoY
- ▲ 17.04%
- Current HPI
- 903.78
- Rent YoY
- ▲ 0.85%
- Metro
- Miami-Fort Lauderdale-Pompano Beach, FL
- State GDP YoY
- ▲ 3.28%
- F500 in state
- 36
Industry mix (Fortune 500 HQ in FL)
| Industry | F500 HQs | Revenue |
|---|---|---|
| Industrial Technology | 2 | $29B |
|
||
| Insurance | 2 | $17B |
|
||
| Retail | 1 | $60B |
|
||
| Technology Distribution | 1 | $58B |
|
||
| Homebuilding | 1 | $35B |
|
||
| Technology Manufacturing | 1 | $35B |
|
||
Price history
-46.7% since first listed5 events — show timeline
- 2026-05-06 Price Changed $424,900 Beaches MLS
- 2026-05-06 Price Changed $434,900 Beaches MLS
- 2026-04-24 Price Changed $449,000 Beaches MLS
- 2026-03-08 Listed $459,000 Beaches MLS
- 2002-02-12 Sold (Public Records) $797,900 Public Records
Property tax history
+1.4%/yrLatest (2025): $4,912 · +0.6% YoY. Source: county tax records.
Cash-flow waterfall
monthlySold comps — $/sqft
last 12 mo · ≤1 miLoading sold comps…