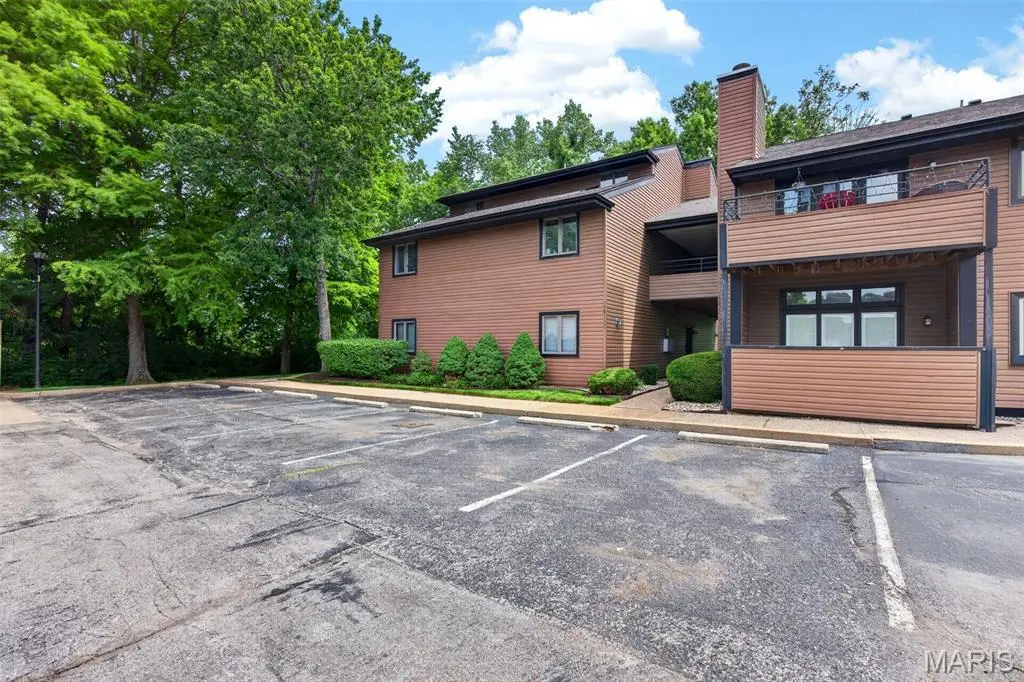
13811 Amiot Dr Unit A · Maryland Heights, MO
Flood risk 1/10 · Minimal
- FEMA flood zone
- X (unshaded)
- Chance of flooding over 30 yrs
- 0.0%
- Est. flood insurance / yr
- $507 – $1,088
Fire risk 1/10 · Minimal
- Est. fire insurance / yr
- $1,054 – $1,958
Heat risk 4/10 · Minor
- Hot days now (above 106°F)
- 7 days/yr
- Hot days in 30 yrs
- 20 days/yr
Wind risk 2/10 · Minimal
- Chance of severe wind over 30 yrs
- 1.0%
Air-quality risk 2/10 · Minimal
- Unhealthy air days now
- 2 days/yr
- Unhealthy air days in 30 yrs
- 2 days/yr
Risk factors via First Street. Map © Google.
Why this score? — see what drove the D+ grade
The composite is a weighted blend of 9 inputs, each scored 0–100. Each bar is that input's sub-score; the figure is the points it added to the 100-point composite (weight × sub-score).
- Cash flow +10.7/30.0
- Appreciation +10.0/10.0
- ARV discount +7.5/15.0
- 1% rule +5.4/10.0
- Schools +5.1/10.0
- Livability +3.6/5.0
- DSCR +3.1/10.0
- Condition / age +2.5/5.0
- Rent growth +1.8/5.0
$168,500
🖨 Deal sheet (PDF) 📄 Offer letter ✓ Due diligence
Listing remarks MLS
Beautifully renovated main floor condo in quiet and sought after Creve Coeur Station complex. You will love the 10 ft ceilings, hardwood floors, white shaker cabinets, master suite, new neutral paint, updated light fixtures, stainless steel appliances, fireplace, garage space, complex pool, in unit laundry, patio space, and so much more that this condo has to offer! Everything has been totally renovated, and it is located in top rated Parkway School District. Schedule your showing today!
Key facts
- $386 HOA
- Garage
- Community pool
Property features AI
Finance
- Financial info: Lease not considered; No second mortgage listed
- HOA & community: HOA: DNI Properties; Monthly association fee of $386; HOA covers common area maintenance, exterior maintenance, pool, sewer, snow removal, trash and water
Exterior
- Parking: 1-car garage
- Utilities: Public water; Public sewer; Cable available; Electric service (other)
- Home design: Residential condominium; One story
- Construction: Wood siding
- Exterior features: Level lot; Community pool
Interior
- Bedrooms: 2 bedrooms (both on the main level)
- Bathrooms: 2 full bathrooms (main level)
- Heating & cooling: Forced air heating; Central air conditioning
- Interior features: One-level living; Fireplace
Neighborhood map
What this means for you Summary
Snapshot
- This is a 2-bed/2.0-bath condo listed at $168k.
Deal economics
- At list price, monthly cash flow is $-80 ($-962/yr) — negative.
- To cash-flow at today's rent, offer at most $154k (8.4% below list).
- Meets the 1% rule at list price ($2k rent vs $168k).
- Recommended offer: $154k (8.4% below list) — sets the bar for cash-flow.
- Cap rate 5.7% vs local median 4.3% in Maryland Heights — top-decile yield for the area; either an underpriced asset or a hidden risk that comps aren't pricing in. Stress-test before assuming the spread holds.
Location & tenants
- Location reads 71/100 on livability (#101 in MO) — a middle-class / working-renter tenant base. Strengths: cost of living A+, housing A+, crime A-; Watch: health & safety C-, amenities F, commute F.
- Parkway C-2 (suburban): math 49% / reading 62% proficiency, ranked #18 of 324 in MO (top 6%) — acceptable for families but not a draw, mixed tenant base, ~2y average lease; only 14% free/reduced lunch — higher-income household profile.
- Zoned schools: Ross Elem. (math 27% / reading 42%, grade F, #676 of 1,115 statewide, top 66%, 385 students, 32% FRL); North High (math 35% / reading 70%, grade C-, #89 of 521 statewide, top 17%, 1,074 students, 34% FRL) — zoned schools average 33% FRL vs 14% district-wide (19 pts higher); higher-poverty schools than district average — tighter screening recommended.
- Zoned-school proficiency averages 44% at this address vs 56% district-wide (-12 pts) — the specific schools serving this property underperform the Parkway C-2 average; the district grade overstates school quality for this exact location.
- Market conditions: Rents soft (-3.0%/yr); 170 active listings in the ZIP; 8 comparable units currently listed for rent nearby; rentals lingering (median 44d on market — plan ~5-8 weeks vacancy on turnover, expect pricing pressure); 50% of comp listings sitting > 30 days — soft ceiling on asking rent; solid renter incomes; 920 units permitted in St. Louis County in 2024 (250 in 5+ unit buildings).
Forward outlook
- In year one you build about $18k of equity ($1k loan paydown + $17k appreciation (10.0% local appreciation)).
- At projected returns (10.0% appreciation + 0.0% rent growth), your $47k cash investment doubles in ~3 years — after that, you're playing with house money.
- By year 3, paydown + projected appreciation supports a ~$46k cash-out refi (75% LTV) — recoverable capital for the next deal without selling this one.
Negotiation context
- Only 7 days on market — expect competitive offers; lowballing is unlikely to land.
- 2 sale attempts since 5y ago with the ask held roughly flat each time — persistent listings suggest the price (not the market) is what's stuck; bring a comps-based counter.
- Current owner paid $132k; 27% above their basis — modest negotiation headroom, anchor on the comps not their cost.
Risks & watch-outs
- Watch-outs: HOA is 22% of rent.
Questions for the listing agent
- What do current leases actually rent for vs. the listed asking? Can we see a recent rent roll and the last 12 months of T-12 income?
- What does the HOA fee cover, when was the last increase, and are there any pending special assessments or reserve-fund shortfalls?
- Any open or pending special assessments — roof, HVAC, plumbing, elevator, façade? What's the per-unit balance and payoff schedule, and is the seller paying it off at close or rolling it to the buyer?
- Is there a deadline driving the sale (1031 exchange, divorce, estate, relocation)? That informs how much negotiation room exists.
- Schools are B-rated — typically a magnet for longer-tenancy family renters. What's the average tenant stay here, and is there a school-zone premium baked into asking?
- The area grade is low — what's the realistic commute time and amenity access for the typical tenant pool here? Any planned neighborhood developments (good or bad) we should know about?
- What's the average days-on-market for RENTAL listings here right now (not sales)? A rising rental-DOM trend means longer vacancies and softer asking-rent achievability than the comps imply.
- What's the recent tenant-quality profile in this submarket — average credit score on applications, eviction rate, late-payment / NSF rate, and stable-employment percentage? A property-management company in the area should have these aggregated.
- How much new apartment / multifamily construction is in the pipeline within 1–3 miles? Heavy new supply (>2% of stock underway) typically softens rents 12–24 months out; light construction supports rent growth.
Investment metrics
- 1% rule
- 1.04% ✓
- Cap rate
- 5.72%
- Cash-on-cash
- -2.04%
- DSCR
- 0.91
- GRM
- 8.0
CMA / ARV
No comps found within radius.
Projected returns pro-forma
10.0% appreciation · 0.0% rent growth · sell at horizon
- IRR
- 21.7%
- Equity multiple
- 2.73×
- Total profit
- $81,719
- Equity at exit
- $151,798
- IRR
- 18.8%
- Equity multiple
- 6.00×
- Total profit
- $235,854
- Equity at exit
- $327,358
Cash invested: $47,180 (down + closing). Projections, not guarantees.
Landlord ↔ Tenant lean methodology
- Overall (STATE)
- 81 Strongly Landlord-Friendly
- State Missouri
- 81 Strongly Landlord-Friendly · R+10
- County
- — inherits STATE
- City
- — inherits STATE
ZIP-level market 63146
- Home prices YoY
- 4.9%
- Rents YoY
- -3.0%
- Active inventory
- 170
- Price-to-rent
- 8.0×
Monthly cashflow live
- Estimated rent
- $1,760 high interval (Pro) →
- Mortgage (P&I)
- −$884
- Tax from tax record
- −$131 /mo · $1,573/yr
- Insurance
- −$70
- HOA
- −$386
- Vacancy / Maint / Mgmt
- −$370
- Net cashflow
- $-80
Break-even live
Sensitivity live
| Price | -10% $15 | -5% $-32 | +0% $-80 | +5% $-128 | +10% $-176 |
|---|---|---|---|---|---|
| Rent | -10% $-219 | -5% $-150 | +0% $-80 | +5% $-11 | +10% $59 |
| Rate | -1.0pp $5 | -0.5pp $-37 | base $-80 | +0.5pp $-124 | +1.0pp $-168 |
UW: 25.0% down · 7.5% · 30yr · 1.5% tax · 5.0% vac · 8.0% maint · 8.0% mgmt
Financing live
Cash to close
- Down payment
- $42,125
- Closing costs
- $5,055
- Reserves months
- —
- Total cash needed
- —
Loan-product check · same deal, 3 products live
Conventional
25% down · 7.5% · 30yr
- Down + closing
- —
- Monthly P&I
- —
- Monthly cashflow
- —
- DSCR
- —
- Eligible?
- —
Personal DTI + credit; lowest rate.
DSCR
20% down · 8.5% · 30yr
- Down + closing
- —
- Monthly P&I
- —
- Monthly cashflow
- —
- DSCR
- —
- Eligible?
- —
No personal income docs; deal must DSCR.
Hard money
10% down · 12.0% · 12mo
- Down + closing
- —
- Monthly P&I
- —
- Monthly cashflow
- —
- DSCR
- —
- Eligible?
- —
Short-term bridge; refi at stabilization.
Rent comps 8 comps
| Address | Beds | Baths | Sqft | Rent | $/sqft | DOM | Units | Dist |
|---|---|---|---|---|---|---|---|---|
| 1173 Pompeii Dr Chesterfield, MO | 1.0–2.0 | 1.0–2.0 | 950 | $1,799 | $1.89 | 2d | 23 | 0.76mi |
| 13630 Riverway Dr Chesterfield, MO | 1.0–2.0 | 1.0 | 715 | $1,499 | $2.10 | 4d | 8 | 1.02mi |
| 616 Broadmoor Dr Unit C Chesterfield, MO | 3.0 | 2.0 | 1120 | $1,795 | $1.60 | 8d | 1 | 1.11mi |
| 621 Broadmoor Dr Chesterfield, MO | 2.0 | 2.0 | 900 | $1,945 | $2.16 | 44d | 1 | 1.15mi |
| 502 Broadmoor Dr Unit 506 Chesterfield, MO | 3.0 | 2.5 | 1500 | $2,250 | $1.50 | 24d | 1 | 1.17mi |
| 506 Broadmoor Dr Chesterfield, MO | 3.0 | 2.5 | 1500 | $2,250 | $1.50 | 44d | 1 | 1.17mi |
| 631 Broadmoor Dr Unit A Chesterfield, MO | 3.0 | 2.0 | 1050 | $2,000 | $1.90 | 44d | 1 | 1.20mi |
| 12806 Willowyck Dr Saint Louis, MO | 3.0 | 2.0 | 1456 | $2,500 | $1.72 | 44d | 1 | 1.36mi |
HOA detail condo
- Monthly dues
- $386 · $4,632/yr
- Likely covers
- pool
- Assessments
- None detected in remarks — confirm with the listing agent.
Listing history 5 events
-
2026-06-13statusdays on market $168,500 Pending 7 DOM
-
2026-06-09days on market $168,500 Active 5 DOM
-
2026-06-08days on market $168,500 Active 4 DOM
-
2026-06-07remarks 699-char remark
-
2026-06-07$168,500 Active 3 DOM
ⓘ Source: listings_history table (triggers on properties + properties_extension) + one-shot
backfill from property_details.listing_events for pre-trigger history.
Tax reassessment forecast MO · Resets to sale price
- Current annual tax
- $1,573 · $131/mo
- Projected year-2 tax
- $1,634 · $136/mo
- Expected delta
- +$61/yr (+$5/mo · 3.9%)
ⓘ Screening estimate from a state-policy table — verify with the county assessor before closing.
Climate risk First Street
- Flood 1/10 Low FEMA zone X (unshaded) · 0% chance over 30 yrs
- Wildfire 1/10 Low
- Heat 4/10 Moderate 7 d/yr ≥106°F today · 20 d/yr by 30 yrs out
- Wind 2/10 Low 100% chance of damaging wind over 30 yrs
- Air quality 2/10 Low 2 unhealthy d/yr today · 2 by 30 yrs out
Nearby sold comps map
Loading sold comps map…
Walkable amenities ~0.75 mi
Loading nearby amenities…
Taxation est. · year 1
- Rental income
- $21,125
- − Mortgage interest
- −$9,439
- − Property taxes
- −$1,573
- − Insurance
- −$842
- − Repairs & maintenance
- −$1,690
- − Management
- −$1,690
- − HOA
- −$4,632
- − Depreciation
- −$4,902
- Taxable loss
- −$3,643
- Est. tax savings @ 24.0%
- +$874
- After-tax cash flow
- $-88/yr
For passive investors: Depreciation is non-cash, so a rental often shows a tax loss while cash-flowing — sheltering income. Rental losses are passive: they offset passive income freely, and up to $25,000/yr can offset ordinary (W-2) income if you actively participate and your MAGI is under $100k (phasing out to $0 by $150k); unused losses carry forward. On sale, claimed depreciation is recaptured at up to 25%, and gains may owe capital-gains tax (a 1031 exchange can defer both). Figures are a year-1 estimate at your 24.0% rate — not tax advice; consult a CPA.
Schools (NCES district)
- District
- Parkway C-2
- NCES district ID
- 2923580
- Math proficiency
- 49% ▼ -11.00%
- Reading proficiency
- 62% ▼ -2.00%
- Median HH income
- $83,551
- Composite
- 50.5/100
- National rank
- #1851
- State rank
- #18 of 324 in MO
Livability — Maryland Heights
- Score
- 71/100
- State rank
- #101
- US rank
- #6808
Category grades
Schools grade is shown separately in the Schools card above.
Census & demographics
- Census place
- Maryland Heights, MO
- County
- Saint Louis County · 888,823 people
- City population
- 21,924
- Metro
- St. Louis, MO-IL
- Population (ZIP)
- 30,678
- Household income
- $84,756
- Rent vs Own
- Severe rent burden
- 1156.0
Population outlook (St. Louis County) Hauer SSP2
- Today (2025)
- 1,025,227 people
- By 2030
- 1,028,023 · +0.3%
- By 2040
- 1,020,940 · -0.4%
- By 2050
- 1,007,280 · -1.8%
- By 2075
- 987,277 · -3.7%
- By 2100
- 921,984 · -10.1%
Race, ethnicity, and origin ACS 2023
- Neighborhood character
- Diverse neighborhood (Simpson 0.56)
- Race & ethnicity
- White 63% Asian 17% Black 13% Two or more races 4% Hispanic / Latino 3%
- Common ancestry
- Scotch-Irish 3% Romanian 3% Italian 2%
- Foreign-born
- 19% · China, South Korea, Canada
- Languages at home
- 79% English-only · Other Asian/Pacific 7% Other Indo-European 4% Chinese 3%
Political lean MEDSL · St. Louis
- 2024 margin
- Strong D (+23.4) · D 60.8% · R 37.4% · Other 1.7%
- 2008→2024 swing
- +3.5pp toward D · 2008: 19.9pp · 2024: 23.4pp
- All cycles
- 2024: D+23.4 2020: D+24.0 2016: D+16.2 2012: D+13.7 2008: D+19.9
Not yet ingested
- Civics
- —
Market trends
- HPI YoY
- ▲ 33.10%
- Current HPI
- 711.49
- Rent YoY
- ▼ -2.96%
- Metro
- St. Louis, MO-IL
- State GDP YoY
- ▲ 1.84%
- F500 in state
- 20
Industry mix (Fortune 500 HQ in MO)
| Industry | F500 HQs | Revenue |
|---|---|---|
| Healthcare | 1 | $163B |
|
||
| Insurance | 1 | $21B |
|
||
| Industrial Technology | 1 | $17B |
|
||
| Retail | 1 | $16B |
|
||
| Industrial Distribution | 1 | $10B |
|
||
| Utilities | 1 | $9B |
|
||
Price history
+131.0% since first listed10 events — show timeline
- 2026-06-05 Listed $168,500 MARIS as Distributed by MLS Grid
- 2026-06-05 Coming Soon $168,500 MARIS as Distributed by MLS Grid
- 2021-03-12 Sold (Public Records) $132,500 Public Records
- 2021-03-05 Sold (MLS) — MARIS as Distributed by MLS Grid
- 2021-01-30 Pending — MARIS as Distributed by MLS Grid
- 2021-01-29 Listed $132,500 MARIS as Distributed by MLS Grid
- 2019-12-13 Sold (Public Records) $87,000 Public Records
- 2019-08-28 Sold (Public Records) $60,000 Public Records
- 1993-03-23 Sold (Public Records) — Public Records
- 1986-06-01 Sold (Public Records) $72,930 Public Records
Property tax history
+6.7%/yrLatest (2022): $1,573 · +0.4% YoY. Source: county tax records.
Cash-flow waterfall
monthlySold comps — $/sqft
last 12 mo · ≤1 miLoading sold comps…