 Multi-family
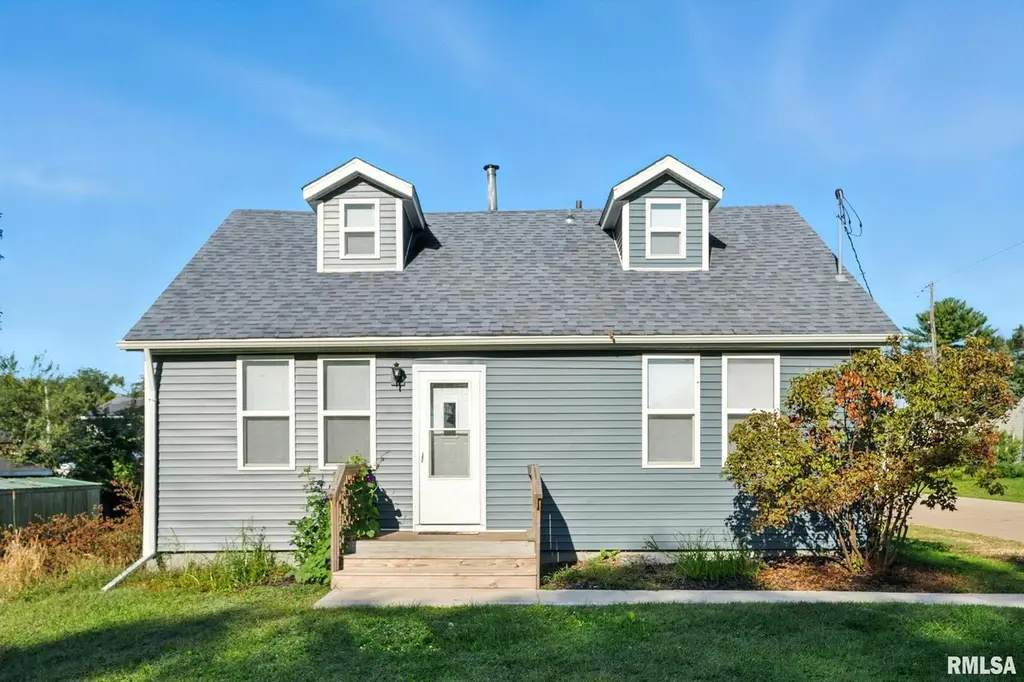
300 S 14th St · Le Claire, IA
Flood risk 1/10 · Minimal
- FEMA flood zone
- X (unshaded)
- Chance of flooding over 30 yrs
- 0.0%
- Est. flood insurance / yr
- $473 – $860
Fire risk 1/10 · Minimal
- Est. fire insurance / yr
- $902 – $1,676
Heat risk 3/10 · Minor
- Hot days now (above 104°F)
- 7 days/yr
- Hot days in 30 yrs
- 16 days/yr
Wind risk 2/10 · Minimal
- Chance of severe wind over 30 yrs
- —
Air-quality risk 2/10 · Minimal
- Unhealthy air days now
- 1 days/yr
- Unhealthy air days in 30 yrs
- 2 days/yr
Risk factors via First Street. Map © Google.
Why this score? — see what drove the A- grade
The composite is a weighted blend of 9 inputs, each scored 0–100. Each bar is that input's sub-score; the figure is the points it added to the 100-point composite (weight × sub-score).
- Cash flow +30.0/30.0
- ARV discount +15.0/15.0
- 1% rule +10.0/10.0
- DSCR +10.0/10.0
- Schools +7.6/10.0
- Livability +3.7/5.0
- Rent growth +2.5/5.0
- Condition / age +2.5/5.0
- Appreciation +0.0/10.0
$259,000
🖨 Deal sheet (PDF) 📄 Offer letter ✓ Due diligence
Multi-family units
County records classify this as Multi-Family (2-4 Unit). Listing-text estimate: 1 unit. estimate disagrees with records
Listing remarks
Welcome to 300 S 14th St, Le Claire, IA 52753-a stunning 4-bedroom, 3-bath home that perfectly blends comfort, style, and convenience! Step inside to discover an inviting open-concept layout, featuring a spacious living room filled with natural light, a modern kitchen with ample cabinetry and updated appliances, and a dining area perfect for family gatherings or entertaining friends. Retreat to the generous primary suite, complete with a private bath, while three additional bedrooms offer plenty of space for family, guests, or a home office. With three full bathrooms, mornings are a breeze for everyone! Enjoy the beautifully landscaped yard-ideal for summer barbecues or relaxing evenings un
Key facts
- Private bath
- Near downtown
- Landscaped yard
Tags
Property features AI
Finance
- HOA & community: No master association fee required
Exterior
- Parking: Detached garage (2 garage spaces, 2 total parking spaces)
- Utilities: Public water; Public sewer; Cable available
- Home design: Detached single-family home; 2 stories; Fee simple ownership; Built approximately 91–100 years ago; Built before 1978
- Construction: Vinyl siding; Asphalt roof; Block foundation; Unfinished basement (approximately 896 sq ft)
- Exterior features: Patio; Level lot; Lot dimensions approximately 150 x 68
Interior
- Kitchen: Eating area / table space; Dishwasher; Range; Range hood
- Bedrooms: 4 bedrooms (Master on main); Bedroom on main (10 x 13, carpet); Bedroom on second level (6 x 21, carpet); Bedroom on second level (9 x 17, carpet); Master bedroom on main (11 x 15, carpet)
- Flooring: Carpet in bedrooms; Vinyl in kitchen and living room
- Bathrooms: 2 full bathrooms; 1 half bathroom
- Heating & cooling: Forced air heating (natural gas); Central air conditioning
- Interior features: 6 total rooms; Unfinished partial basement with egress window
- Laundry & utility: Laundry room; Gas water heater
Neighborhood map
What this means for you Summary
Snapshot
- This is a 3-bed/2.5-bath multifamily listed at $259k.
Deal economics
- At list price, monthly cash flow is $2k ($19k/yr) — positive.
- The deal already cash-flows at list — no discount required.
- Meets the 1% rule at list price ($4k rent vs $259k).
- Recommended offer: $255k (1.5% below list) — sets the bar for market timing.
- Cap rate 13.8% vs local median 4.6% in Le Claire — top-decile yield for the area; either an underpriced asset or a hidden risk that comps aren't pricing in. Stress-test before assuming the spread holds.
Location & tenants
- Location reads 74/100 on livability (#256 in IA, #4,947 nationally) — a middle-class / working-renter tenant base. Strengths: schools A+, crime A+, housing A+; Watch: amenities F, commute F, health & safety F.
- Pleasant Valley Community School District (suburban): math 87% / reading 85% proficiency, ranked #5 of 289 in IA (top 2%) — strong family-tenant draw, lease renewals of 3-5y typical; only 8% free/reduced lunch — higher-income household profile.
- Market conditions: 80 active listings in the ZIP; 805 units permitted in Scott County in 2024 (479 in 5+ unit buildings).
Forward outlook
- Local home prices are declining (-3.0%/yr); year-one equity from $2k of loan paydown is wiped out by about $8k of value loss. Plan a longer hold.
- Scott County population projected at +19% by 2050 — long-run rental-demand tailwind backs the buy-and-hold thesis.
- At projected returns (-3.0% appreciation + 3.0% rent growth), your $73k cash investment doubles in ~5 years — after that, you're playing with house money.
Negotiation context
- It's been on market 27 days — a 2% lower offer ($255k) is reasonable based on typical stale-listing flexibility.
- 8 sale attempts since 4y ago; this cycle's ask is 13532% above the opening price — seller raised mid-cycle; expect resistance to lowballs.
Risks & watch-outs
- Watch-outs: built in 1930 — expect roof / HVAC / electrical / plumbing capex.
Questions for the listing agent
- Built in 1930 — when were the roof, HVAC, electrical panel, plumbing, and water heater last replaced?
- Is there a deadline driving the sale (1031 exchange, divorce, estate, relocation)? That informs how much negotiation room exists.
- Schools are A-rated — typically a magnet for longer-tenancy family renters. What's the average tenant stay here, and is there a school-zone premium baked into asking?
- What's the average days-on-market for RENTAL listings here right now (not sales)? A rising rental-DOM trend means longer vacancies and softer asking-rent achievability than the comps imply.
- What's the recent tenant-quality profile in this submarket — average credit score on applications, eviction rate, late-payment / NSF rate, and stable-employment percentage? A property-management company in the area should have these aggregated.
- How much new apartment / multifamily construction is in the pipeline within 1–3 miles? Heavy new supply (>2% of stock underway) typically softens rents 12–24 months out; light construction supports rent growth.
Investment metrics
- 1% rule
- 1.65% ✓
- Cap rate
- 13.80%
- Cash-on-cash
- 26.83%
- DSCR
- 2.19
- GRM
- 5.1
CMA / ARV
- ARV (median comp)
- $328,321
- List price
- $259,000
- Delta
- -21.11%
- Verdict
- UNDERPRICED
- Comps
- 1 within 2.0 mi
Projected returns pro-forma
-3.0% appreciation · 3.0% rent growth · sell at horizon
- IRR
- 20.7%
- Equity multiple
- 1.85×
- Total profit
- $61,331
- Equity at exit
- $38,618
- IRR
- 28.9%
- Equity multiple
- 3.57×
- Total profit
- $186,524
- Equity at exit
- $22,394
Cash invested: $72,520 (down + closing). Projections, not guarantees.
Landlord ↔ Tenant lean methodology
- Overall (STATE)
- 83 Strongly Landlord-Friendly
- State Iowa
- 83 Strongly Landlord-Friendly · R+6
- County
- — inherits STATE
- City
- — inherits STATE
ZIP-level market 52753
- Home prices YoY
- -31.0%
- Active inventory
- 80
- Price-to-rent
- 10.1×
Monthly cashflow live
- Estimated rent
- $4,262 medium interval (Pro) →
- Mortgage (P&I)
- −$1,358
- Tax from tax record
- −$280 /mo · $3,354/yr
- Insurance
- −$108
- HOA
- −$0
- Vacancy / Maint / Mgmt
- −$895
- Net cashflow
- $1,621
Break-even live
Sensitivity live
| Price | -10% $1,768 | -5% $1,695 | +0% $1,621 | +5% $1,548 | +10% $1,475 |
|---|---|---|---|---|---|
| Rent | -10% $1,285 | -5% $1,453 | +0% $1,621 | +5% $1,790 | +10% $1,958 |
| Rate | -1.0pp $1,752 | -0.5pp $1,687 | base $1,621 | +0.5pp $1,554 | +1.0pp $1,486 |
2-unit breakdown (identical units grouped — click to expand)
| Units | Beds | Baths | Est. rent |
|---|---|---|---|
| 2× units | 2 | 1 | $4,262 |
| #1 | 2 | 1 | $2,131 |
| #2 | 2 | 1 | $2,131 |
| Total (2 units) | $4,262 | ||
UW: 25.0% down · 7.5% · 30yr · 1.5% tax · 5.0% vac · 8.0% maint · 8.0% mgmt
Financing live
Cash to close
- Down payment
- $64,750
- Closing costs
- $7,770
- Reserves months
- —
- Total cash needed
- —
Loan-product check · same deal, 3 products live
Conventional
25% down · 7.5% · 30yr
- Down + closing
- —
- Monthly P&I
- —
- Monthly cashflow
- —
- DSCR
- —
- Eligible?
- —
Personal DTI + credit; lowest rate.
DSCR
20% down · 8.5% · 30yr
- Down + closing
- —
- Monthly P&I
- —
- Monthly cashflow
- —
- DSCR
- —
- Eligible?
- —
No personal income docs; deal must DSCR.
Hard money
10% down · 12.0% · 12mo
- Down + closing
- —
- Monthly P&I
- —
- Monthly cashflow
- —
- DSCR
- —
- Eligible?
- —
Short-term bridge; refi at stabilization.
Listing history 29 events
-
2026-06-09days on market $259,000 Active 27 DOM
-
2026-06-08days on market $259,000 Active 26 DOM
-
2026-06-07days on market $259,000 Active 25 DOM
-
2026-06-05days on market $259,000 Active 22 DOM
-
2026-06-03days on market $259,000 Active 21 DOM
-
2026-06-02days on market $259,000 Active 20 DOM
-
2026-06-01days on market $259,000 Active 19 DOM
-
2026-05-31days on market $259,000 Active 18 DOM
-
2026-05-30days on market $259,000 Active 17 DOM
-
2026-05-13historical
-
2026-05-12$259,000 Active 1253-char remark
-
2026-05-02$1,900
-
2026-04-22historical
-
2026-01-18status Active
-
2026-01-14historical
-
2026-01-08status Active
-
2026-01-06historical
-
2026-01-05historical
-
2025-12-17historical
-
2025-11-21Active
-
2025-11-20historical
-
2025-09-11Active
-
2023-02-06soldstatus $230,000
-
2023-01-27soldstatus $229,900
-
2023-01-27soldstatus $229,900 Closed
-
2022-12-19historical Under Contract
-
2022-12-08$229,900
-
2022-12-08$229,900 Active
-
2020-10-12soldstatus $65,000
ⓘ Source: listings_history table (triggers on properties + properties_extension) + one-shot
backfill from property_details.listing_events for pre-trigger history.
Tax reassessment forecast IA · Partial reset (capped growth)
- Current annual tax
- $3,354 · $280/mo
- Projected year-2 tax
- $3,710 · $309/mo
- Expected delta
- +$356/yr (+$30/mo · 10.6%)
ⓘ Screening estimate from a state-policy table — verify with the county assessor before closing.
Climate risk First Street
- Flood 1/10 Low FEMA zone X (unshaded) · 0% chance over 30 yrs
- Wildfire 1/10 Low
- Heat 3/10 Moderate 7 d/yr ≥104°F today · 16 d/yr by 30 yrs out
- Wind 2/10 Low
- Air quality 2/10 Low 1 unhealthy d/yr today · 2 by 30 yrs out
Nearby sold comps map
Loading sold comps map…
Walkable amenities ~0.75 mi
Loading nearby amenities…
Taxation est. · year 1
- Rental income
- $51,144
- − Mortgage interest
- −$14,508
- − Property taxes
- −$3,354
- − Insurance
- −$1,295
- − Repairs & maintenance
- −$4,092
- − Management
- −$4,092
- − Depreciation
- −$7,535
- Taxable income
- $16,269
- Est. tax owed @ 24.0%
- −$3,905
- After-tax cash flow
- $15,551/yr
For passive investors: Depreciation is non-cash, so a rental often shows a tax loss while cash-flowing — sheltering income. Rental losses are passive: they offset passive income freely, and up to $25,000/yr can offset ordinary (W-2) income if you actively participate and your MAGI is under $100k (phasing out to $0 by $150k); unused losses carry forward. On sale, claimed depreciation is recaptured at up to 25%, and gains may owe capital-gains tax (a 1031 exchange can defer both). Figures are a year-1 estimate at your 24.0% rate — not tax advice; consult a CPA.
Schools (NCES district)
- District
- Pleasant Valley Community School District
- NCES district ID
- 1923110
- Math proficiency
- 87% ▼ -4.00%
- Reading proficiency
- 85% ▼ -2.00%
- Median HH income
- $80,716
- Composite
- 75.59/100
- National rank
- #130
- State rank
- #5 of 289 in IA
Livability — Le Claire
- Score
- 74/100
- State rank
- #256
- US rank
- #4947
Category grades
Schools grade is shown separately in the Schools card above.
Census & demographics
- Census place
- Le Claire, IA
- Population (ZIP)
- 6,111
Population outlook (Scott County) Hauer SSP2
- Today (2025)
- 188,878 people
- By 2030
- 196,648 · +4.1%
- By 2040
- 210,860 · +11.6%
- By 2050
- 224,359 · +18.8%
- By 2075
- 258,884 · +37.1%
- By 2100
- 286,447 · +51.7%
Race, ethnicity, and origin ACS 2023
- Neighborhood character
- Predominantly White (91%)
- Race & ethnicity
- White 91% Two or more races 5% Asian 2% Hispanic / Latino 1%
- Common ancestry
- Serbian 3% Italian 3% Slovak 2%
- Foreign-born
- 0% · Canada
- Languages at home
- 99% English-only · Spanish 1%
Political lean MEDSL · Scott
- 2024 margin
- Toss-up / Even · D 47.3% · R 51.2% · Other 1.4%
- 2008→2024 swing
- -18.4pp toward R · 2008: 14.6pp · 2024: -3.9pp
- All cycles
- 2024: R+3.9 2020: D+3.5 2016: D+1.4 2012: D+13.8 2008: D+14.6
Not yet ingested
- Civics
- —
Market trends
- HPI YoY
- ▼ -91.47%
- Current HPI
- 203.798
- Rent YoY
- —
- Metro
- —
- State GDP YoY
- ▲ 2.48%
- F500 in state
- 4
Industry mix (Fortune 500 HQ in IA)
| Industry | F500 HQs | Revenue |
|---|---|---|
| Financial Services | 1 | $16B |
|
||
| Retail / Convenience | 1 | $15B |
|
||
Price history
-97.1% since first listed22 events — show timeline
- 2026-06-10 Rental Removed $1,900 MRED
- 2026-06-09 Listing Removed — MRED as Distributed by MLS Grid
- 2026-05-13 Listing Removed — MRED as Distributed by MLS Grid
- 2026-05-12 Listed — MRED as Distributed by MLS Grid
- 2026-05-02 Listed for Rent $1,900 MRED
- 2026-04-22 Listing Removed — MRED as Distributed by MLS Grid
- 2026-01-18 Relisted — MRED as Distributed by MLS Grid
- 2026-01-14 Listing Removed — MRED as Distributed by MLS Grid
- 2026-01-08 Relisted — MRED as Distributed by MLS Grid
- 2026-01-06 Listing Removed — RMLSA as Distributed by MLS Grid
- 2026-01-05 Listing Removed — MRED as Distributed by MLS Grid
- 2025-12-17 Listing Removed — MRED as Distributed by MLS Grid
- 2025-11-21 Listed — RMLSA as Distributed by MLS Grid
- 2025-11-20 Listing Removed — RMLSA as Distributed by MLS Grid
- 2025-09-11 Listed — RMLSA as Distributed by MLS Grid
- 2023-02-06 Sold (Public Records) $230,000 Public Records
- 2023-01-27 Sold (MLS) $229,900 RMLSA as Distributed by MLS Grid
- 2023-01-27 Sold (MLS) $229,900 MRED as Distributed by MLS Grid
- 2022-12-19 Contingent — RMLSA as Distributed by MLS Grid
- 2022-12-08 Listed $229,900 RMLSA as Distributed by MLS Grid
- 2022-12-08 Listed $229,900 MRED as Distributed by MLS Grid
- 2020-10-12 Sold (Public Records) $65,000 Public Records
Property tax history
+7.7%/yrLatest (2025): $3,354 · +1.3% YoY. Source: county tax records.
Cash-flow waterfall
monthlySold comps — $/sqft
last 12 mo · ≤1 miLoading sold comps…